Magna Carta, the regulatory state, and the Reserve Bank

In the very early days of this blog, one commenter observed that he was looking forward to posts based on my (rather large) collection of books more than fifty years old.  This is one of them.

Today is the 800th anniversary of the Magna Carta.  The charter is dated 15 June 1215, although apparently it was probably signed a few days later.    In anticipation, I pulled down from the bookcase last week an excellent 1961 biography (by W L Warren) of King John, the monarch who provoked the demands that the charter responded to.    One clause of the Magna Carta is (according to an article in the  Herald the other day) part of current New Zealand law (in fact, here it is), but in a sense the charter is more important for what it came to represent in the stories we tell ourselves about Anglo-American freedoms, limited government etc than for the specifics of the 1215 document (which was annulled only a few months later, only to be later reissued).   The specifics are worth reading –  but probably, for anyone other than scholars of medieval law, only once.

There is plenty of material around on Magna Carta, John, and the history of the times.  I particularly liked this piece by Daniel Hannan.  But I’m writing this post mostly because of a single point that struck me as I read.

Part of what provoked the demands that led to Magna Carta was the king’s increasingly need for money.  John had been fighting to defend his extensive French territories, and wars don’t come cheap.  Unable to raise more money by conventional measures, which even then required the consent of the barons, John’s government chose to resort to ratcheting-up discretionary impositions.

One example was amercements.  As Warren notes:

“It was easy to get on the wrong side of the authorities, to be adjudged in misericordiam – at the king’s mercy –  and to escape only by paying an “amercement”.  Amercements were not imposed for crimes (upon which death, mutilation or outlawry were visited) but for misdemeanours, such as neglect of public duties, failing to bring a criminal to justice, or for mistaken or stumbling pleading in a case before the court.  “You were almost bound to come out of the court poorer than you went in”, it has been said, “whether you were there as plaintiff or defendant, pledge or juryman.”…. The charges imposed by the justices were not often large, but they rarely fell below half a mark (6s 8d) and this was a serious vurden for many men at a time when a wage labourer could not expect to make more than thrity shillings a year, and the goods and chattels of an ordinary peasant were worth little more than ten shillings.  Most men, it seems, could expected to be amerced at least once a year in the normal course, so it was intolerable when, as in 1210, special justices came round the courts in addition to the normal circuit judges who seemed to have no object beyond the collection of money for the king’s coffers.  Though the barons were not usually amerced themselves, they were deeply concerned that their peasants and villagers should not be ruined by hard-hearted royal judges.

John had his own ways of getting extra revenue out of the barons, including levying extremely heavy (much more than conventional) charges on heirs taking up a title and estate.   Technically such levies were within the law, and John pushed them to such an extreme as to provoke Magna Carta

Both abuses were addressed in clauses of the Magna Carta.  Clause 2 limited succession duties to £100 for a baron, and 100 shillings for a knight, and clause 20 provided that

A freeman shall not be amerced for a slight offence except in accordance with the degree of the offence, and for a grave offence he shall be amerced in accordance with its gravity, yet saving his way of living; and a merchant in the same way, saving his stock-in-trade; and a villain shall be amerced in the same way, saving his means of livelihood –  if they have fallen into our mercy: and none of the aforesaid amercements shall be imposed except by the oath of upright men of the neighbourhood.

It perhaps won’t surprise you that in reading this, I had the regulatory actions of the Reserve Bank in mind.  But it isn’t only the Reserve Bank (and it isn’t only a New Zealand issue).  In the last couple of months I’ve read very nice pieces concerned about the growth of the regulatory state, one from the right by Chris Berg (who the NZ Initiative have visiting later this month) in Quadrant and one from the left by David Graeber in Harpers.

As Berg notes:

We often imagine that our modern concerns are distinct from those of the past.  But how much legislative power the executive could exercise without parliamentary approval was one of the great contests in the lead-up to the English Civil War.  The seventeenth century English historian Roger Twysden declared that “the basis or ground of all the liberty and franchise of the subject” was “this maxim, that the king cannot alone alter the law”.  Yet through executive pronouncements and delegation governments have vested vast legislative power in what scholars call “non-majoritarian” regulatory and bureaucratic agencies.”

As a New Zealand First MP put in Parliament recently  “Although my party has issues with this Government’s economic policies, it is elected, whereas Messrs Wheeler and Spencer most definitely are not”

How consistent is it with the sorts of freedoms and limited government that our ancestors fought for that a single unelected official can determine  who private businesses can, and cannot, deal with, and on what terms?  The Governor, for example,  asserts the right to allow banking businesses to be subject one set of constraints in Auckland, and a different set in Dunedin –  although we live in a unitary state.   He plans to impose severe limits on one type of property owners (but not others), in some regions (but not others) to use otherwise identical collateral to support their spending or investment plans.  And he proposes to impose such restrictions through a process that lacks transparency:

  • He commissions policy proposals and the background work in support of them, and then makes final policy decisions himself (there is none of the customary separation between, say,  ministers and officials, or even between an individual minister and the Executive Council)
  • He takes submissions on his proposals, but the public has no automatic or timely access to those submissions before final decisions are made (and no guarantee of seeing them even afterwards)
  • Unlike debates in Parliament on new primary legislation, the Governor’s own internal deliberations are not public.  Minutes of key internal meetings are not published and since, ultimately, the decisions are those of a single person, the mental musings that lead to new law are not even effectively OIA-able).
  • He uses provisions of 25 years old law which were never intended to be used for such intrusive and restrictive purposes.
  • He seeks to compel banks to comply with his new law before he has even gone through the required legal processes to make it law.
  • And, if the previous LVRs restrictions are any guide, he will no doubt seek to require, on pain of potentially severe penalties, banks to comply with the “spirit of the restriction”.  What happened, one might wonder, to law being written in ways that citizens could consciously comply with, not being dependent on the whim of an official as to whether he judged one’s actions to be compliant with the “spirit of the law”?

I’m not suggesting that what the Reserve Bank Governor has been doing is against the law.  But neither, generally, were the sorts of initiatives King John took.  But what is lawful is not necessarily legitimate or right.

Of course, there are more protections for citizens now than there were in the 13th century (judicial review –  which banks seem strangely reluctant to use –  the rather weak reed of the Official Information Act, and ultimately the capacity of Parliament to change the enabling legislation), but it is not the sort of style of government that made Anglo countries some of the most prosperous, and freest, societies on earth.

No doubt there are other examples, in other areas of New Zealand public life, of this sort of discretionary regulatory overreach.   And the regulation-making power of even elected ministers should be a concern (thank goodness for the, not extensively used, powers of the Regulations Review Committee established in the 1980s), but such extensive powers exercised by a single official seem particularly egregious, and disconcerting, in a month when we remember, with gratitude to our forebears, our inheritance of law and politics, of freedom and of limited government.
“We didn’t get it wrong: Wheeler”

I’m getting tired of the subject, and readers probably are too, but I noticed that in today’s Herald Brian Fallow had reported Graeme Wheeler’s case that the Reserve Bank had not made a mistake in raising the OCR so much last year, and holding it up for so long.

I’m sure Graeme had no say in the headline “We didn’t get it wrong: Wheeler”, and perhaps Brian Fallow didn’t either.   But actually the article is a compilation of individual items where the Bank did get it wrong over the last 18 months.  Some of those mistakes were probably quite pardonable (in full or in part), but they were mistakes:

  • The Bank did not forecast a material fall in dairy prices
  • It did not forecast the fall in oil prices
  • It did not forecast the extent of the net migration inflow (or, apparently, the proportion of those arriving who were (a) students, or (b) young workers.
  • It did not forecast the extent of the increase in the labour force participation rate.

As I noted yesterday, dairy prices have been volatile for the last decade.  Faced with dairy prices as high as they were at the start of last year, it was imprudent of the Bank to have acted on the assumption that they would stay anywhere near that high for long.

The Governor seems to have in mind some sort of version of the world where GDP growth had been around 3.5 per cent, and yet labour force growth had been much lower than it was.  That would, almost certainly have been a more inflationary economy than the one we have seen.  And in fact it was what the Bank was forecasting at the start of last year.  But we now know that GDP growth would not have reached anything like 3.5 per cent without the growth in the population and the labour force we’ve seen.  Demand just wasn’t strong enough otherwise.  And, on the other hand, population growth surprises add a lot to demand.

I was also puzzled by the claims around migration.  Fallow reports:

The bank says the composition of the immigrants – more single workers recruited for the Canterbury rebuild and more students – has meant that the boost to the supply-side capacity of the economy has been faster and stronger, and the effect on demand weaker, than headcount alone would historically have indicated.

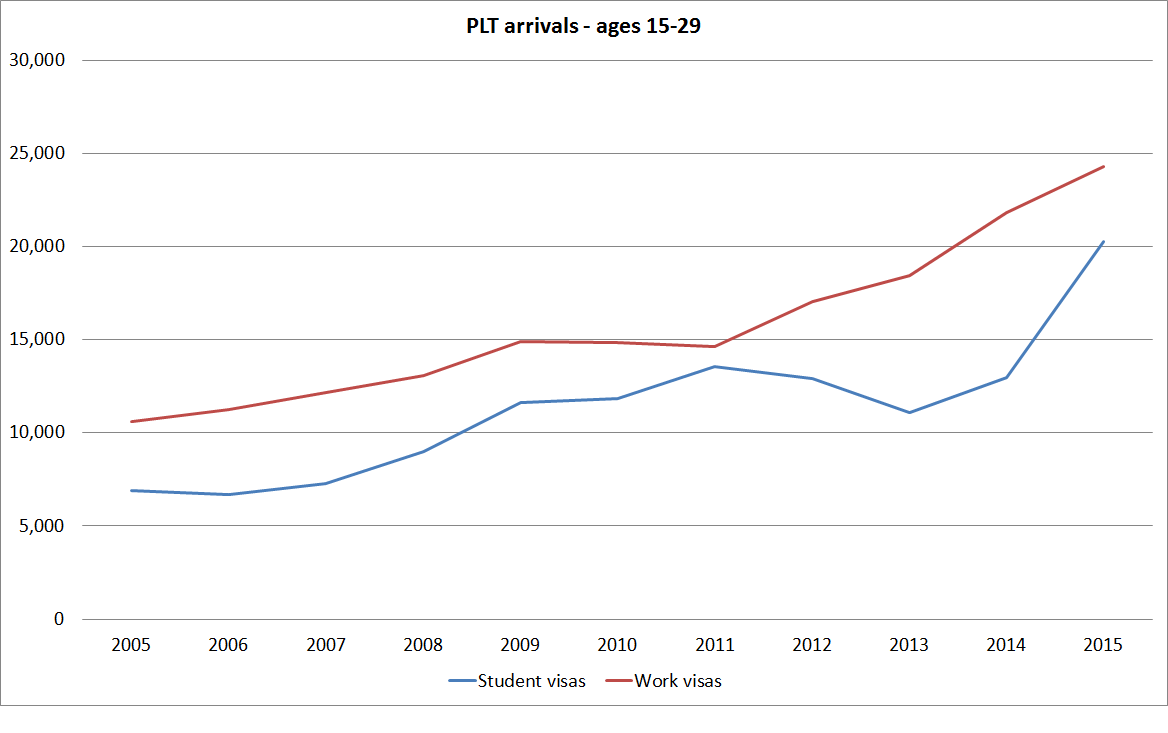
This sentence seems internally contradictory.  More single workers [or presumably married ones without children] certainly have the direction of effect the Bank talks about, but more students goes in the opposite direction.  Foreign students add to demand (for accommodation, for education, and for other consumption items) but generally add very little to labour supply.  This chart shows permanent long-term arrivals for those in the age group 15-29.  If anything, over the last year or two, the rate of increase in those of student visas has been even greater than the increase in the number of young foreign workers.

plt15-29

The article also reports

Combined with capital investment by business it means that it has taken a couple of years longer for the slack in the economy to be taken up and the output gap to turn positive than the bank expected when it started tightening last year.

But as I noted the other day:

  • The Bank’s view of the level of excess capacity that existed 18 months ago, at the start of the tightening cycle, has been revised materially.  Judging spare capacity isn’t easy, but they now think they were wrong about the earlier view that excess capacity had already been fully absorbed.
  • The level of investment since then just has not been very strong.  Growth in hours worked has been quite rapid over the last year, even by the standards of the previous boom, and yet investment did not reach previous boom levels.  (And, of course, when the previous rates of investment were occurring there was still a lot of inflationary pressure). As our best estimate is also that productivity growth has been lousy, this story of an unexpected growth in supply capacity just does not wash.

Economic forecasting is hard, and mistakes will happen.  With the possible exception of the over-optimism about dairy prices, I wouldn’t be very critical of the Bank on any of those forecasting errors.  They are the sort of thing that happens.

But what I think translated the events of the last 18 months into something a little more serious (and again, it isn’t the worst monetary policy mistake ever, by a long shot) is that the Reserve Bank was under no pressure at all to have acted at all last year:

  • Core inflation, on the estimates available to the Bank at the time, was around 1.6 per cent, and had been for several years
  • The unemployment rate was still 6.1 per cent, not far below the sort of level it have averaged in the recession years
  • Credit growth was modest

And inflation had stayed low, to that point, despite the very big and concentrated increase in residential building activity that had already occurred in Christchurch.  For several years, the Bank had (quite reasonably) cited the rebuild as one of the forthcoming major pressures on resources and inflation.  For that matter, there was no sign that commodity prices –  which had been high for a year, while inflation stayed low – were about to rise further.

When inflation is high and resources are demonstrably stretched it is quite understandable when central banks are a little jumpy about new inflationary pressures.  As I noted yesterday, Alan  Bollard raised the OCR four times in succession in 2007 when dairy prices were soaring.  With hindsight, those increases weren’t necessary –  the 2008 recession took care of the inflation, and reversed the dairy price increases –  but I wouldn’t call those 2007 increases a policy mistake.

But in 2014 the Reserve Bank did not need to act.  There were no new inflationary pressures, and the Bank was under no pressure to raise rates, other than the pressure it imposed on itself.  Having started raising the OCR, it was under no pressure to carry on increasing rates.  It was under no pressure, as late as December last year, to be talking of further rate increases.

It was a policy mistake.    They happen.  They have occurred in the past, here and abroad.    And policy mistakes will happen again.

Here’s roughly how, in Graeme Wheeler’s shoes, I  would have answered the question “did you make a mistake?”

Yes, we did.  Monetary policy aims to keep inflation over the medium-term at around 2 per cent.  Doing so means we make extensive use of economic forecasts –  trying to make sense of where we are now, and where things are likely to head over the next couple of years.    Our forecasts were not so very different from those of other economists and agencies     But we misjudged just how much pressure there was (and was going to be) on resources, and as a result we raised interest rates sooner, and further, than was really warranted.

One of the lessons people should take away from this episode is that monetary policy isn’t a precise or surgical tool.  We have to make judgements about things that reasonable people can reach quite different views about.  That means at times we will make mistakes.  When we do, we’ll be very open about them, and correct them as quickly as we can.  What I can’t promise you –  and no one can –  is that there will be no mistakes in the future.

I’m disappointed that we got it wrong this time –  and as the chief executive and single (statutory) decision-maker I have to take responsibility for that error.  Our mistakes matter for people’s lives and businesses.   But you have my commitment that we are going to learn from this episode –  not just about the economy, and also about our processes for making sense of, and responding to, the data.

I’d have applauded an answer like that. I suspect the wider community probably would have too.

Policy interest rate reversals since 2009

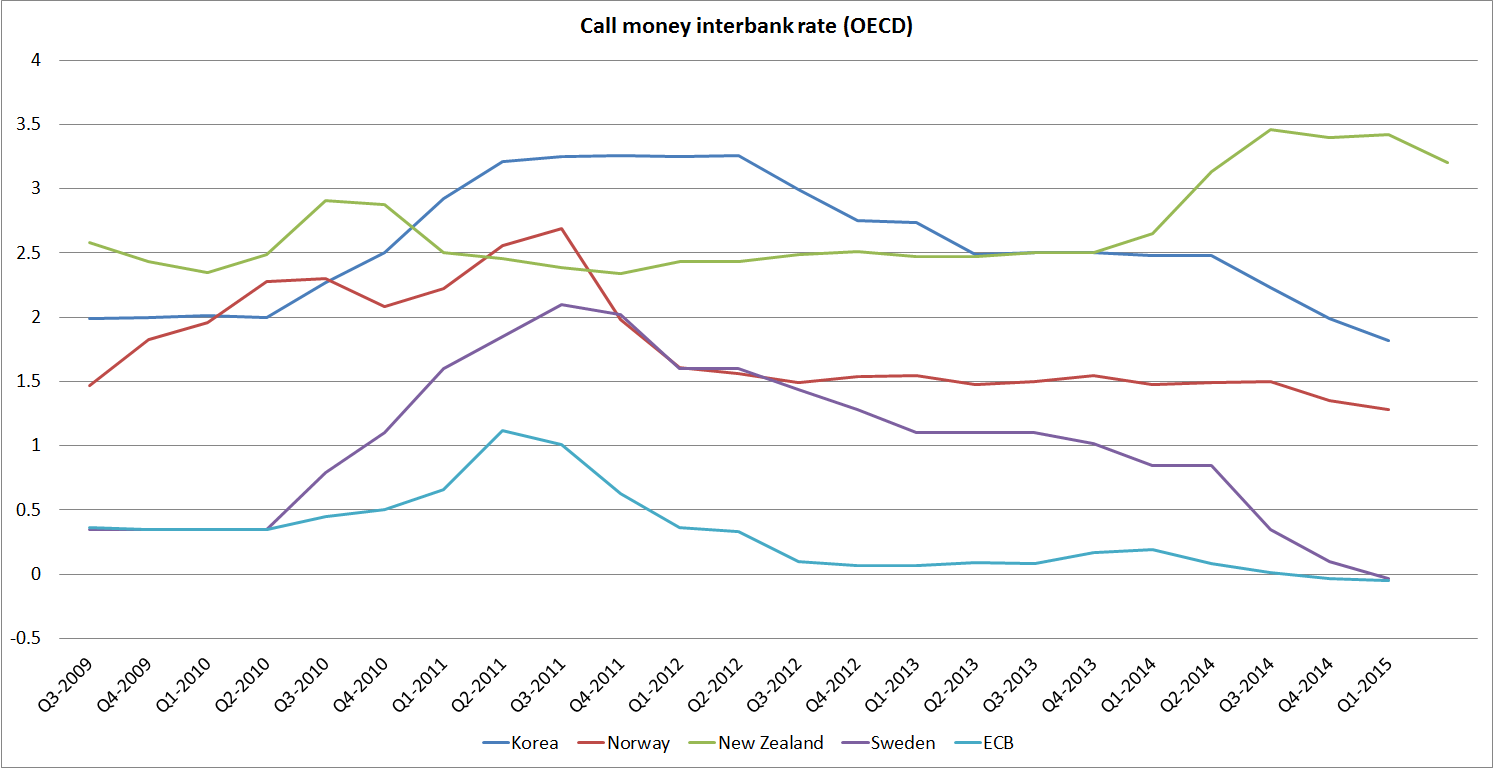
I had a look at ten OECD countries/areas whose central banks have since mid-2009 raised their policy interest rates and subsequently lowered them again.  I was curious as to how quickly those reversals came, and what else was going on.

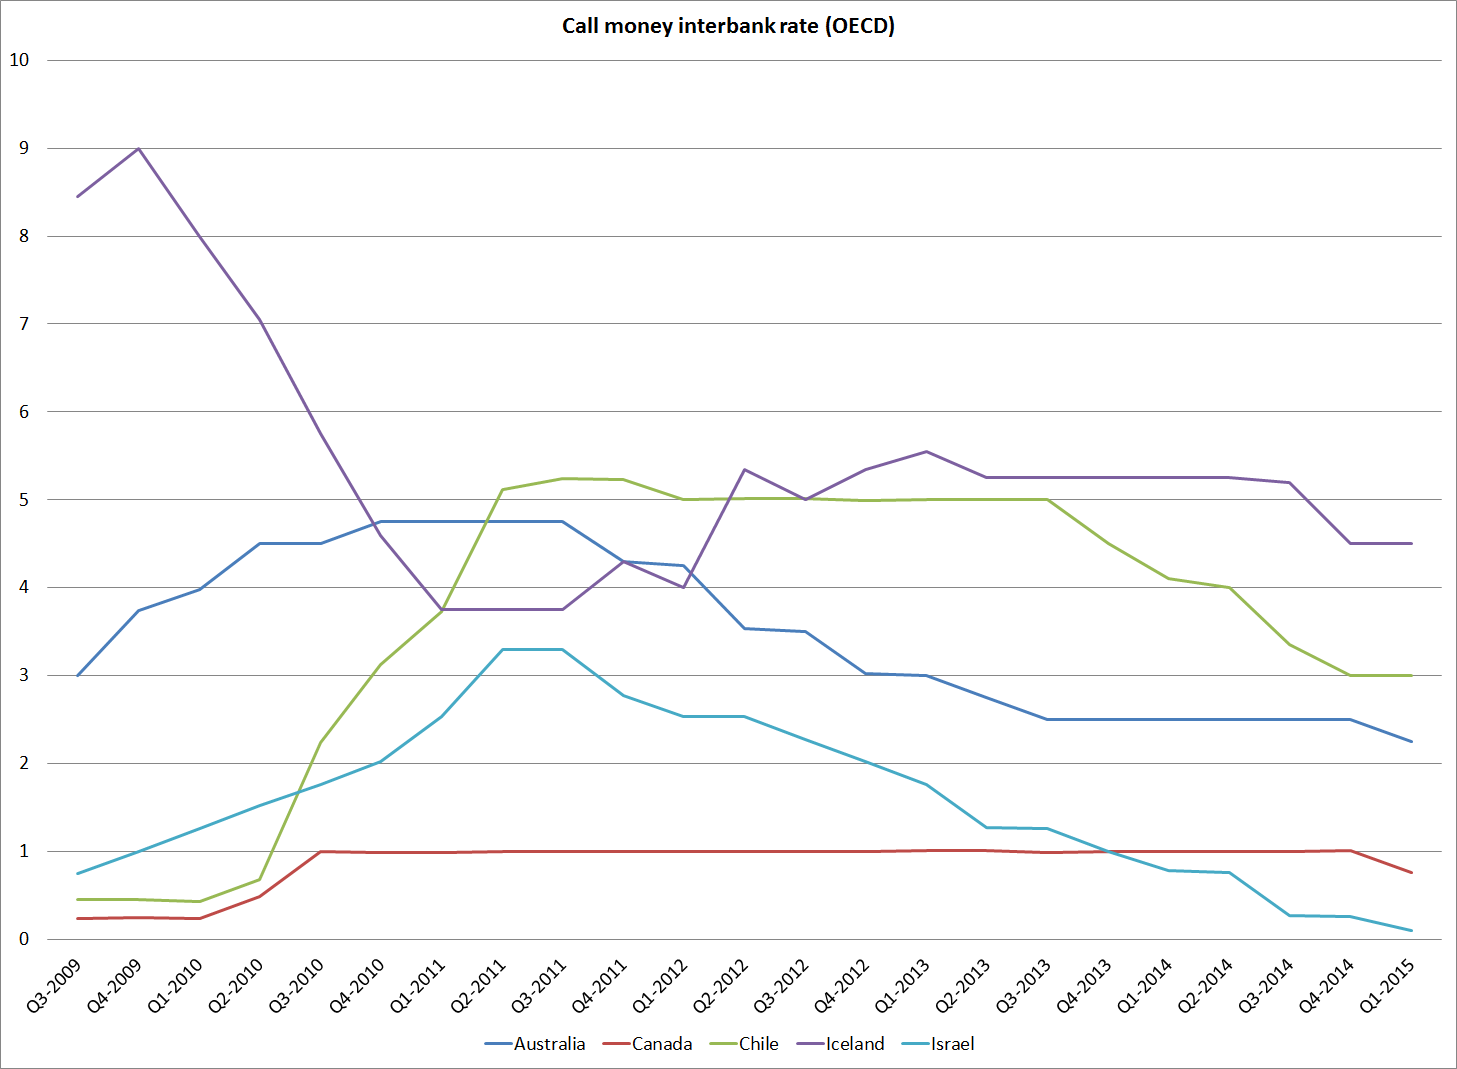
The overnight interest rates for these countries are shown below.  Overnight rates aren’t the same as policy rates, but the OECD has these data readily available.

call1

call2

A couple of cases we can fairly quickly set to one side.  The Bank of Canada began raising its policy rate in mid 2010, and only in late 2014 did it make a single subsequent cut.  Iceland raised rates in 2011, and did not cut again until mid 2014.  Given the turbulent circumstances of Iceland, the stability in policy rates is quite surprising.

Australia and Chile both benefited hugely for a time from the late phase in the hard commodities price boom that peaked in 2011.  In both cases the increases after the 08/09 crisis seemed pretty well-warranted, and in Chile’s case the peak rate was held for two years before some cuts were put in place.  In neither country’s case has inflation been uncomfortably low relative to the target.

I don’t know much about Israel, but the very shortlived nature of the post 2009 peak interest rate, combined with the fact that the policy rate has subsequently been cut to new lows, and that CPI ex food and energy inflation has been running well under 1 per cent for some time suggests a policy mistake.

The Swedish policy mistake has been well-documented by Lars Svensson (and only rather grudgingly accepted by the Stefan Ingves, the Governor of the Riksbank).  Both Sweden and Norway will have been affected by the unforeseen severity of the euro crisis, but in Sweden’s case in particular there was a clear misjudgement by the policy committee.

The ECB’s policy tightening in 2011 proved to be extremely shortlived.  I’m not aware of anyone who would call it anything other than a mistake.  There is probably a variety of factors that influenced the ECB at the time, but they acted too soon, under no (inflation target) pressure, and quickly had to reverse themselves.

Finally, we have the Reserve Bank of New Zealand, the only one of our ten central banks to have reversed itself twice in five years.  The 2010 increases took place at a time when a variety of other central banks were raising policy rates.  There was some reason to think that the recession was behind us, and that it would be prudent to begin raising rates.  I wasn’t involved in the Reserve Bank’s 2010 decisions –  I was on secondment at Treasury –  but from memory I thought they were sensible moves.  As it turned out, by the time the rate increases were being put through the economy was already turning down again, and had a  shallow “double-dip recession”  The February 2011 earthquake was the catalyst for cutting the OCR again.  Initially, it was sold as a pre-emptive step, but we fairly soon realised that the level of interest rates  actually needed to be lower even once the initial shock had passed.

And then the Reserve Bank did it again.  I’m not going to rehearse the ground I covered this morning, but it is difficult not to put this episode –  the increases last year, now needing to be reversed – in the category of a mistake.  It is harder to evaluate other countries’ policies, but I would group it with the Swedish and ECB mistakes.    Monetary policy mistakes do happen, and they can happen on either side (too tight or too loose).  But since 2009 it has been those central banks too eager to anticipate future inflation pressures that have made the mistakes and had to reverse themselves.  As a straw in wind, in a country with an unusual governance model, it should be a little troubling that our central bank appears to be the only one to have made the same mistake twice.  It brings to mind the line from “The Importance of Being Earnest”:

To lose one parent may be regarded as a misfortune; to lose both looks like carelessness.”

Was a mistake made?

Both the Dominion-Post and the Herald this morning devoted their editorials to monetary policy and yesterday’s announcement by Graeme Wheeler.  The Herald, somewhat oddly, commends the Governor on “seeking to get ahead of the curve”.  In principle, I suppose that is always what he is trying to do –  it is, after all, forecast-based inflation targeting.  But I’m not sure that too many people would regard one OCR cut, just beginning to reverse last year’s increases, as “getting ahead of the curve” when core inflation has been so persistently low, and the unemployment rate has remained troublingly high.  A belatedly awakening might be a better description.

But I was more interested in the Dominion-Post’s thoughtful piece.  Here is the heart of it:

This is more than just an abstract number. It is a signal that more was possible. It suggests that, even though growth has been robust for the past couple of years, it might have been higher, with few costs, had the bank kept rates lower. That, in turn, might have meant more jobs and lower unemployment – which, at 5.8 per cent currently, is still too high.

Was it possible to sense any of this earlier? Monetary policy is a difficult business, and reasonable people can disagree. Certainly the plunge in global oil prices, a key factor behind low inflation, was a surprise to most observers. The slump in dairy prices, too, which will likely weigh heavily on the economy, has been steeper and more prolonged than anticipated.

But other factors were perhaps not so shocking – the slow progress of the global economy, the large influx of migrants to New Zealand (in train before last year), the persistence of low wage growth and local unemployment.

Much hinges on the opaque question of the economy’s “capacity” – essentially how hot it is running. It is always difficult to tell at any given moment; the truth gets clearer in the rear-view mirror.

The bank moved swiftly last year when dairy prices soared, the housing market surged, and the economy began hitting its straps. In hindsight, it moved too fast; it turns out there was more capacity – more labour and resources – to go round than it thought.

At the least, bank governor Graeme Wheeler and his team will need to consider if they were too quick to jump then, and too slow to reverse course.

Still, they have done it now, and rightly so.

I happen to agree with the editorial, but that isn’t really my point.  I’m hardly alone in lamenting the quality of a lot of public debate and media coverage of policy issues, but I was impressed that a newspaper editorial in this country could, in a calm way, highlight the uncertainties that monetary policy makers face, and the scope for reasonable people to disagree on the outlook for the economy.    And that the paper could suggest, in a very moderate tone, that it might be time for some critical self-examination by the Governor and his team .  It was the sort of balanced perspective that, say, those charged with holding the Reserve Bank to account, such as the Bank’s Board, might have read with profit, or which their advisers might have written.  (Of course, it is an open question whether it is the sort of piece that sells more newspapers.)

I noticed media accounts of the Governor’s appearance at FEC yesterday report him again denying that he made a mistake last year, whether in raising the OCR so much or holding it up for so long.  I’m not quite sure what he hopes to gain by this stance.  The Governor used to tell staff that his aim was for the Reserve Bank to be the “best small central bank in the world”.  One of the marks of a successful, learning, organisation is the ability to acknowledge mistakes, learn from them, and move on.  I suspect that there is a more chastened attitude internally than is evident publically, but this is a powerful public organisation, and we should reasonably expect to see more evidence of an ability to acknowledge mistakes.  A misjudgement  about monetary policy is not the worst thing in the world  –  it is in the nature of the game.   If anything, a refusal to acknowledge the misjudgement is more worrying, and detrimental to our ability to have confidence in the Governor, or in the single decision-maker governance framework.  It might, for example, be easier for a committee to acknowledge a mistake than for an individual to do so.

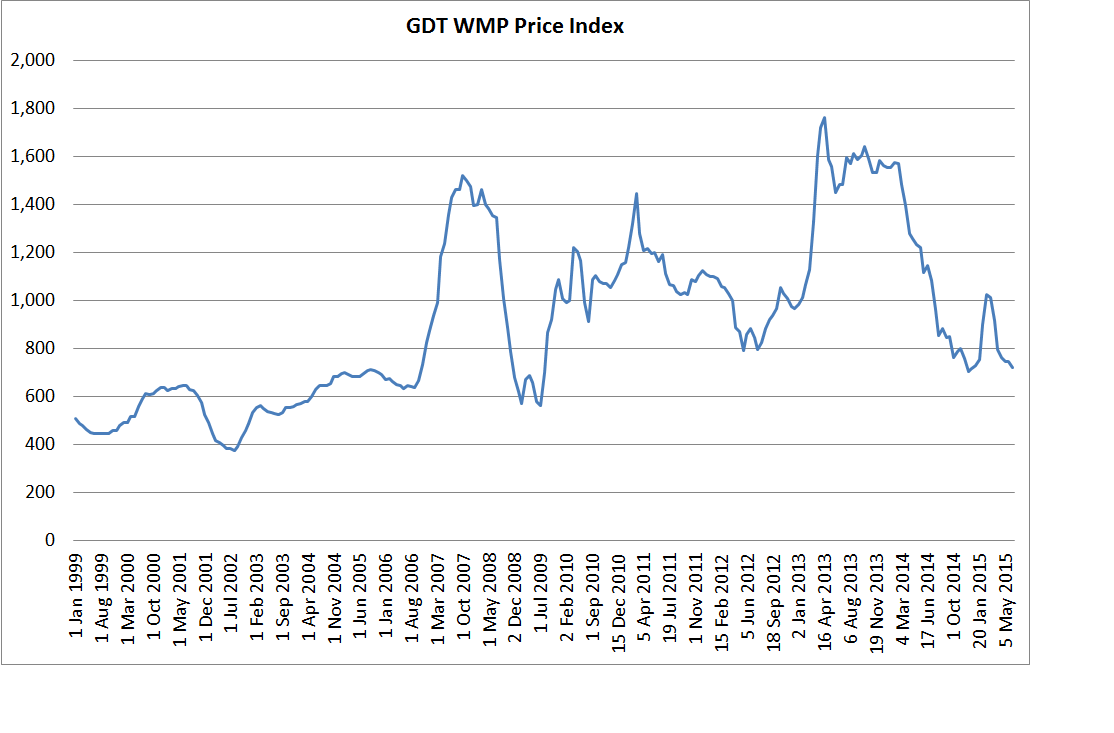
But was it a mistake?  The Governor appears to put a great deal of weight on the high dairy prices at the start of last year.  Even then, the Bank’s forecasts did not have export prices staying up indefinitely.  But the Bank’s optimistic forecasts for dairy prices back then required something quite out of the ordinary.  In the last decade, since EU policies began to change and dairy stockpiles were exhausted, global dairy prices have been much more volatile than previously (and production is much more responsive to changes in output prices and input costs).  At the start of 2015 a reasonable person might not have forecast dairy prices falling quite as low as they have or for long, but they would not have assumed the persistence of anything like the WMP prices seen in 2014.

wmp

This is what the Governor had to say in the March 2014 Monetary Policy Statement as he initiated the tightening cycle

Overall, trading partner growth has seen demand for New Zealand’s goods exports remain robust. Increasing rates of urbanisation and protein consumption in China are supporting demand for many of New Zealand’s commodity exports

Consequently, global prices of New Zealand’s commodities are extremely high, particularly for dairy. Dairy prices increased substantially in the first half of 2013 and remain at those high levels.

Rising demand in New Zealand’s trading partners, and particularly China, will result in continued growth in demand for New Zealand’s exports over the projection. Export prices are expected to remain high relative to history, though ease by about 3 percent over the next year due to an assumed moderation in global dairy prices.

The Bank –  and the Governor –  seemed beguiled by China.  A rather more reasonable approach would have been to have assumed that large fall in dairy prices were likely, even if the Bank could not be quite sure when they would occur.  Forecasters have to have a specific track.  Policymakers need to exercise judgement.

And context matters greatly.  When the first OCR increase was put in place, the unemployment rate was still above 6 per cent, less than one percentage point off the peak during the 2008/09 recession.  The recovery had not (and still has not) ever achieved the sorts of real GDP growth rates seen in earlier recoveries. And, of course, headline and core inflation were both (still) below the midpoint of the target range.  Private sector credit growth was running at around 5 per cent per annum, less than the (then) rate of growth in nominal GDP.

There just was no urgency[1].  There was slack in the economy,  continuing low inflation, modest credit growth.  Reasonable people might have been able to differ about the first OCR increase –  for what its worth, I advised against it, but I was a minority voice –  but the Governor went on tightening, moving at each of four successive reviews, even as dairy prices started falling sharply and core inflation just kept on staying low.  As late as December last year, the Governor was talking about the likely need for further OCR increases.

But he was wrong.  His approach last year was a mistake.  It appeared to be driven, at least in part, by a belief that there was something anomalous about the OCR as low as it had been, and that getting interest rates nearer the Bank’s estimate of neutral would be “a good thing”.

In one sense it shouldn’t be a great surprise that such mistakes are made. The single decision-maker system system is not well-designed to minimise the risk of mistakes (some of Alan Bollard’s early moves were also mistaken, as he later acknowledged).  And the Governor does not have a strong background in monetary policy or macroeconomics, and had not worked in New Zealand for 15 years when he took up the job.  Last year’s OCR adjustments were the first OCR changes he had made.

It would be better if the Governor simply acknowledged that he had made a mistake.  They happen.  It would be better for him, for the organisation (externally and internally –  learning organisations have to create room for staff to make mistakes), and for the country which entrusts so much power to the Governor.  If he is so unwilling to acknowledge a pretty clear-cut mistake, how willing is he to engage in critical self—scrutiny (or encourage it among staff) in areas where there might be rather more shades of grey?

[1] And, thus, the situation was quite different at the start of 2007 when, with unemployment already very low and core inflation very high, a lift in dairy prices, from relatively low levels, prompted Alan Bollard to raise the OCR four times in successive reviews.

Good news, but some continuing concerns

Today’s OCR decision was good news (and a pleasant surprise).  The Reserve Bank has finally recognised just how persistently weak inflation pressures are in New Zealand and has cut the OCR.  It has foreshadowed the possibility of one more cut.  And at least for the next two years there is no hint of the OCR being raised back towards the unchanged  estimate of the “neutral interest rate”.

There is likely to have been an element of deliberate smoothing of the numbers to produce such a flat track for two years ahead.  If so that is something to be welcomed.  I have two  –  slightly contradictory –  reasons for welcoming it.  First, no one (ever) has any good idea what the appropriate OCR will be two years hence. But, second, easing cycles (or tightening cycles) rarely stop at 50 basis points.  In the 16 years of experience with the OCR, the only time the Reserve Bank has moved by only 50 points was when it prematurely raised the OCR in 2010, and then unwound those increases after the February 2011 earthquake.  As I noted yesterday, if the Governor was going to cut the OCR he was most likely to back into modest cuts rather than embrace a wholesale change of view at this stage.

The document does not give a sense of a central bank with a very strong sense of what is going on.  In a sense, that is a step forward.  Huge uncertainty is something all central banks always face, and so many central banks have got things so far wrong over the years since the recession (repeatedly thinking that tightenings will soon be needed)  that it is better to play things by ear, putting quite a lot of weight on actual developments in (core) inflation, rather than on stories about how future events might unfold.

I’m not going to comment in much detail on the numbers in the projections, but I did want to make a couple of points on them and then turn to slightly longer-term policy considerations.

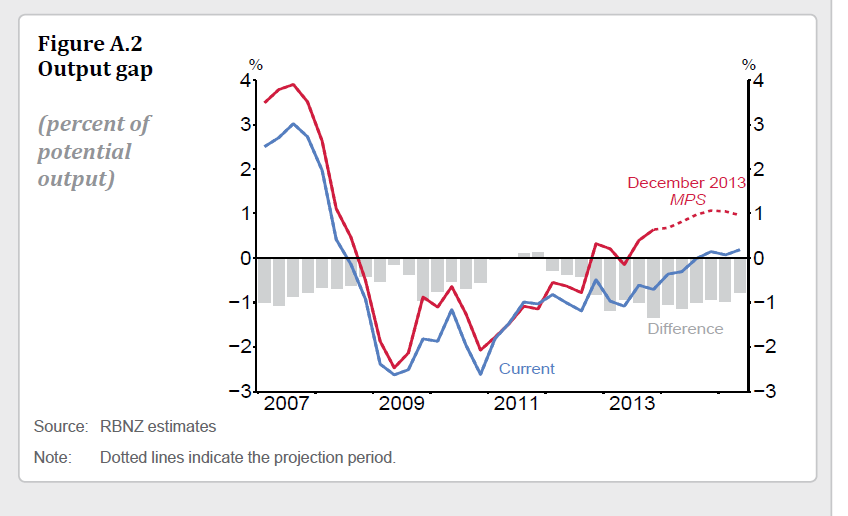
The first point was around this chart from the MPS, showing the Bank’s output gap estimates 18 months ago, and those now.

mps output gap

In one sense, the levels of the two estimates are not hugely different.  And  when we look back five years from now neither might closely resemble the best historical estimates.  But the differences  matter because the Bank, and its forecasting staff, have for several years been putting a lot of weight on the notion that excess capacity was exhausted (and hence it was “time to tighten”).  But in this chart there is almost two years difference in the crossover point.   Other indicators –   notably the unemployment rate –  cast doubt on whether the economy is even now operating at potential.  The point is not that the previous precise estimates are wrong (that is inevitable), but that the Bank has been consistently wrong in its narrative about what has been going on.

The second was around the line, oft-repeated this morning, about the way the economy’s supply potential had expanded rapidly, enabling supply to accommodate growth in demand.   It was presented as a good news story.   But it just is not that good.

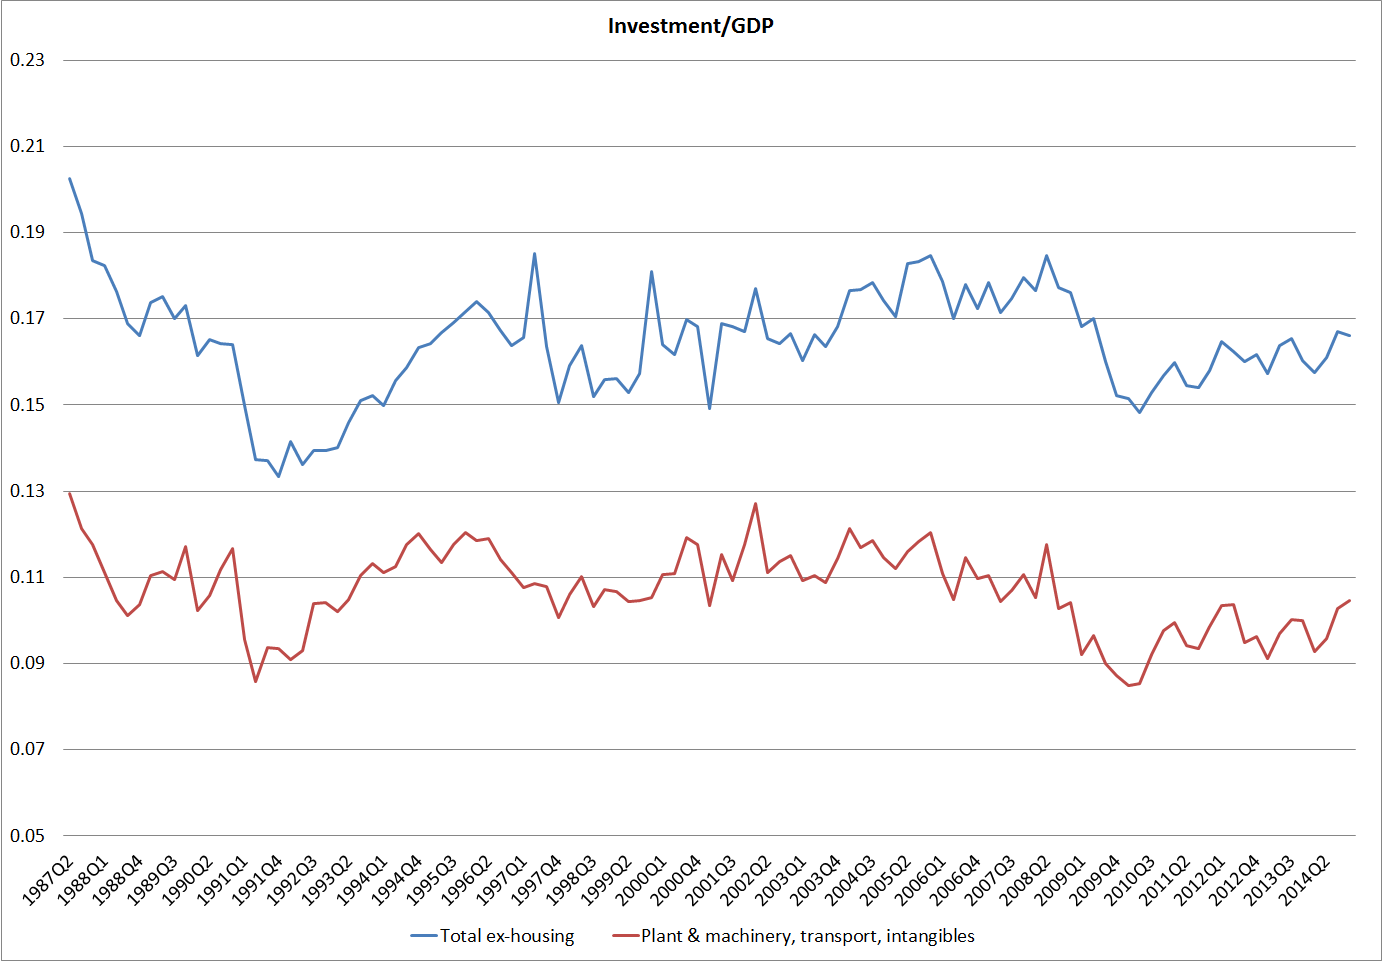
The labour supply has certainly increased rapidly, largely on the back of high (not record) net inward migration.  But in the short-term increases in population growth boost demand more than they boost supply –  always have done in New Zealand, and there is no sign of that changing.  As the tables in the MPS remind us –  and it is a point I’ve made here repeatedly –  productivity growth has been lousy (on the Bank’s measure 0.7 per cent per annum).  And even investment has just not been that strong.  Here is a chart of investment/GDP .

investment mps

I’ve shown both total investment ex housing, and investment in “plant and machinery, transport equipment, and intangibles”.    Investment has been recovering, but on neither of these measures has investment as a share of GDP got back to the average levels seen in the decade prior to the recession,  even though employment has been growing quite rapidly (lots of workers need equipping).  And both measures (even though they exclude housing) will have been boosted by activity in Christchurch to replace lost capacity (think of that underground infrastructure work).  There is no easy way to strip those Christchurch effects out, at least until we get the annual capital stock estimates, but there is really nothing to suggest that underlying growth in per capita capacity has been strong.  A more likely story of what has gone on in New Zealand (as in many other countries) is just that there was quite a lot of excess capacity, which has been enough to accommodate even the demand pressures of a migration inflow without boosting inflation.

The press conference was striking for how little searching scrutiny there was of the Bank’s judgements and performance over the last year or two.  Perhaps FEC will do better this afternoon?  But Rob Hosking of NBR did ask whether the Bank had made a mistake in raising the OCR last year and holding it up for so long.  “Not at all” was the Governor’s response.  His argument was that no one 18 months ago could have anticipated the sharp fall in oil prices or the sharp fall in dairy prices  (which, incidentally, are offsetting effects in the Bank’s forecasts).  I’m not sure about “no one”,  but even if we grant the point, the Governor is surely not arguing the continued weak core inflation, and declines in non-tradables inflation that we have already seen in the data, are a reflection of either of those forecast errors?  Weak commodity prices are going to exert an increasing drag on spending this year, and perhaps beyond,  but weak wage and price inflation were well-entrenched before  the depth of the correction in dairy prices became fully apparent.  I think it is more accurate to say that the Bank misjudged the level of spare capacity at the end of 2013, it misjudged the underlying inflation processes, it misjudged the inflation implications of the resurgence in the housing market, and thus was far too ready to initiate, and carry on, a tightening cycle.  It was a mistake.

As I’ve said before, there is huge uncertainty in monetary policy. In a sense I can understand why the Governor would not want to openly acknowledge that he had made mistakes (he’s human too), but it is a shame that he did not use the opportunity to convey to journalists and the public more of a sense of the limitations of anyone’s knowledge, and the inevitability that central banks will from time to time get it wrong.   And if the Governor did not want to  acknowledge the mistake in the press conference, some more sustained critical self-examination in the Monetary Policy Statement itself would have been appropriate, and consistent with the spirit of the legislative provisions governing such documents.  Perhaps a scenario experiment, running through the Bank’s models the implications of having held the OCR at 2.5 per cent since the start of last year, would have been an interesting basis for a conversation, including with the Bank’s Board (the Minister’s agent in holding the Governor to account).

But perhaps my biggest concern about today was an issue that won’t get any headlines.  It was how the Governor and Assistant Governor dealt with a question about whether the inflation target should be changed.  The Governor noted that outgoing IMF Chief Economist Olivier Blanchard had [been among various others who had] proposed raising inflation targets, to help minimise the risk that the near-zero lower bound would be such a problem in future.  As the Governor noted, Blanchard [and one of his predecessors Ken Rogoff ] had not got a lot of support for his proposal.   But then the Governor went on to note that monetary policy was proving a lot harder than people had expected and that it was very difficult to raise very low inflation expectations.

As I’ve noted previously, for other countries –  already entrenched at zero interest rates –  there is no easy way in which raising the inflation target now would make much difference.  It is too late.   But New Zealand (and Australia) are different.  We still have materially positive policy interest rates.  That means we are both still exposed to the possibility of hitting the zero lower bound in the next serious downturn.  And yet the Governor seems indifferent  to –  or perhaps not even consciously aware of –  the possibility, and the implications for the economy (and for the people who would be unemployed).  Raising the inflation target is certainly not an ideal option, but as I’ve argued here previously unless governments and central banks are going to do something active about removing the near-zero lower bound (and neither the Governor nor the minister has given any hint of doing that) there should be a more serious discussion about whether our inflation target should be raised, as a pre-emptive and precautionary move.   At very least, inflation outcomes in the upper half of the target range would provide slightly better buffers than a continuation of outcomes below the midpoint.   There would be no excuse, given how much notice our central banks have had, if in the next serious downturn New Zealand or Australia become trapped for years with interest rates at some floor (a floor that arises out of policy and legislative choices, not as some force of nature).  Perhaps, at a pinch, it was excusable not to think much about the zero bound when the Governor was signing the PTA in 2012.  It can’t be excusable now.

The Assistant Governor’s response to the question about the target was even more disappointing.  I suspect he was trying to help his boss, by asking the journalist whether he meant to suggest raising or lowering the inflation target.   But it is difficult to believe that a serious senior central banker could, in the current climate of extremely low inflation (here and abroad), seven years on from a recession which took policy rates to their lower limit and has seen them more or less stuck there, could even toy publically with the idea of lowering the inflation target.  If the Bank were to convincingly sort out the zero lower bound issues, then perhaps it would make sense to have that conversation (to aim for “true” price stability, rather than 2 per cent annual inflation).  But the Bank has given no hint that it even takes these risks seriously.

McDermott concluded that “changing targets is a very risky thing to do”.  Well, perhaps, but the risks in considering raising the target need to be weighed against the risks of adverse shocks that deliver New Zealand another recession before  the unemployment rate has even fully recovered from the last recessions.  Those are people’s lives the Bank toys with. As even the Governor recognised, the risks of something very nasty around a Greek exit from the euro are far from trivial –  though how, in the same breath, he could assert that deflation risks had passed in Europe was something that eluded me.

And finally a reminder about the gaps in the Bank’s transparency around monetary policy:

  • The forecasting models, developed at considerable public expense, are still not public
  • We will not see, even with a lag, any minutes from the Governing Committee or the Monetary Policy Committee, and will see no hint of the advice provided to the Governor.
  • Despite the Bank last week releasing 10 year old “forecast week” papers, we still have so sense as to how long a lag we might face before having access to the Bank’s forecasting papers for the last 18 months or so.
  • We will not see any minutes of the Board discussion of monetary policy and the Bank’s adherence to the PTA.  Nor we will see the written advice prepared for the Board.

As I’ve put it previously, the Bank is quite transparent about the things it (and we) don’t know much about –  ie the future –  and not very transparent at all about the things it knows a great deal about (its own analysis and deliberations and debates that went into shaping the Governor’s decisions, both today’s and those of the last 18 months).

Time to cut

Tomorrow the Governor will announce his latest OCR decision and publish the Reserve Bank’s June Monetary Policy Statement.    Having been inside the Reserve Bank for so long, I don’t claim any great expertise in reading the tea leaves as to what the Governor will actually have chosen to do when 10 days or more ago, he sat down, took advice, and made his decision.  I think he probably will not cut the OCR, but if so that will, most probably, be a mistake, compounding the series of mistaken monetary policy judgements he has made since the start of last year.  I shocked some colleagues in the middle of last year when I opined that the Reserve Bank would cut the OCR before the Federal Reserve raised US policy rates.   It was a rather speculative call at the time.    I’m still sticking to it, but I’ll be surprised if confirmation comes quite yet.

One of the things about monetary policy (at least, active discretionary forecast-based monetary policy) is that there will always be considerable uncertainty as to just what the right OCR will be.  As I’ve observed before, with that level of uncertainty there is no particular shame in being wrong, provided one learns quickly from the mistake.  The Reserve Bank doesn’t seem to have been very good at that over the last 18 months.  It should have been apparent pretty quickly that there was little or no basis for the tightening cycle that the Governor initiated last year, when he boldly foreshadowed 200 basis points of OCR increases.  But any recognition of that point has been pretty slow and grudging. Mea culpa, mea culpa, mea máxima culpa it most certainly is not.   Too bad about the people who have lingered on unemployed for longer than was necessary.  Perhaps tomorrow’s MPS will contain some retrospective self-examination of how those mistakes came to be made, and what lessons can be learned from them.  If such self-examination is not strictly required by the section of the Act governing MPSs,  it is pretty strongly encouraged.

A journalist asked me the other day if it was just embarrassment that made the Governor reluctant to reverse course.  I don’t think so.  I think is about views of the world.  All of us have them, and need to have them to make sense of things at all.   And views of what is going on in the world –  paradigms, models – don’t change quickly.  There is a tendency (again, in all of us) to discount observations that might undermine our story, and focus on data, insights, or arguments that tend to support our story.    That makes it hard to get material changes of view, and all the more so when a single decision-maker, who does not set out to foster the contest of ideas and the open-minded examination of alternative views, is in charge.    A downside of the single decision-maker model is the tendency to assign too much weight to one person’s “model”.

In the Governor’s defence, of course, outside observers are still split on what he should do tomorrow.  Many of the market economists in 2013 and 2014 were even more hawkish than the Governor, and each of them faces the same challenge of revising their view of what is going on.

I’m just going to make three other quick points:

  • I noticed the BNZ economics team out a little while ago picking that the OCR would not be cut tomorrow, but arguing that if the OCR was cut the Reserve Bank would signal a series of OCR cuts of perhaps 100 basis points or more.  I think that is very unlikely to be right.  Practically, there just is not much time between the previous OCR review and finalising the forecasts for this Monetary Policy Statement, and big changes in the whole direction of the forecast don’t seem very likely in that time.  But perhaps more important is the point about paradigms or views of the world.  It seems much more likely that the Governor would back reluctantly into any OCR cuts, treating them as little and precautionary.  He could do that within a world view in which he thought the future OCR would still have to be at least as high as it is now.  That seems much more likely than that he would –  with no foreshadowing – embrace a full-scale reversal of last year’s OCR increases.  It might happen, perhaps it even should happen, but it seems very unlikely at this stage.
  • The data.  I know some market economists have changed their view, and their OCR calls, since the last OCR review at the end of April.  But to me, the data since late April don’t seem enough for a major change of view.  For those, like me, who think the OCR should have been lower there has been nothing to contradict that view.  There is no sign of inflation pressures building, and perhaps a little more sign of the building boom tailing off, a little more sign of excess capacity in the labour market, and a little more weakness in dairy prices.   It has been enough to shift a few people across the line, but if one had been a confident believer in the sort of story the Reserve Bank was telling in its last MPS, it would have been nowhere near enough to have prompted a radical revision of one’s view.    The same goes for the world economy.  To me the data flow, especially from the emerging world, looks weak and quite worrying, but that is the read of someone inclined to a pessimistic take.  The Governor, by contrast, has repeatedly articulated a story about the strength of global growth.
  • I like the NZIER’s Shadow Board process, where a group of outsiders offer their views not on what the Reserve Bank will do, but on what it should do.  At times it has been interesting to watch divergences between what bank economists are telling us the Bank will do, and what they think it should do.    Those involved in the Shadow Board are asked to assign probabilities that a range of different possible OCRs will be appropriate, recognising the uncertainty most of us face.    I’m not sure if they are still doing it, but the NZIER innovation prompted the Reserve Bank to introduce such a system for the group advising the Governor on what he should do with the OCR.  We provided written advice (one page each) but also assigned probabilities.  It was designed to help foster debate, and to help recognise (and help the Governor recognise) that when one adviser was advocating one rate and others another rate, both recommendations were typically medians or means of a distribution of views.    The latest Shadow Board results, for tomorrow’s OCR decision, came out today.  Here is the chart of the individual respondents’ views.

shadow board

Two things strike me about the chart.  The first is how tightly bunched the distributions actually are.  It is as if all of them have a difficulty with grappling with just how uncertain we should be about what the right level of the OCR will turn out to have been.  I wonder if they are answering “what would you do if you were Governor” rather than “what OCR will prove to have been right for New Zealand given the inflation target”?  But the second observation is how the two academics in the group –  Viv Hall and Prasanna Gai –  have the tightest distributions of them all.  Viv is 85 per cent confident that 3.5 per cent is right, and Prasanna is 100 per cent confident.    Academics usually remind practitiioners of the huge margins of uncertainty in any of this stuff.  Fan charts have not been popular in New Zealand , but they do help to illustrate the historical range of uncertainties.  Presumably, given the way the PTA is written, the appropriate OCR today depends on the things that will determine the trend inflation outcomes a couple of years hence.  Who can say that they know that with any confidence?

For what it is worth, my own distribution of probabilities for the appropriate level of the OCR tomorrow is roughly as follows:

OCR                                       Probability

1.5                                          5

2                                              5

2.25                                        10

2.5                                          10

2.75                                        12.5

3.0                                          15

3.25                                        12.5

3.5                                          10

3.75                                        10

4                                              5

4.25                                        5

My distribution is wider, and much flatter, than any of those in the Shadow Board grouping, and yet it still feels too narrow to really grapple with the huge uncertainty we – and the Reserve Bank –  all face.

There is a great deal of complex, and pseudo-sophisticated, debate around monetary policy.  But when:

  • Core inflation has been below target midpoint for years
  • Unemployment is still above any estimate of NAIRU
  • Major commodity prices are falling
  • The building cycle –  often a key element in business cycles, and more so than usually this time given the salience of Christchurch –  looks to be turning,
  • And there is little or no sign of material demand or inflation pressures globally

the decision around the OCR really should be straightforward.  It should be cut.

New Zealand manufacturing since 2007

The quarterly manufacturing survey came out this morning.  Noticing that growth in the sector seemed to be levelling off I was curious as to how things looked relative to levels just prior to the recession.

As is well known, the manufacturing share of GDP has been falling for decades in most advanced countries.  China, for example, has picked up a big chunk of global manufacturing, and services have become progressively more important everywhere.

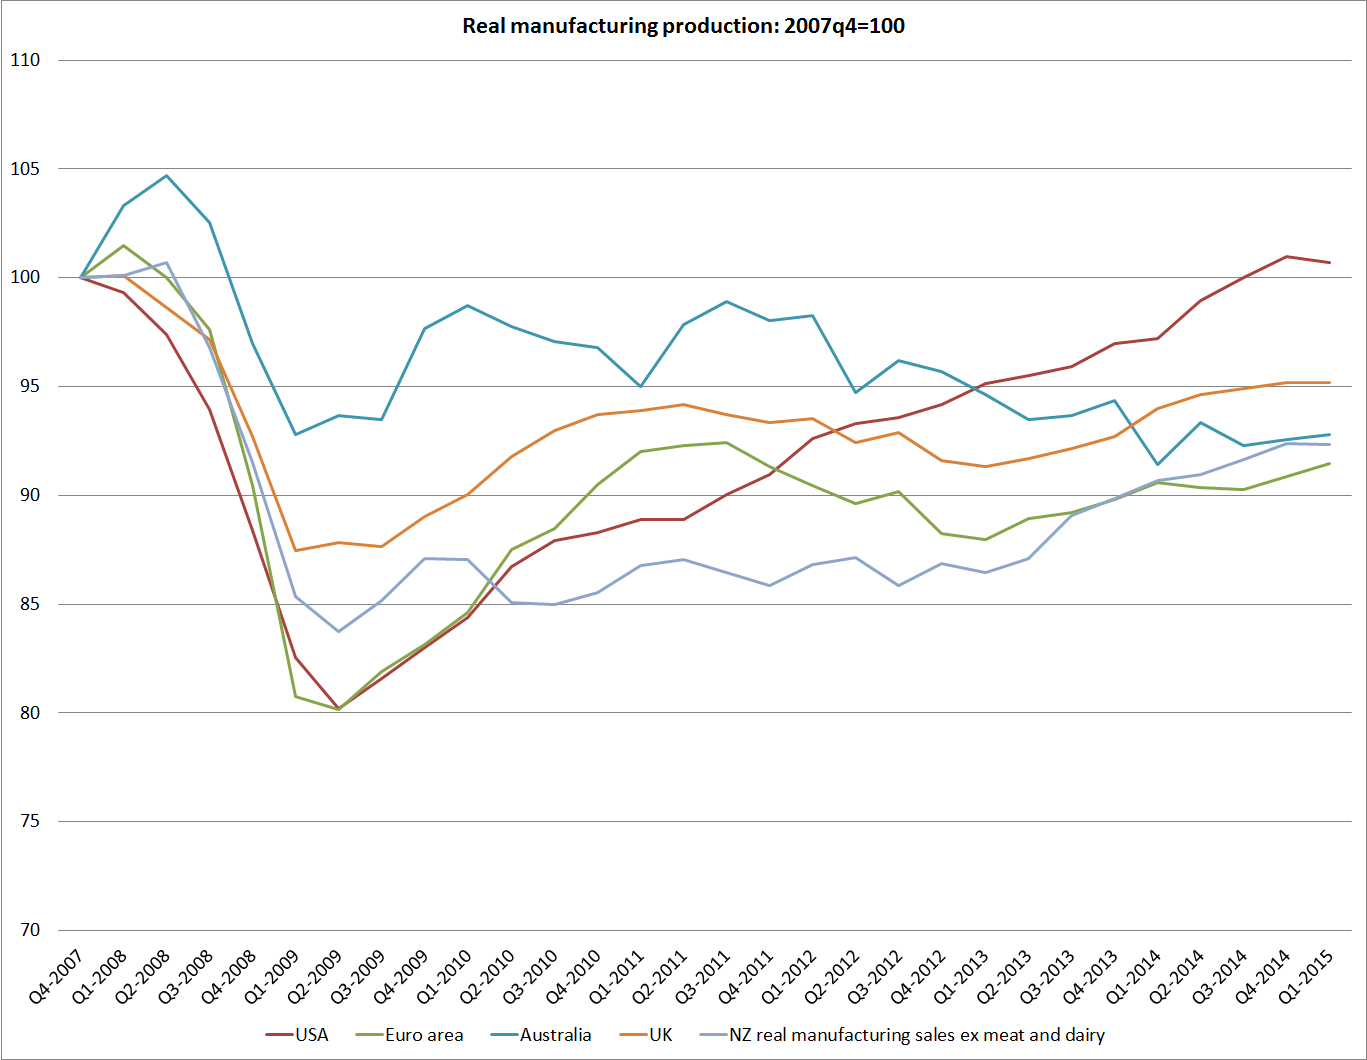
But this chart shows the volume of manufacturing activity (not as a share of GDP, not per capita, just the level) for a few countries/areas since 2007q4.  For the other countries, it is OECD data, while for New Zealand I’ve used the volume of manufacturing sales ex meat and dairy (the rather less noisy series SNZ also publishes).

manuf

I haven’t been paying much attention to these data in the last year or two, but I was interested how far below 2007 activity levels New Zealand manufacturing still is.  As previous Reserve Bank work pointed out, once one strips out meat and dairy, a lot of the activity in New Zealand manufacturing is a derived demand off the back of construction-sector activity.  And the construction sector here has been pretty robust, particularly on the back of the huge volume of work in Christchurch.

But I was also somewhat sobered by how similar the path of manufacturing activity has been in New Zealand and in the euro-area as a whole.  Note that these are not per capita measures, and euro-area population is pretty flat while ours has risen 6 per cent of so since 2007.

The US performance looks relatively good, but in fact is still slightly less good than (flat to falling population) Germany.

I’m not one of those who thinks that the relative decline of manufacturing is a tragedy, but on the other hand I also don’t think that it is a matter of total indifference.  Most likely, the relatively weak manufacturing sector performance in recent years, despite the buoyant construction sector, is a reflection of the persistently high real exchange rate.  Like Graeme Wheeler, I think the real exchange rate is out of line with medium to longer–term economic fundamentals.  A more strongly performing New Zealand economy, one making some progress in closing the gaps to the rest of the OECD, would be likely to see a stronger manufacturing sector.  It might still be shrinking as a share of a fast-growing economy, but a manufacturing sector that has seen no growth at all in almost 20 years doesn’t feel like a feature of a particularly successful economy.

Using the same data series as above, I had a look at what has happened since 1995q1.  Six OECD countries have had weaker manufacturing sector activity than New Zealand.  At least three are current cyclical basket cases (Spain, Italy and Greece), and the gap between the growth rates in manufacturing volumes and in population has been weaker only in Italy, Spain, and France.

Numbers like this certainly don’t suggest immediate policy remedies, but they probably should continue to prompt thinking about just what explains New Zealand’s disappointing economic performance.

Growth 1995 to 2015
Manufacturing Population
Italy -17.6 7.8
Spain -10.7 20.2
France -5.3 11.3
Greece 0 3.3
Japan 0.2 1
UK 1.6 9.9
New Zealand 4.3 22.7

The terms of trade and NZ’s recent economic performance

As people often point out when I run charts like those in yesterday’s post, real or volume measures of value-added are all very well, but they don’t capture the direct effects of fluctuations in the terms of trade.  We can spend what we earn, and what we earn is a combination of volume and price.

For some purposes, ignoring the terms of trade effects can be more useful.  After all, a country like New Zealand is exposed to quite volatile terms of trade, and those terms of trade are almost wholly outside our control, year to year.  Some firms probably have price-setting power in world markets, and there is some evidence that New Zealand droughts have a short-term impact on world dairy prices, but our overall terms of trade are largely beyond our control.  By contrast, productivity measures (labour or multi-factor) are about what New Zealand (firms) do with the hands we are dealt, and the opportunities we make for ourselves.  It is exceptionally rare (probably unknown) for countries to get sustainably rich just  –  or even primarily –  on changes in the terms of trade.

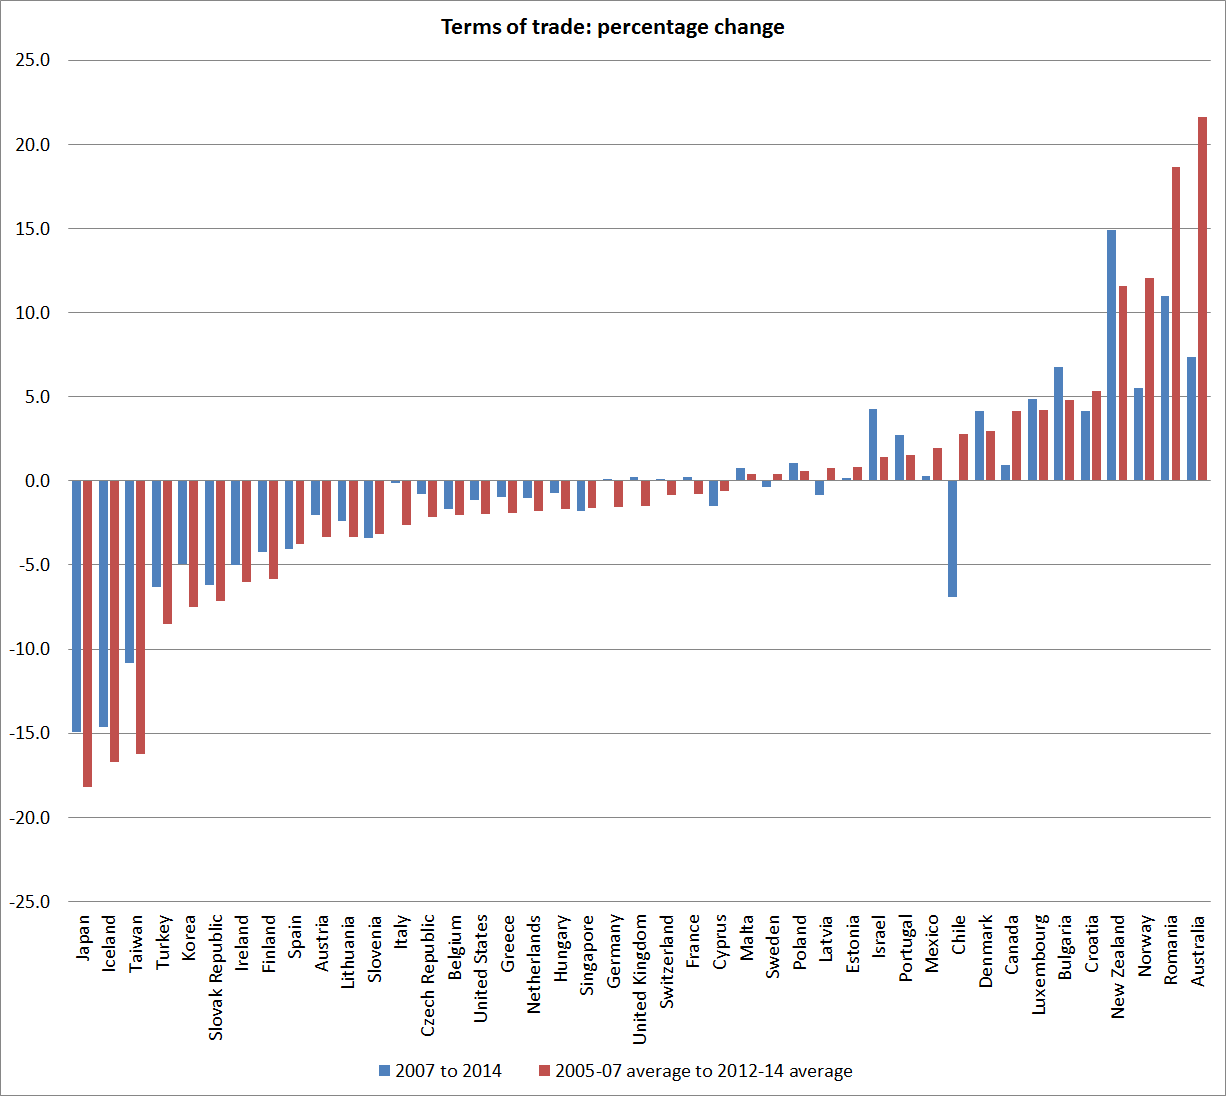
But New Zealand’s terms of trade have done quite well over the last decade or so, reflecting a combination of falling real import prices and good prices, on average, for dairy products in particular.  Here is one chart showing changes in the terms of trade for the 43 advanced countries I discussed yesterday.  There are two different cuts here: the percentage change from 2007 to 2014 and the percentage change from the average level for 2005-2007 to the average level for 2012-2014.  On both New Zealand shows up as having done well.  Indeed, on the measure from 2007 to 2014, we’ve had the largest increase in the terms of trade of any of these countries (no doubt it will fall back somewhat in 2015).

tot crosscountry

How much difference does the terms of trade make? Well, we export and import amounts equal to around 30 per cent of GDP, so a 15 per cent boost to the terms of trade is roughly equivalent to an increase of another 5 percentage points, on top of any growth in the volume of output.  That is certainly a useful boost, but if you look at the first chart in yesterday’s post, it is hardly enough to dramatically transform our ranking.     Looking at the terms of trade does not materially alter the story of how disappointing our overall economy performance has been since 2007.

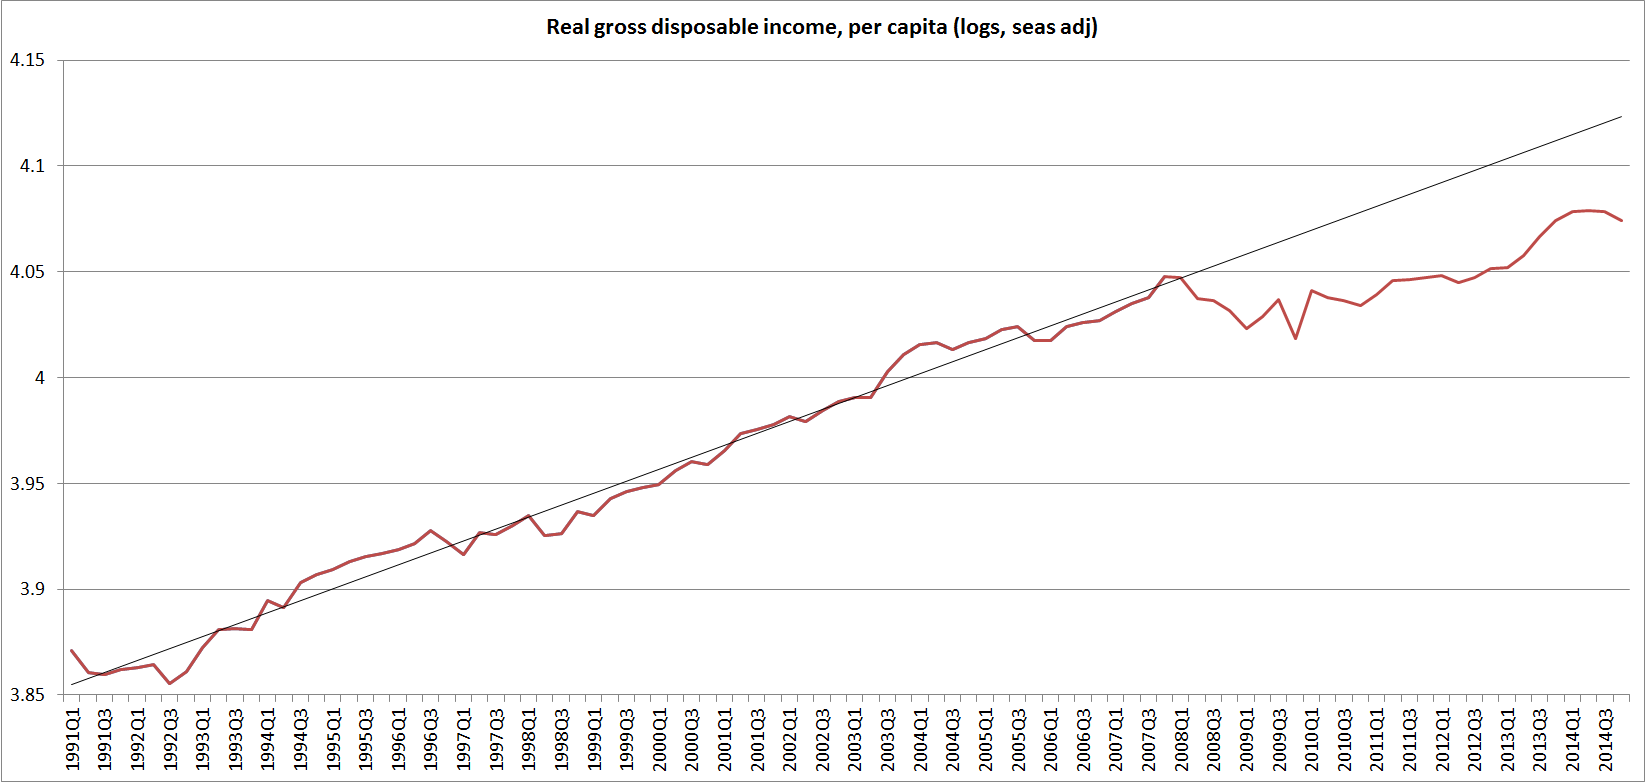
Statistics New Zealand produces a series of per capita Real Gross Disposable Income.  This series tries to estimate New Zealanders’ real purchasing power.  It takes account of both the direct effects of the terms of trade, and of changes in how much of what is produced here has to be paid to foreign providers of (mostly) capital.  Over the period since the recession New Zealand has enjoyed a strong terms of trade, and low interest rates –  as a country with a high level of external debt, we had an unexpected lift in purchasing power as the servicing costs of that debt fell sharply and stayed low.

Here is a chart of that RGDI series.  At present, RGDI per capita is still around 15 per cent below where it would have been if the 1991-2007 trend had continued.

rgdi

So far I’ve focused on the direct effects of the terms of trade.  But it is a little surprising that the strong terms of trade, boosting incomes and relative prices, has not provided more of a boost to real activity in the economy.  A rising terms of trade (and especially an unexpected lift) would typically be expected to stimulate business investment:  higher prices for the goods and services New Zealand firms sell will encourage more investment in those industries. As Daan Steenkamp has illustrated, the terms of trade boom in Australia helped prompt an enormous surge in business investment, which had no counterpart in New Zealand.  Of course, our exchange rate has been very strong, which might have offset much of any additional incentive to invest in the tradables sector in aggregate.  But the higher incomes (higher real purchasing power) might still have been expected to generate a significant boost to investment in the non-tradables sector.  We haven’t seen much sign of it.

As I’ve noted before, if the lift in the term of trade proves quite short-lived it might prove to be a boon that there was not an investment boom, putting in place long-lived projects on the back of a temporary lift in relative prices in our favour.  But most observers do not seem to expect New Zealand’s terms of trade gains of the last decade to fully unwind.

So I’m still puzzled as to why New Zealand has not done better given the very favourable terms of trade.  At the margin, overly tight monetary policy in the last few years has not helped.  And one other factor is the role of the Canterbury earthquakes and the associated repair and rebuilding process.  As the Reserve Bank recognised right from the start, this represented a major non-tradables shock, and all the more so because most of the cost was being covered by offshore reinsurers.  Real resources had to be devoted to the work in Canterbury, and for the most part we New Zealanders did not have to save more to pay for the work (we’d already paid the insurance premia).  Real resources –  especially labour –  can’t be used for two things at once.  Without the earthquakes and the subsequent repair process, those resources would have been freed up for other uses.  Lower interest rates would have been likely to have resulted in a lower exchange rate, improving the attractiveness of investment in New Zealand’s tradables sectors.

Is it enough to explain why New Zealand has not done better?  I don’t really think so, but the impact of the earthquake is certainly one constraint on New Zealand that Australia has not faced, and may be one reason why we have done less well than Australia on most measures since 2007.

How has New Zealand done, compared with other advanced countries, since 2007?

Before I left the Reserve Bank a couple of months ago I had been working on a paper looking at how New Zealand’s economy had performed relative to those of other advanced economies over the period since 2007.  The advanced world as a whole has done pretty badly over that period, but our interest was just in New Zealand’s relative performance.   The Bank’s work has not been published, so I’m going to run some of the ideas and material here (drawing, of course, only on publically available material).

One obvious question is who are the relevant comparator countries.  The member countries of the EU, of the OECD, and Singapore and Taiwan make a reasonable group.  Data are readily available for almost all variables of interest for almost all these countries back to at least the mid-1990s.  And around half of these 43 countries have higher GDP per capita than New Zealand, and half a lower.  There is another group of countries at least as rich as New Zealand, but whose economic fortunes are almost totally shaped by oil.  For these purposes I have set them to one side.  But my comparator grouping does include several countries whose largest exports are commodity-based: New Zealand, Australia, Norway, Chile, Mexico, and Canada.  No comparator group is ever ideal, and no two economies ever face the same set of conditions, but this group seemed large enough to be interesting and small enough to be tractable.

Another question is what period to look at.  I’m focusing on the period since 2007 because 2007 was for most countries around the peak of the previous business cycle –  and just before the financial crisis and global recession took hold in 2008/09.    One could make a case for starting a few years earlier, but when I looked into starting in, say, 2005, it did not make much difference to the cross-country comparisons.  For some things, I’m going to compare how economies have done over 2007-14 with how they did in the previous decade (1997 to 2007).  Again, that choice is to somewhat ad hoc, but it does reflect (a) the limitations of data (for many of the eastern European countries data starts getting patchy any earlier), and (b) that for New Zealand at least 1997 was also a business cycle peak.

To anticipate one objection, many countries’ economies were stretched to the limit in 2007, running positive “output gaps”.  So we should have expected weaker growth since then than in the previous decade.  But (a) the slowdown in growth rates far exceeds anything that can be explained by initial output gaps, and (b) New Zealand’s output gap was not large (by international standards) in 2007.

As time permits, I will run a series of charts and offer some thoughts on New Zealand’s performance, again in an international context.  As I’ve noted previously, New Zealand hasn’t done particularly well in recent years.   A disappointing performance isn’t new, but New Zealand looked as though it had a number of things going for it in recent years.

So let’s have a look at how New Zealand has done?

The first chart is growth in real GDP per capita from 2007 to 2014 (total growth, not annual average growth). These data are drawn from the IMF WEO database, and are calculated in national currencies.

gdppc

On this measure, New Zealand has done just a little better than the median country, and very similar to a bunch of countries from Japan to Canada.   Of the commodity-exporting countries, however, only Norway did less well than New Zealand over this period.

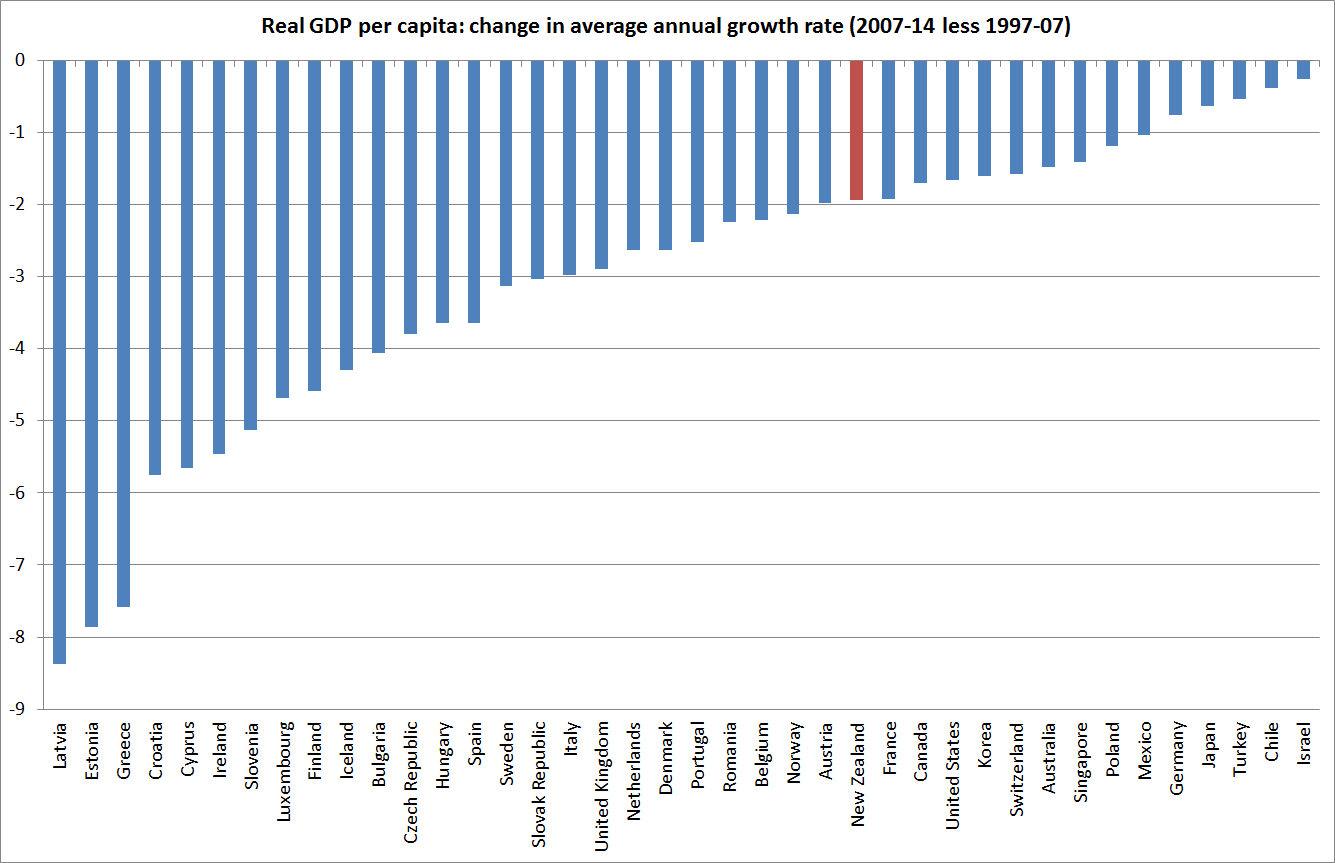
The second chart shows the change in annual average growth rates: how average growth over 2007 to 2014 compared to that for 1997-2007.  Every single one of the countries for which the IMF has data back that far had slower growth in the more recent period than in the earlier period.    New Zealand did just a little less badly than the median country, but again among the commodity-exporters we did better only than Norway.

gdppcchg

Real GDP per capita is a useful measure for many purposes, and it is the most readily available such statistic.  But it does get thrown around by recessions and booms.  A country in a deep recession (such as Greece) might experience a big fall in its real GDP per capita, but the average productivity of its employed workers might be much less adversely affected.  There are “distortions” even here.  In recessions, relatively less productive workers are more likely to be out of work.  But real GDP per hour worked measures are much less cyclically variable than real GDP per capita measures.

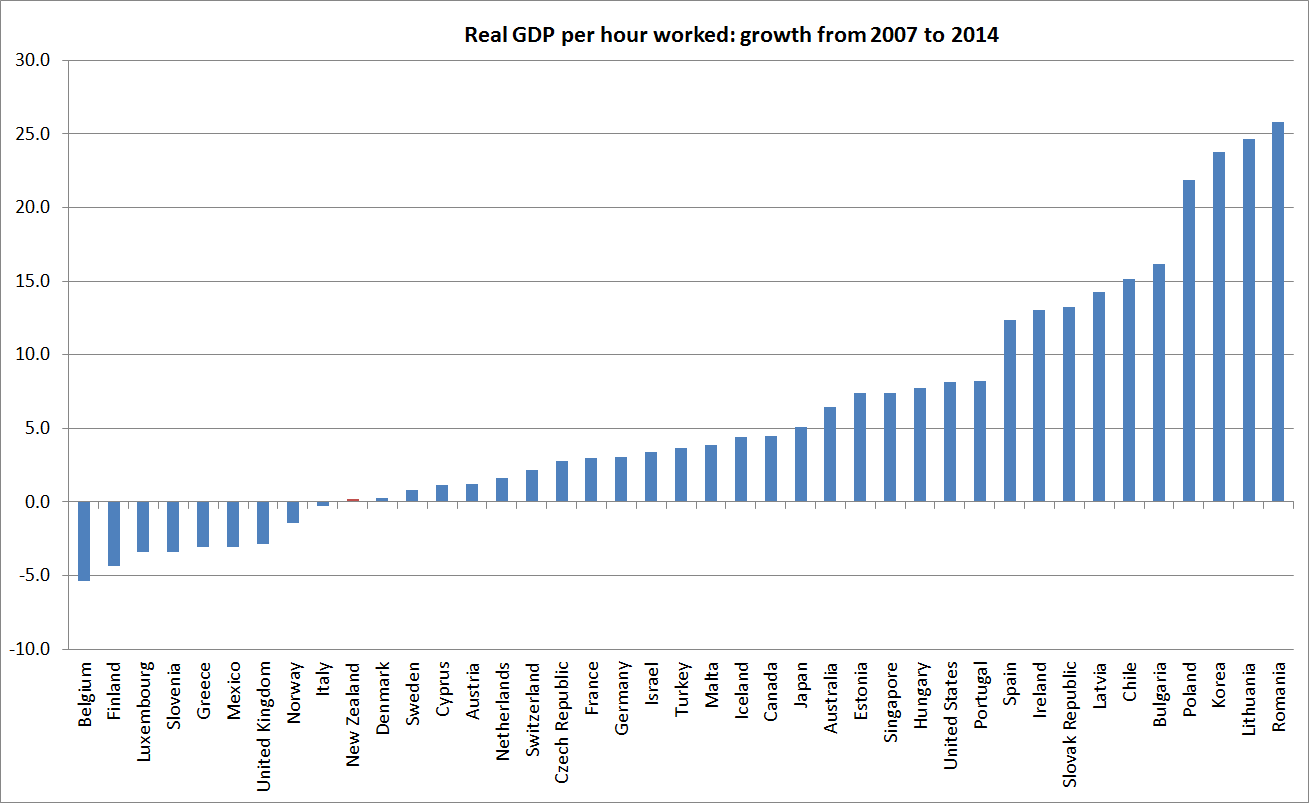
Hours worked per capita data are available for all the countries I’m interested in (except, for some reason, Croatia).  I used them to generate real GDP per hour worked measures, again in national currency terms.

gpdphw

Here, unfortunately, the picture is much less favourable for New Zealand.  Only nine of the countries did worse than New Zealand, and again among the commodity exporters only Norway was worse.

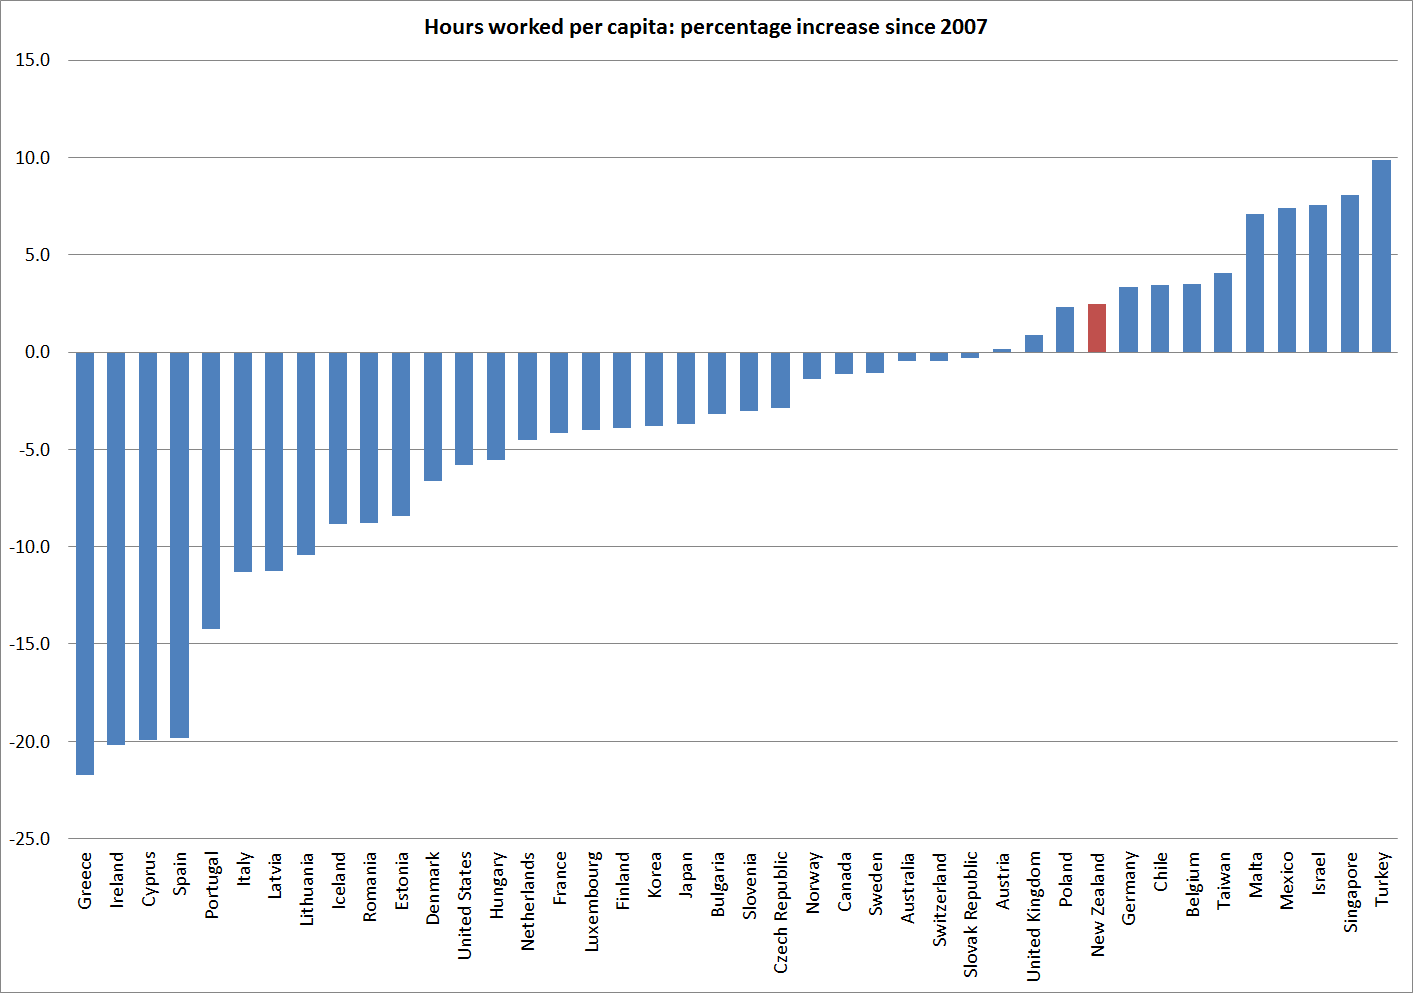
The reconciliation lies in what happened with hours worked per capita.

hours

Only a small number of countries had more of an increase in hours worked per capita than New Zealand since 2007.

Hours worked are an input (which comes at a cost) not an output, so higher hours worked aren’t automatically a good thing.  There are good dimensions to it, if (for example) people are coming off long-term welfare back into the workforce, or older people are keen and able to stay in the workforce.  Hours worked per capita also gets affected by different demographic patterns –  they will be lower in countries with lots of under-15s or over 70s.  But, equally, part of the story of New Zealand in the last 25 years is that we have managed to limit the deterioration in our GDP per capita, relative to that in other countries, by working more.  Productivity would be better.

Over the full period since 1990, here is the change in hours worked per capita for New Zealand and the other Anglo countries, countries with reasonably similar demographics to our own.

hoursanglo

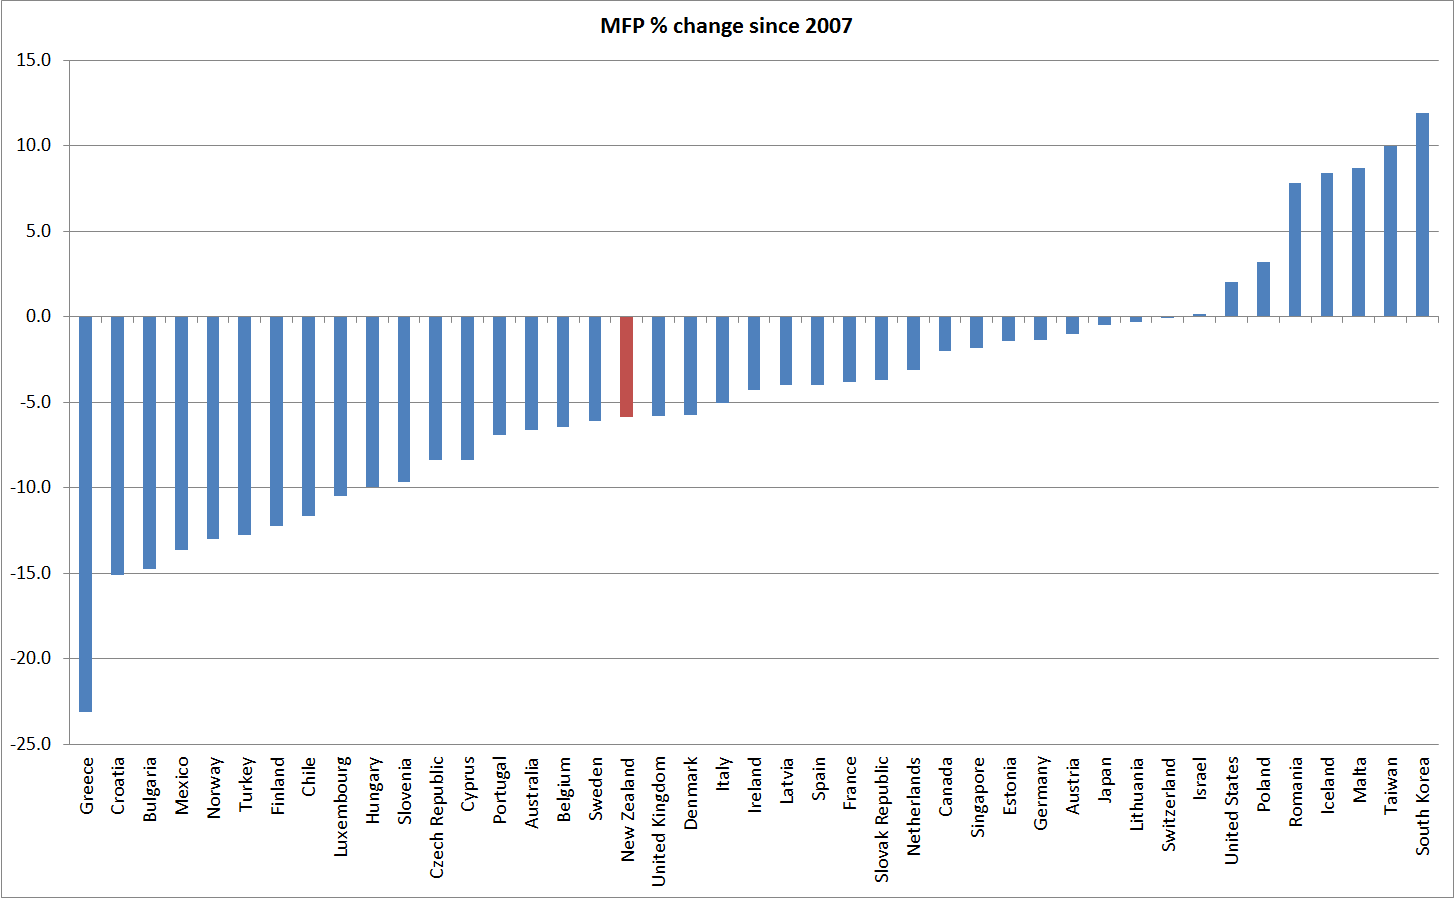
And, then of course, there is multi-factor (or total factor) productivity.  On this measure, which I’ve shown before, most countries have had no MFP growth at all since 2007:

mfp

Time to reform Reserve Bank goverance – the Bank does different things

Reader numbers tell me that anything on housing is more popular than things I write on Reserve Bank governance.  And, in fairness, the housing issues are probably more important.   But a good quality central bank, subject to best-practice governance models, matters too, and the governance issues are actually much easier to deal with. Any minister willing to pick them up would be pushing at an open door.  There would (and should) be debate around details, but no one would fight for the status quo.

This is last in my series of posts on the basic case for changing the Reserve Bank governance model adopted in 1989.  I haven’t set out to re-litigate the choices made in 1989.  At this point, doing so would only be of historical interest, and in any case I’ve tried to illustrate the quite rational and reasonable basis on which the 1989 choices were made.  But things are different now, and the governance model needs to be overhauled to reflect the way things are today.

As I noted on Tuesday, no other country does things the way we do (gives a single unelected official formal decision-making powers over both monetary policy and financial regulatory policy), even though many countries have reformed their systems since 1989.

As I noted on Wednesday, in no other area of policy in New Zealand are decisions made the way we allow Reserve Bank policy to be made.  Policy decisions (as distinct from the application of policy in individuals’ cases) are typically made by elected politicians, or by boards, not by single officials.

As I noted yesterday, back in the late 1980s monetary policy was seen by some as likely to be pretty straightforward and uncontroversial, involving little exercise of discretion. As one of my former colleagues put it, exaggerating to make the point, “with the right PTA, any bozo could be Governor”.  In fact, experience here and abroad suggests that considerable discretion is needed, and the choices have material implications for the short-term performance of the economy.  So it isn’t the sort of policy for which one might appropriately rely just on the talents and preferences of a single unelected individual, no matter how able.

And, if the conception of monetary policy has changed, so has the conception of the Bank itself.  The sort of organisation the Bank was seen as becoming materially influenced the governance model chosen.

In 1989, the Reserve Bank was seen as being en route to becoming a rather simple institution.  It would be primarily a monetary policy institution, with next to no financial risks on its quite small balance sheet.  Banking registration and supervision powers were put in the Act, but no one envisaged the Bank as being engaged in much active discretionary prudential supervision (and key failure management powers were, in any case, reserved to the Minister).

I’ve already talked about the changed conception of monetary policy, which meant that a PTA did not provide any simple or easy way to hold the single unelected decision-maker to account.  But the changes to the rest of the Bank, and their implications for governance and accountability, are probably even greater, and more important.  The Bank has been assigned by Parliament a much wider range of regulatory responsibilities (non-bank deposit-takers, insurance companies, AML, and the payment system (where it is bidding for still more powers)).  That alone represents a hugely greater weight on regulatory matters.  But in addition the Bank has chosen to use its existing statutory powers over banks in ways that involve much greater degrees of discretion.  The most obvious examples are the recent and proposed LVR restrictions, but there is also a lot of (not very transparent)  discretion involved in the approval processes for the capital models used by the big banks in calculating regulatory capital requirements.  Where considerable discretion is involved, the personal preferences of the decision-maker become important.    And that discretion can’t easily be constrained by something like a PTA  –  it is pretty much common ground that nothing like a PTA, that would materially constrain discretion, could be put in place for the financial stability policy responsibilities the Bank has.   The state of knowledge is just too limited[1].

Note that, for these purposes, I’m not questioning whether or not the Bank should have such powers, or should interpret them as it does.  I’m simply making the point that when so much discretion is involved it is inappropriate –  and not seen anywhere else –  to have a single unelected official making the decisions.  It is simply too risky.  It isn’t the way the New Zealand generally allows policy to be made.

New Zealand has pretty good quality institutions and systems of government and public sector governance.  The Reserve Bank governance model has become out of step with practice globally,  with that in the rest of the New Zealand public sector, and with what the Reserve Bank now actually does.  It really is Time to Reform the Governance of the Reserve Bank.

As things appeared in 1989

At the time Reserve Bank was thought of as being (in the process of becoming) a relatively simple institution.  Exchange control had gone in 1984, direct controls had been removed by early 1985, and government banking, tendering and registry functions were gradually being removed from the Bank.  No one in officialdom had much interest in foreign exchange intervention and the foreign reserves the Bank was allowed to hold were well-hedged.

The 1989 Act gave the Reserve Bank powers in a variety of areas, but the Bank was overwhelmingly seen as a monetary policy institution[2]  Many of the clauses of the Act were devoted to the registration of new banks, and the management of bank failures, but there was little or no sense that the Bank was likely to become a particularly active regulatory agency. People close to the work on the 1989 Act report that in detailed discussions around the drafting of the 1989 legislation, little or no attention was given to governance issues as they affected the regulatory responsibilities of the Bank.  Thus, although the governance arrangements (single decision-maker, complemented by the monitoring role of the Board) covered all the Bank’s responsibilities, it is clear that they were designed primarily with (the rather simple conception of) monetary policy in mind.

And, by contrast, how they are today:

The third aspect that has turned out materially differently than the designers of the 1989 legislation expected is the wider role of the Reserve Bank.

In the late 1980s, the Reserve Bank was envisaged primarily as a monetary policy institution, with a very limited – and well-hedged – balance sheet. Since then the Bank’s roles have expanded considerably, but there has been no material change in its (single unelected official) governance.   What are the changes in role?

The Bank has taken on substantial foreign exchange risk, including a more active foreign exchange intervention role. In crisis periods it has assumed substantial credit risk.  And whereas in 1989 the registry business was in steep decline, the Bank is now the owner and operator of New Zealand’s major securities clearing and settlement system.

But perhaps the most substantial changes have been in the supervisory and regulatory functions, which now take a much larger, and a more active, place.  Considerable amounts of regulator discretion are now being exercised, as to policy and the implementation of policy.  The change has accelerated in the last half-dozen years with:

  • The move to Basle II and then Basle III capital models (involving approval of risk models, and the exercise of detailed discretion and judgement on risk weights etc)
  • The introduction of the so-called macro-prudential (time-varying) approach to regulation of banks, including the 2013 residential mortgage LVR “speed limit” and the recent proposal for a ban on high LVR property investor lending in Auckland.  Regional differentiation in the way prudential policy is applied is yet another new step in regulator discretion.
  • The Reserve Bank becoming responsible for the regulation of non-bank deposit-taking institutions
  • The Reserve Bank becoming responsible for insurance supervision.
  • The Reserve Bank becoming responsible for implementing anti-money laundering etc legislation in respect of the financial institutions it regulates, and
  • The Reserve Bank’s bid (not yet successful) for more payment system powers.

It is common ground that there no framework in the Act for defining output-based performance standards for these functions and that for most of them it is simply not possible to do so.  That is not a criticism of the Reserve Bank, or of the roles Parliament has assigned, but simply a description of the difficulty all countries face in these areas.

So the Reserve Bank is now an organisation that, with the acquiescence of ministers and sometimes with the specific mandate of Parliament, has a wide range of functions and powers, but typically has rather ill-defined, and hard to measure, goals[3].   But that means it is very difficult to defend a conception of the Bank in which having a single (unelected) decision-maker provides for clear and decisive point of accountability across these multiple different functions and responsibilities.

[1] Although it has been pointed out that the UK Banking Act makes an effort in this regard.

[2] Section 8 of the Reserve Bank Act still states that monetary policy is the “primary function of the Bank”.

[3] In one or two areas there are memoranda of understanding with the Minister of Finance, but these documents have no legal status, and bind neither subsequent ministers nor subsequent governors.