“Market failure” or failure to let the market work

Brian Fallow has a piece in the Herald today, prompted by the Productivity Commission report,  that champions more active government involvement in the housing market, with barely a hint that anything governments do ever goes wrong.  The words “masterplanned”, when uttered of the activities of government entities, other than tongue in cheek, should send something of a shiver of alarm through the citizenry, rather than a frisson of excitement.  The track record isn’t good.

But what struck me was the claim that the Productivity Commission’s report “is unequivocal about the fact that we are dealing with market failure here”.    Where, I wondered, was the evidence of the market being allowed to work?   One might more accurately sum up the Auckland property market as the most probable outcome of two sets of government policies.  Restrict the supply of land, and at the same time actively take steps to maintain rapid population growth, and what would one expect but high land prices?  One might more accurately call it “policy success”  (predictable outcome of deliberately chosen measures, if anyone had actually done the analysis) than “market failure”.  But surely no politician was ever dumb, or venal, enough to have wished for the sorts of outcomes we’ve seen in Auckland in particular in recent decades?

Which is not to disagree with Fallow’s concluding observation “the status quo is perilously unsatisfactory”.  Well, yes, but instead of proposing providing new compulsory acquisition powers –  not just to elected ministers, as at present, but to unelected, barely accountable, appointees – how about giving the market a chance?  Free up land supply (zone it all residential, as a default) and urban land will quite quickly become affordable again, and arguments about “hold-outs” surely become moot (if any land can be built on).  Oh, and our ancient freedoms are respected as well.

It is a sobering reflection on the growth of the regulatory state that yet more encroachments on peoples’ liberties, with even fewer protections, are proposed in the week in which we mark the 800th anniversary of Magna Carta.

Can resource pressures in 2007 explain NZ’s middling performance since?

I’ve been blogging about what has happened in advanced economies since 2007, with a particular focus on trying to shed a bit of light on New Zealand’s overall performance.

New Zealand’s overall performance has been mediocre at best.  Of course, “mediocre” is better than we’ve done for much of the post-war period, but (a) it isn’t the impression some have had of New Zealand’s recent performance, and (b) there were reasons to think we should have done better.

Our terms of trade have been strong, we didn’t have a serious domestic financial crisis, and we neither hit the zero bound nor were under any great pressure to undertake fiscal consolidation.  Add in a floating exchange rate to the mix, in a world in which fixed exchange rate countries have mostly struggled, and things looked propitious for New Zealand.  On the other hand, the earthquakes required a major diversion of resources away from other activities –  the repair work has been both quite low productivity in nature (which isn’t a criticism, just a description of the nature of many of the repairs) and as a major non-tradables shock it diverted resources from the tradables sector.

One factor people sometimes cite for New Zealand’s no-better-than-middling performance is the initial pressure on resources.  The argument goes that the economy was stretched in, say, 2007, that inevitably growth in subsequent years would be slower.  And there had been a perception –  I contributed to it in one Reserve Bank article –  that New Zealand had experienced more intense pressure on resources than many other advanced countries.

Absolutely, this story can’t account for much.  Average annual growth rates since 2007 have been around 2 percentage points lower than they were in the decade or so previously.  Most output gaps in advanced countries were around 2 to 3 per cent in total.  So, yes, working off the excesses built up in the boom can explain some of the subsequent weaker growth but not much.

But, and more importantly, for my story, based on current international agency estimates New Zealand’s output gap prior to the recession wasn’t large by international standards.  No one agency does output gap estimates for all my sample of advanced countries, and for some of the countries there are no IMF/OECD estimates at all.  Since each agency uses different methodologies, estimates are comparable across countries and across time in an individual agency’s database, but we can’t simply combine the IMF and OECD estimates.  I should also stress the word “current”.  The next two charts are the respective 2015 estimates for output gaps in 2007 –  ie with all the benefit of hindsight, and later vintages of data.

Here are the current IMF estimates for 2007.  All these advanced economies are estimated to have had positive output gaps in 2007 –  even Japan, which is consistent with the views BOJ officials were espousing back then, although not a view widely held in the rest of the West.  The IMF estimates that New Zealand then had an output gap of around 2.4 per cent of GDP, just slightly below the median for this group of countries., and just slightly higher than that for the United States.  I don’t know the details of some of the other countries, but the estimate for Spain does look surprisingly low.

imfoutputgap

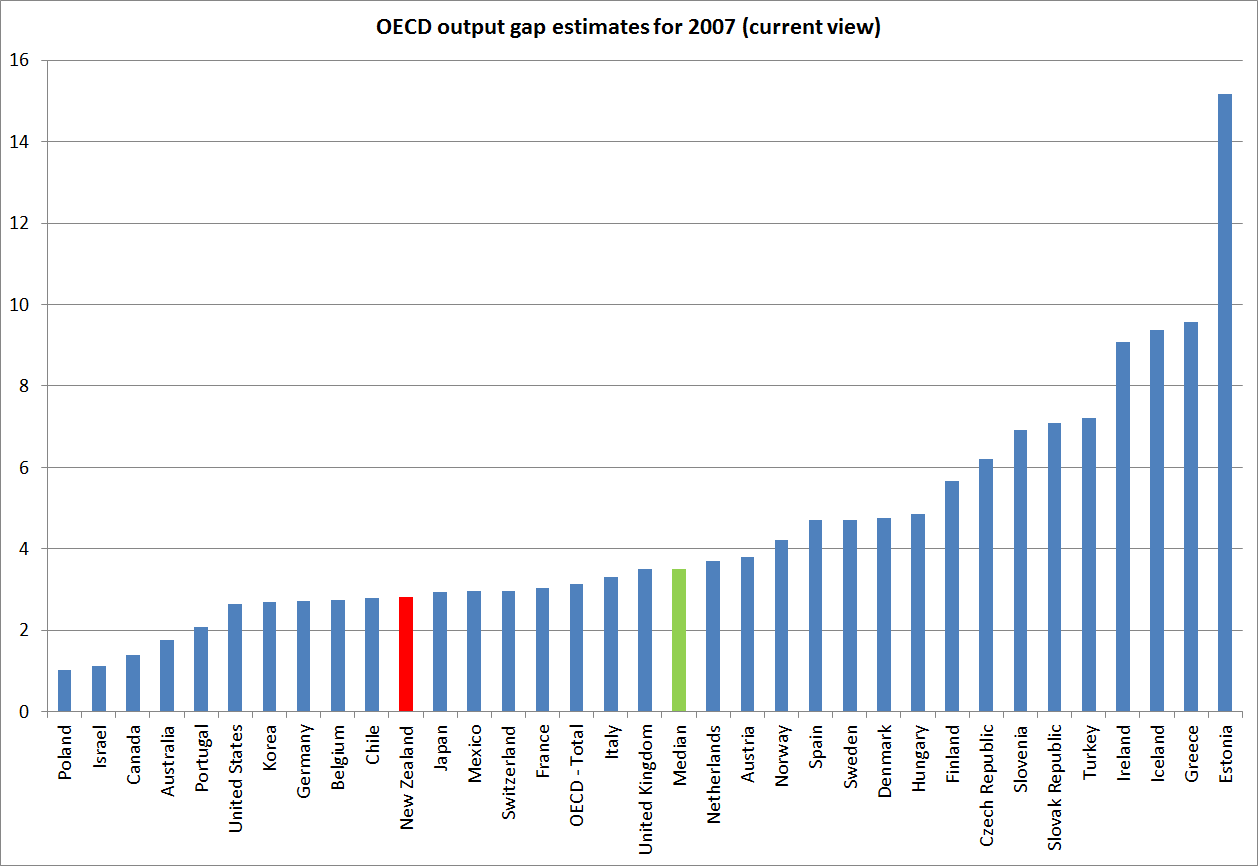
And here are the current OECD estimates for 2007 output gaps.  They estimate that New Zealand had an output gap of around 2.8 per cent of GDP, not that far below the median, but only 10 OECD countries are estimated to have had smaller output gaps than New Zealand just prior to the recession.   The Spanish estimate looks more sensible, and I’m not going to even try to make sense of what a 15 per cent output gap (in Estonia) even means.

oecdoutputgap

So New Zealand is generally regarded as having had a materially positive output gap in 2007, but it was no higher (in fact, a little lower) than those of most other advanced economies for which we have current estimates.  I’ve focused here on 2007, but the story is the same if one looks at 2006 or 2008 or the average of all three years.  Extreme pressures on resources prior to the recession can’t explain our mediocre relative performance since 2007.  Most countries had a little more excess to work off.  If anything, since the agencies current think that New Zealand has little (or no) spare capacity left, unlike most other advanced countries, our relative performance since 2007 might overstate what proves to be sustainable.

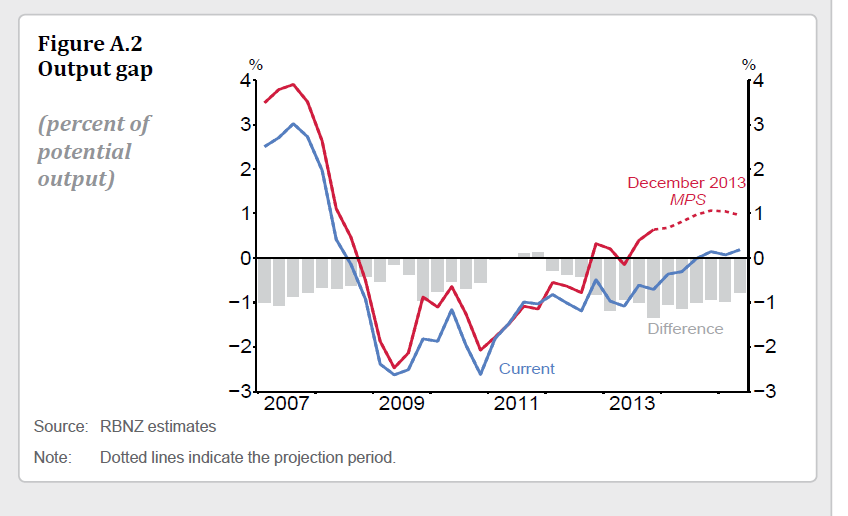
Incidentally, the current IMF and OECD estimates for New Zealand’s 2007 output gap are not so different from the Reserve Bank’s own latest estimates (around 3 per cent), in this chart from last week’s MPS.
mps output gap
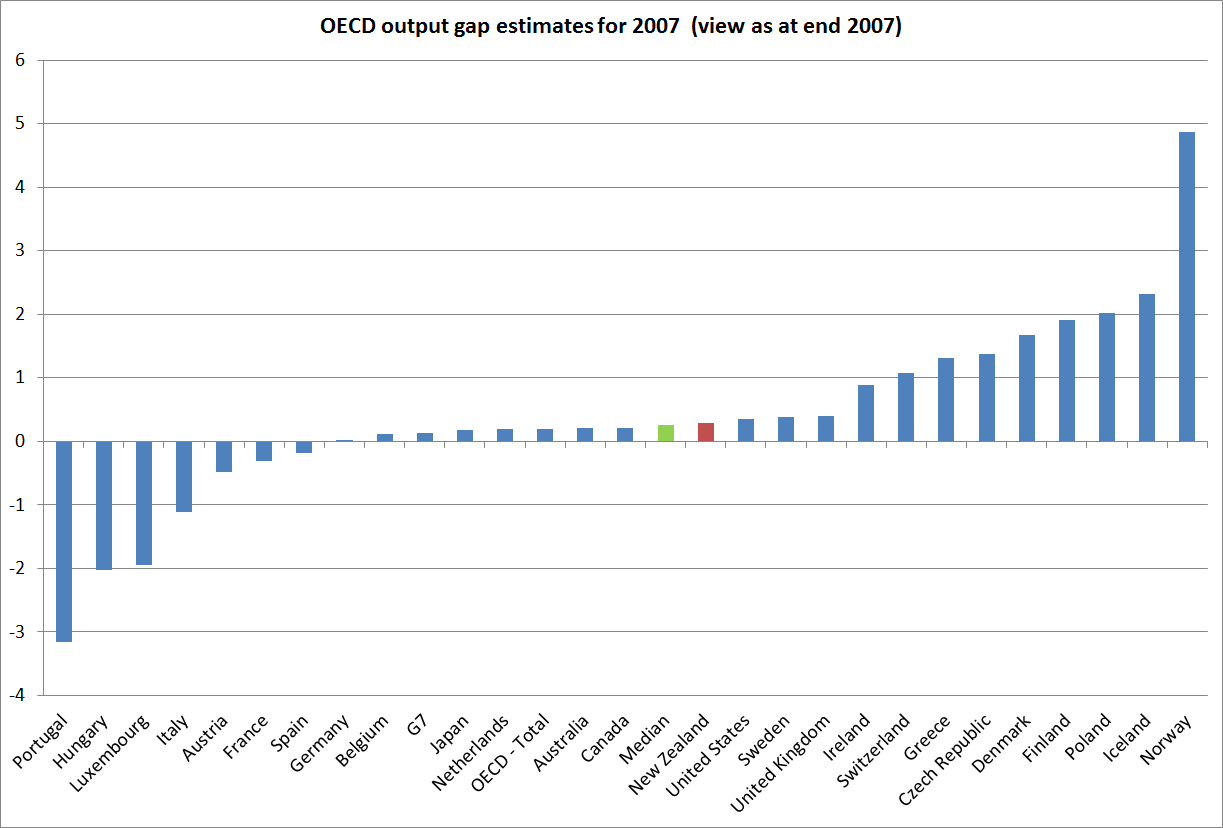
And one last chart, just to show how perceptions, and estimates, change.  This is the chart of the OECD’s output gap estimates for 2007 published in December 2007 –  before there was any widespread sense of a major recession looming. New Zealand was then estimated to be almost the median country, but notice how much lower the estimated output gap estimates all were.  For many countries, including Spain incredibly, the output gaps were estimated to have been negative, and only a handful of countries were estimated to have had positive output gaps much above 1 per cent.  This is not to pick on the OECD –  my impression is that their estimates are no more variable than those of the IMF, or of our own Reserve Bank or Treasury.  But it does make the point that if the output gap is a useful conceptual device, and is a useful summary metric for making sense of history, it is difficult to give it much reliable operational content in conducting policy.  The unemployment rate will often provide a less murky read.

oecdoutputgap2007

Paul Bloxham’s “rock star”

Reading the Herald over lunch, I found a piece by Paul Bloxham (of HSBC), author of the original “rock star economy” description, defending his image.  The sub-editors headed it “NZ’s economy still moves like Jagger”.

Personally, I am enough of an old fogey that “rock star” summons up unwelcome images of dissipation, licence, and worse.  I’ll take Bach or Handel any day.  But, anyway, Bloxham insists that New Zealand is some sort of “Nirvana” (apparently a rock group, that ended badly –  and, yes, I did have to look it up).    I’m not sure where lingering high unemployment fits into his story, or weak growth in productivity or per capita income.  Yes, there are many places worse off than New Zealand, but as I’ve been illustrating over the last couple of weeks many have been doing better.

Bloxham seems to focus on growth in total GDP, and certainly many OECD countries have much weaker growth than New Zealand has had.  But they also typically have very low population growth.  Our population growth is normally faster than that in the rest of the OECD, and has accelerated rapidly in the last year or so. On the latest SNZ estimates, our population is up 1.8 per cent on last March.  That might be good or might not –  perhaps less good if a lot of it just reflects New Zealanders not going to Australia because unemployment is also high in Australia.  Per capita real GDP growth just has not been that strong, and per capita income growth looks likely to slow even further as the terms of trade fall.

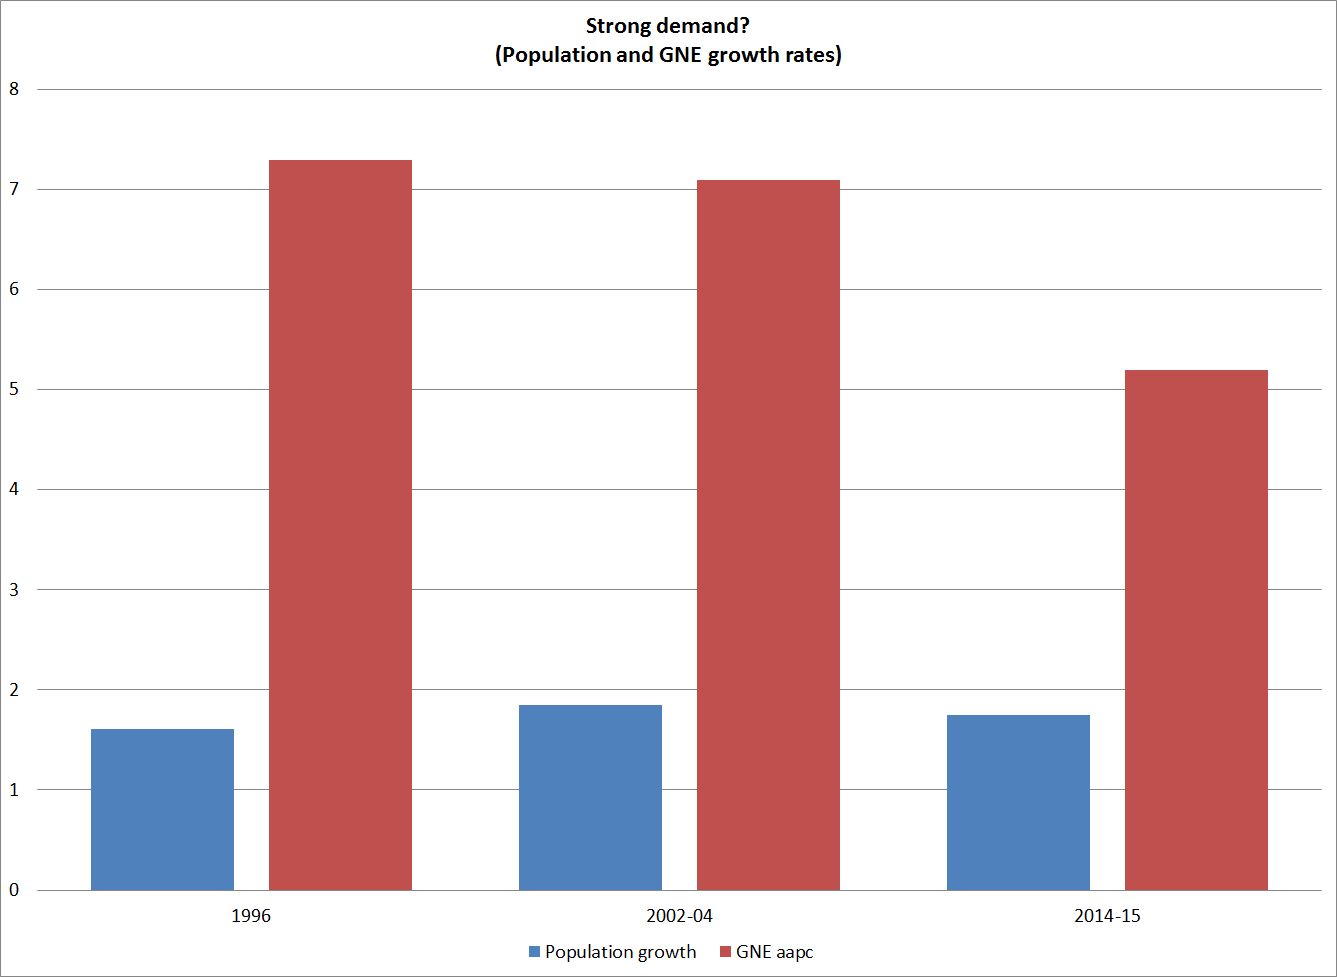
Bloxham is also convinced that demand is strong.  But rapid population growth tends to lead to rapid demand growth –  more people need accommodation, cars, other durables, and just the regular stuff of life (food, clothing etc).  SNZ’s quarterly population series only goes back to 1991.  But in the period since then there have been three episodes when annual population growth got up to at least 1.6 per cent –  in 1996, over 2002-2004, and the last couple of quarters.  Population growth rates and growth in domestic demand are quite strongly correlated. Here is how domestic demand growth (GNE) has been in each of those episodes (I’ve used aapcs for GNE, but the fall-off in the noisier apcs is even sharper).   Domestic demand growth has been much weaker over the last year than in the previous high population growth episodes, even though this time we have a large exogenous boost to demand resulting from the Canterbury earthquake rebuild.

nirvana

As I noted on Saturday, it is not that demand has been so strong, and supply has grown even faster to meet it. It is more case of rapid population growth, and some additional domestic labour supply growth (similar to that in other OECD countries), being accompanied by unusually weak growth in domestic demand.

The Productivity Commission on land supply

The Productivity Commission yesterday published its draft report on improving the supply of land for housing.  It builds from earlier work by the Commission and others identifying supply restrictions as one of the most important explanations for the high price of houses (more strictly, house+land) in New Zealand.

There looks to be a lot of fascinating material.  Being history-minded, the first thing I read was the fascinating little research note on the history of town planning in New Zealand.  Modern documents that quote from 1839 New Zealand newspapers appeal to me, even if the author of that research note seems more taken with the “need” for “town planning” than I would be.  And was the New Zealand Company really much involved in the founding,settlement and planning of Christchurch?  The books on my shelves don’t suggest so.

I also read the Summary Version of the report.  It is a summary, and while it lists the findings and recommendations and outlines the arguments,  there is a no doubt a lot more in the remaining hundreds of pages.  Some answers to my points below may lie in those pages, and I hope to look at them in more depth in coming weeks.

Land supply issues matter a lot.  That was one of the points the 2025 Taskforce stressed back in 2009.  It is a shame that the Commission does not pick-up the Taskforce’s recommendation that Councils be required to develop and publish indicators of the prices of otherwise similar land that is, and is not, zoned for residential development.  Information and data are a key input to any analysis, and even when the current public and official focus on these issues fades, it will be important to maintain the flow of data.

But what of the Commission’s own ideas and analysis?  Here is a list of thoughts/observations/concerns, in no particular order:

  • It is good to see the Commission come out in favour of land-value rating, reversing the trend in recent decades towards capital value rating.  Land value rating tends to focus the minds of owners of the scarce resource, land.  There are other ways to tackle “land banking” (ie don’t allow regulation to make new urban land scarce in the first place), but land value rating would be a step in the right direction.
  • As would, on a much smaller scale, levying local authority rates on Crown land.
  • But, as with many Commission reports, there seems to be a too-ready sense that government is the source of on-going solutions, rather than the source of the underlying problems.  In other words, the report doesn’t mainly focus on getting government (central and local) out of the way, but on finding smarter or better ways of the government being actively involved (eg “this means a greater degree of publicly-led development”).  Perhaps it shouldn’t be too surprising  –  after all, two of the three commissioners are former heads of government departments, and the Commission works on projects requested by government, in a process where ministers are advised by government departments –  but it is something to watch out for.  I had a similar reaction to the Commission’s recent draft social services report.
  • The report does not seem to grapple at all with the indications from historical cross-country experience that as cities grow richer they tend to become less dense, not more dense.  It also does not engage with the Demographia data suggesting that Auckland is already a relatively dense city by advanced New World standards.  I’m not at all suggesting that regulation should impede denser development, but some of the Commission’s lines of arguments become less persuasive if greater density is unlikely to be the main preferred market response to ongoing population pressures.
  • For example, the Commission focuses on the idea that local authorities do a poor job in this area because of the excessive weight of existing homeowners, concerned about the losses of price and amenity value on their houses.  That sounds plausible if we think about establishing high rise apartment through Epsom, but it is far less clear that existing home owners have any strong objection to greater ongoing development on the periphery of cities, where historically most new building has happened.     After all, existing home owners have children who will be looking for housing before too long –  but again the intergenerational perspective seems to be lacking in some of the Commission’s work.
  • The Commission does not seem to give much weight to the idea that restrictions on development at the periphery may have as much to do with the biases, preferences  and ideologies of Council staff.  Perhaps there is nothing to that suggestion, but I wonder how many Council staff come to work each morning dedicated to facilitating citizens doing as they like with their own property, rather than shaping and imposing a vision on “their” city.  I read the Wellington City Council’s recent draft long-term plan, and it confirmed my worries.
  • The Commission proposed removing “District Plan balcony/private open space requirements for apartments”, which sounds sensible.  But what about site coverage ratio restrictions?
  • I reckon the Commission oversells the gains to be had from improving land supply.  I’m reluctant to say that because I think the gains that are on offer –  much lower house prices –  are substantial and important, especially for the younger and poorer sections of the urban population.  But I’d say it is “case unproven” when it comes to gains in real GDP, or real GDP per capita.  The Commission cites recent work by Hsieh and Moretti, which suggests that releasing adequate land could lift GDP per capita in the US by as much as 9.5 per cent.  Perhaps it is true, and perhaps it is true of Auckland.  But New Zealand is already a highly urbanised country, Auckland already makes up a large share of the total population, and Auckland has had faster population growth than almost any other largest city in an OECD country in the decades since World War Two.
  • Related to this, the Commission seems to be too ready to embrace agglomerationist arguments.  Yes, it is true that cities tend to have higher levels of productivity than smaller centres, but that does not mean that policy designed to drive the growth of big cities will, of itself, lift productivity.  Yes, policy should avoiding impeding the distribution of population within the country to its most productive locations, but not go beyond that.  In fairness, many of the Commission’s specific recommendations are about removing roadblocks, but the supporting text often seems to go beyond that.
  • For example, there is the unsupported proposition that “Councils and their elected representatives also need to lead in persuading their communities of the benefits of growth. These are difficult conversations.  Facilitating growth requires communities to change, and change is hard.  Some people will lose from that change.  But the community as a whole, and New Zealand, will benefit from it”    Setting aside the condescending tone, where is the evidence that population growth is a “good thing” –  because population growth is the issue here?  Again, if we are going to have fast population growth, we need to find ways to absorb it, without causing scandals like, for example, current Auckland house prices.  But a reasonable voter (or elected representative) might reasonably ask “haven’t we had rapid population growth for 70 years, and some of the poorest  growth in productivity/GDP per capita of any advanced country?
  • The Commission proposes providing powers of compulsory land acquisition for housing purposes.  At one level, the claim that “compulsory acquisition of property by the state can be justified if it is in the public interest” is circular.  What is “the public interest”?  The public interest might, for example, involve the protection of private property rights, including the right to hold property undisturbed.  This is another example of the Commission’s apparent reluctance to grapple with pervasive government failure and abuse of regulatory powers.  The abuses of eminent domain powers in the United States should be a salutary warning here.  The Commission goes on to argue that “given the significant social and economic harm caused by the current housing situation, a good case exists for compulsory acquisition powers to assist in the assembly of sites for large masterplanned developments.”    As if to water down the rather shocking nature of this proposal, the report suggests that powers don’t need to be exercised much, as they can provide leverage (in the same way a mugger with a baseball bat won’t need to hit me to get my money) and the chair is also quoted as suggesting the powers might only be to deal with “holdouts”.     But it just is not clear why such powers should be given to public agencies.  In a well-functioning economy, housing is readily provided by the private sector.  Public agencies and political leaders got us into this mess, and why would we expect that new powers would not be abused?   Have powers of compulsion worked well in central Christchurch?  It hadn’t been my impression.
  • The Commission does not seem (I may have missed it) to touch on a more radical option.  Why not, for example, explore a proposal that would allow any land to have houses built on it, by right perhaps up to three storeys high?  One might make exceptions for geologically unstable land, but shouldn’t the presumption be shifted back in favour of the private land owner?    With something like that sort of model, combined with land value rating, it is difficult to envisage that peripheral urban land prices would be very high for very long.    Yes, I know this proposal does not deal with all the transport  and infrastructure issues, and many of the Commission’s suggestions on these issues appear sensible.

Keen as I am to see a more responsive supply of urban land, I came away from the report with a question.  Supply and planning restrictions have become an increasing obstacle to affordable urban house prices in many advanced countries in recent decades.  There are individual areas that have held out – Houston is among the best known – but are there any cases where there has been a move back from heavily planned and regulated urban land markets to much more liberalised ones?  I’m not aware of any, but my detailed knowledge in this area is pretty limited.  My prior is to be a bit sceptical about how likely it is that far-reaching changes to the planning regimes, of the sort that would materially reverse the growth in real urban land prices, could be made, and then made to last.  If the Commission is aware of examples of successful substantial durable reforms it might be helpful to include them in the final report.  A low prospect of success is not a reason for not doing the analysis and continuing to make the case, but there is a question as to where political capital might best be devoted.

Which brings me to my final point.  The Commission has to take population growth as given, since it was asked by ministers to look at land supply issues.  But it is too often forgotten that most of our population growth in recent decades, and all of it now, arises directly from active government policy.

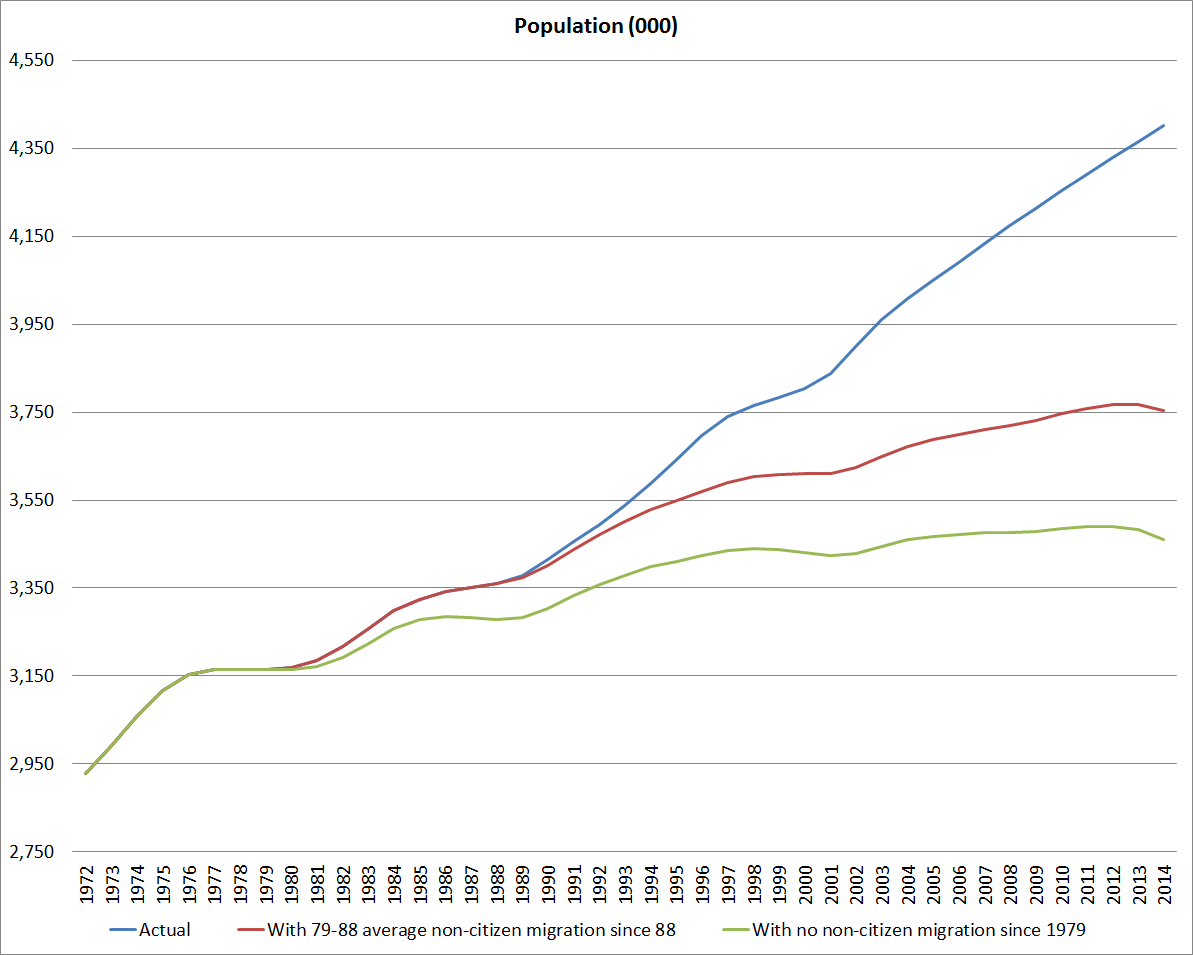
The chart below shows New Zealand’s actual population, and what it might have been under two different immigration scenarios.  Immigration policy only affects the movement of non-New Zealand citizens, and so what I’ve shown here is what population would have looked like if there had been no net non-NZ citizen immigration, and if net non-NZ citizen immigration had been kept at the sort of levels seen in the 1980s.  They aren’t precise estimates by any means –  it is possible, for example, that if there had been less non-New Zealand citizen immigration, there might have been somewhat less New Zealand citizen emigration.  But it is just designed to make the point that population pressures on the housing market are not any longer about the choices of New Zealanders (to have children or not, to stay or to migrate) but about active government policy.   With 1980s levels of non-citizen immigration, the total population would now be flat or falling slightly.   The only aspect of the non-citizen migration that is unrestricted is the (modest) flow of Australian citizens: all other arrivals require explicit government approval, and a planned policy of high net inward migration of non-citizens.

population scenarios

If we are worried about house prices –  and I certainly think we should be  –  a strategy with a higher probability of durable success might be to combine land supply liberalisation with some reduction in the targeted level of inward migration (bearing in mind that our government’s target for inward migration of non-citizens is itself very high by international standards).  There would still be considerable cycles in net immigration flows (as the net outflow to Australia waxes and wanes with the economic cycles), but the trend is the issue for longer-term affordability concerns.

And to hark back to the discussion on why New Zealand interest rates have been so persistently high, if lack of sufficient agglomeration and scale were really the big issue in New Zealand, we should tend to see low interest rates, and a low exchange rate, not the reverse.

Labour market since 2007

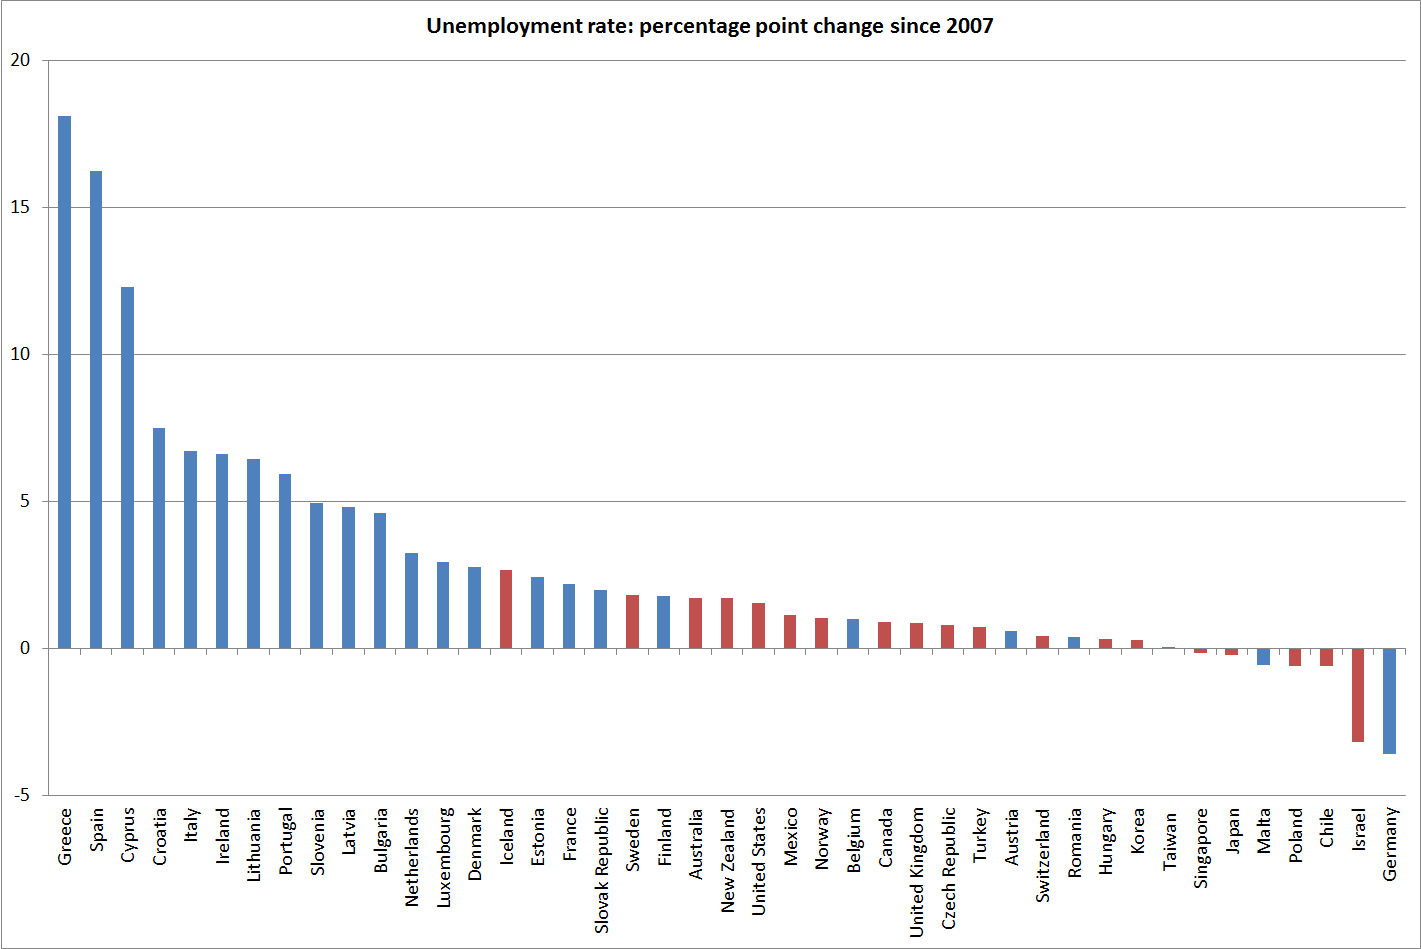
One other dimension of economic performance since 2007 is the labour market.  Using the IMF WEO database, which reports only annual data, here are the changes in advanced country  unemployment rates from 2007 to 2014.

U0714

New Zealand is almost the median country on this measure.  The unemployment rate was 1.7 percentage points  higher in 2014 than in 2007, almost identical to the increase in Australia, and slightly worse than for the US (of course, the US unemployment rate rose far higher and has subsequently fallen more rapidly).  On this chart, I’ve coloured red the countries with floating or flexible exchange rates.  It is pretty starkly obvious how the worst increases in the unemployment rates are concentrated in the euro-area countries, which have had no domestic policy flexibility.  On the other hand, once the fixed exchange rate regimes are allowed for, it is uncomfortably apparent that of the flexible exchange rate countries New Zealand has had the third largest (really second-equal) increase in its unemployment rate.  (And yet, for some reason, we were the advanced economy whose central bank was raising its policy rate.)

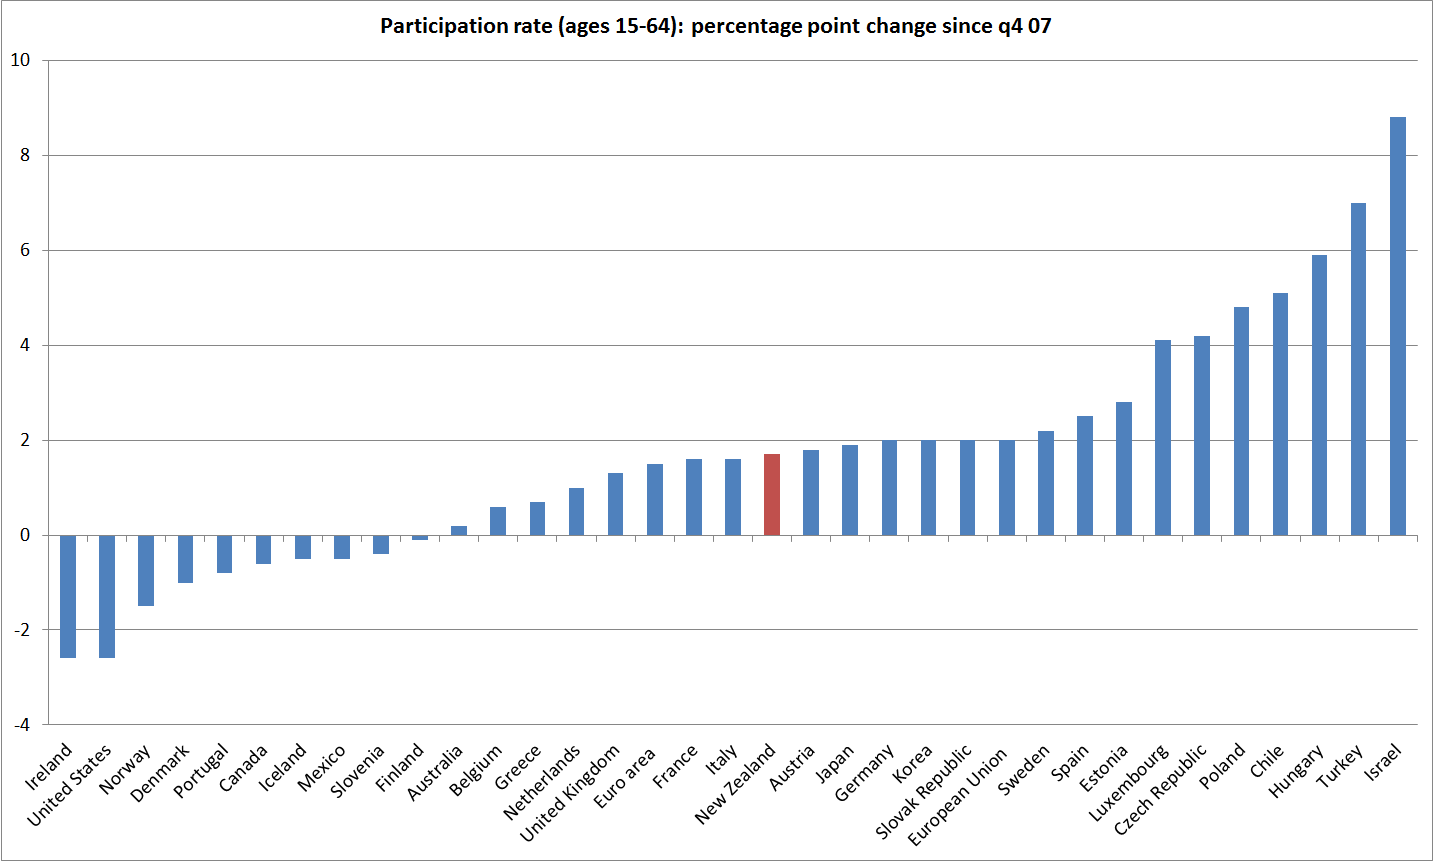
There has been a tendency in some circles to downplay the continuing high unemployment in New Zealand, by noting that participation rates have been increasing.  But here are the participation rate changes since 2007, this time just for OECD countries (I couldn’t quickly see comparable data on Eurostat).

participation

It is certainly true that participation rates have been rising in New Zealand, but not to any greater extent than in other OECD countries.  Again, New Zealand is about the median country in this group, and the increase here is just slightly more than in the euro-area as a whole, and just slightly less than in the EU as a whole.  Rising participation rates in most countries, at a time when unemployment rates are still above pre-recession  levels in most countries is an interesting phenomenon  – and somewhat unexpected given that participation rates typically tend to fall when unemployment is rising and rise when it is falling (thus the weak Irish participation rate is little real surprise).  The countries that struck me most forcibly were Greece and Spain, which have had huge increases in their unemployment rates and yet have seen labour force participation rates increasing.  Without anything more concrete to go on abouto what has happened in these two countries, I can only assume it is something around things being so tough that absolutely everyone is having to look for any work they can get, even if the probability of finding it is quite small.

Overall, then, the labour market remains another area of disappointing economic performance for New Zealand,  It is, of course, one that is more readily amenable to the ministrations of macroeconomic policy.  Easier monetary policy over recent years –  which there was demonstrably room for, given core inflation outcomes relative to the midpoint of the target range –  would have helped reabsorb the people who are unemployed more quickly than is currently in prospect.

Of course, one counter-argument to this line of argument is that the New Zealand labour market was unusually overheated in 2007.  Perhaps, but as we’ll see tomorrow there is nothing in international agency estimates to suggest that New Zealand’s economy was more stretched than most other advanced countries were just prior to the recession.

Macro policy flexibility since 2007

I’ve been looking at how advanced economies have performed since 2007.  New Zealand has not done that well, contrary to some of the stories one sees around (eg the somewhat incredible “rockstar economy” phraseology that held sway for a while).

It surprised me that New Zealand had not done a little better since 2007.  As I noted last week, we have had some of the strongest terms of trade of any OECD country.  But we also had other advantages.  For example, we did not have a substantial domestic financial crisis.   No major financial institution failed, and although many finance companies failed they were fairly peripheral.  Overall loan losses appear to have been relatively modest, and any disruption to the financial intermediation process –  of the sort often discussed in the literature around the economic costs of financial crises – must have been slight at best.  That New Zealand and the United States have had such similar paths of GDP in the last decade has left more sceptical than I was of the proposition that financial crises have large sustained real economic costs.

New Zealand also had more macroeconomic policy leeway than most countries.  Macroeconomic policy tools –  fiscal and monetary policy –  don’t make much difference to a country’s long-term prosperity, but they can make quite a difference to a country’s ability to rebound quickly from shocks.  Thus, for example, almost half the advanced countries I’ve been looking at are now members of the euro area.    Individual countries have no national monetary policy (so they can’t adjust their own interest rates or their nominal exchange rates) and the region as a whole has been at or near the lower bound on nominal interest rates for years now.  Many other advanced economies –  the US, UK, Japan, Switzerland, Sweden, the Czech Republic –  are also at the lower bound for nominal interest rate.  In all cases except Japan, they were able to cut policy rates a long way when the recession hit, but then they ran into limits.

New Zealand did not run into such limits.  In 2008/09 the Reserve Bank cut its policy rate, the OCR, by more than almost any of the other advanced country central banks.  But even then the rate was still 2.5 per cent.  There was plenty more leeway had that been judged warranted.  And during the recession itself, our floating exchange rate fell very substantially..

But the other area of macroeconomic policy where we had leeway was fiscal policy.  Intense debates rage around the role of fiscal policy in economic cycles.  When a country is not at the zero bound it seems reasonable that the stance of fiscal policy won’t make much difference to the path of GDP  (although it may affect the composition, and in particular that between tradables and non-tradables).  But it is likely to be a different matter for a country at the zero bound.  If there is little or no effective monetary policy leeway, changes in the fiscal balances are likely to have reasonably predictable “Keynesian” type effects: fiscal contractions will dampen recoveries, and fiscal expansions will support them.  Of course, confidence effects can undermine those effects, but in reasonably well-governed countries with floating exchange rates, it takes a lot to lead to material adverse confidence effects.  There is no evidence, for example, that the UK or the US came close to triggering serious adverse confidence effects during the years since 2007.

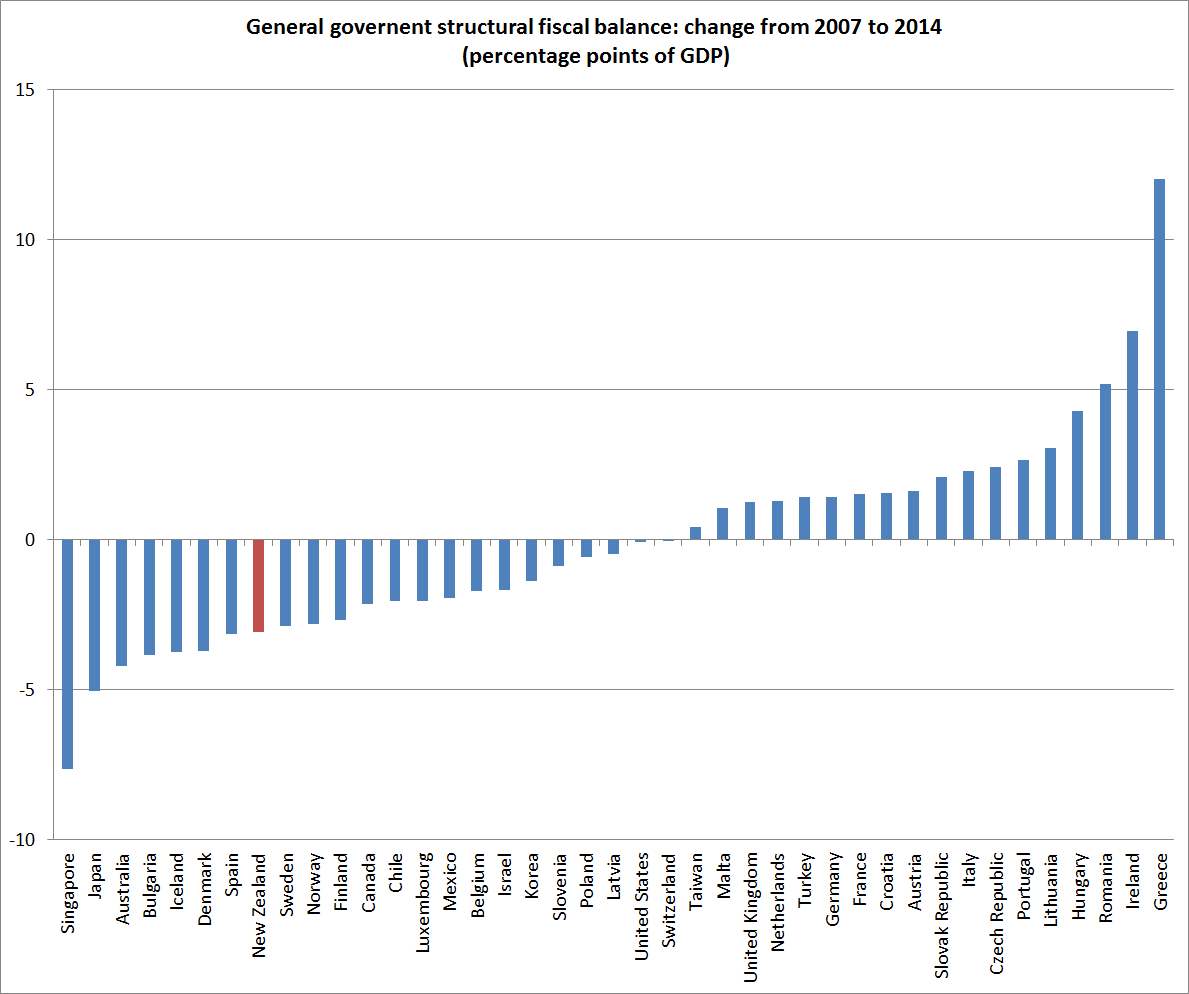
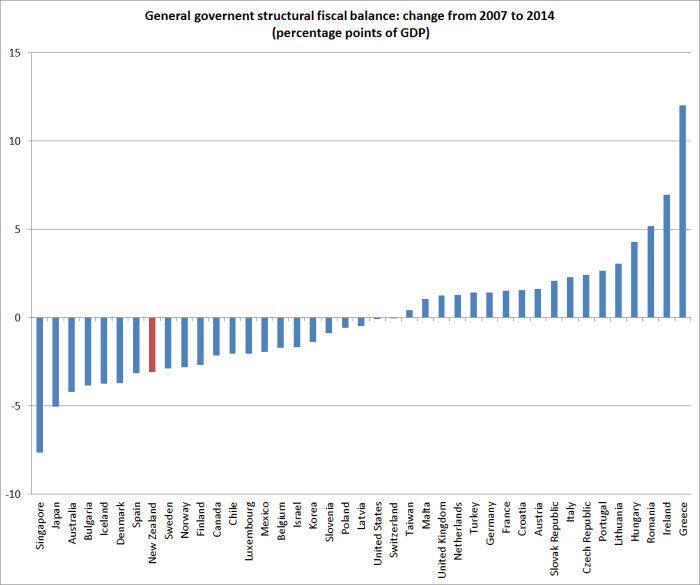
Turning to the IMF WEO database again, we can see what has happened to (estimates of) structural fiscal balances since 2007.  I would stress the word “estimates” –  no one can ever know the level of a structural fiscal balance with certainty, and current estimates for 2014 will be revised, in some cases perhaps quite substantially.  But here is how structural fiscal balances have changed since 2007.
fiscalbalances

Around half the countries have had fiscal contractions over that full period, while the other half have had expansionary fiscal stances.    Over the period as a whole, only seven countries are estimated to have had more expansionary fiscal stances than New Zealand.  What I found interesting is that of the 15 countries to the left of the chart, 10 had floating (or flexible in Singapore’s case) exchange rates.  Of the countries that have had contractionary fiscal stances, only a handful have flexible exchange rates.

Like most countries, New Zealand’s picture is one of two halves.  There was a huge shift from substantial structural surpluses as recently as 2007 ( when only Singapore had a materially larger structural surplus than New Zealand) , to large structural deficits just a couple of years later.   When I did one of these charts back in 2010, New Zealand had then had (depending on the measure used) either the largest or second largest expansionary shift in fiscal policy of any advanced economy.  The odd thing about New Zealand’s shift was that almost none of it was fiscal stimulus measures initiated once the recession hit –  it was all the effects of decisions made when it was thought (by politicians and their Treasury advisers) that times would stay good.

Since 2009 New Zealand, like many other countries, has been gradually reducing its structural fiscal deficit.  My point here is simply that we had the flexibility to do so, fast or slow, without materially affecting the economic cycle, because we never ran out of room to use conventional monetary policy to offset the short-term demand effects of fiscal consolidation decisions.  Having, on average, the highest real interest rates in the advanced world isn’t a good thing for our longer-term growth prospects (I argue) but in getting through the last few years it has had one distinct upside –  we had more room to cut rates than almost anyone else.  Given our disappointing economic performance, and weak inflation outcomes, one might argue that it is a shame that that leeway was not used more aggressively.

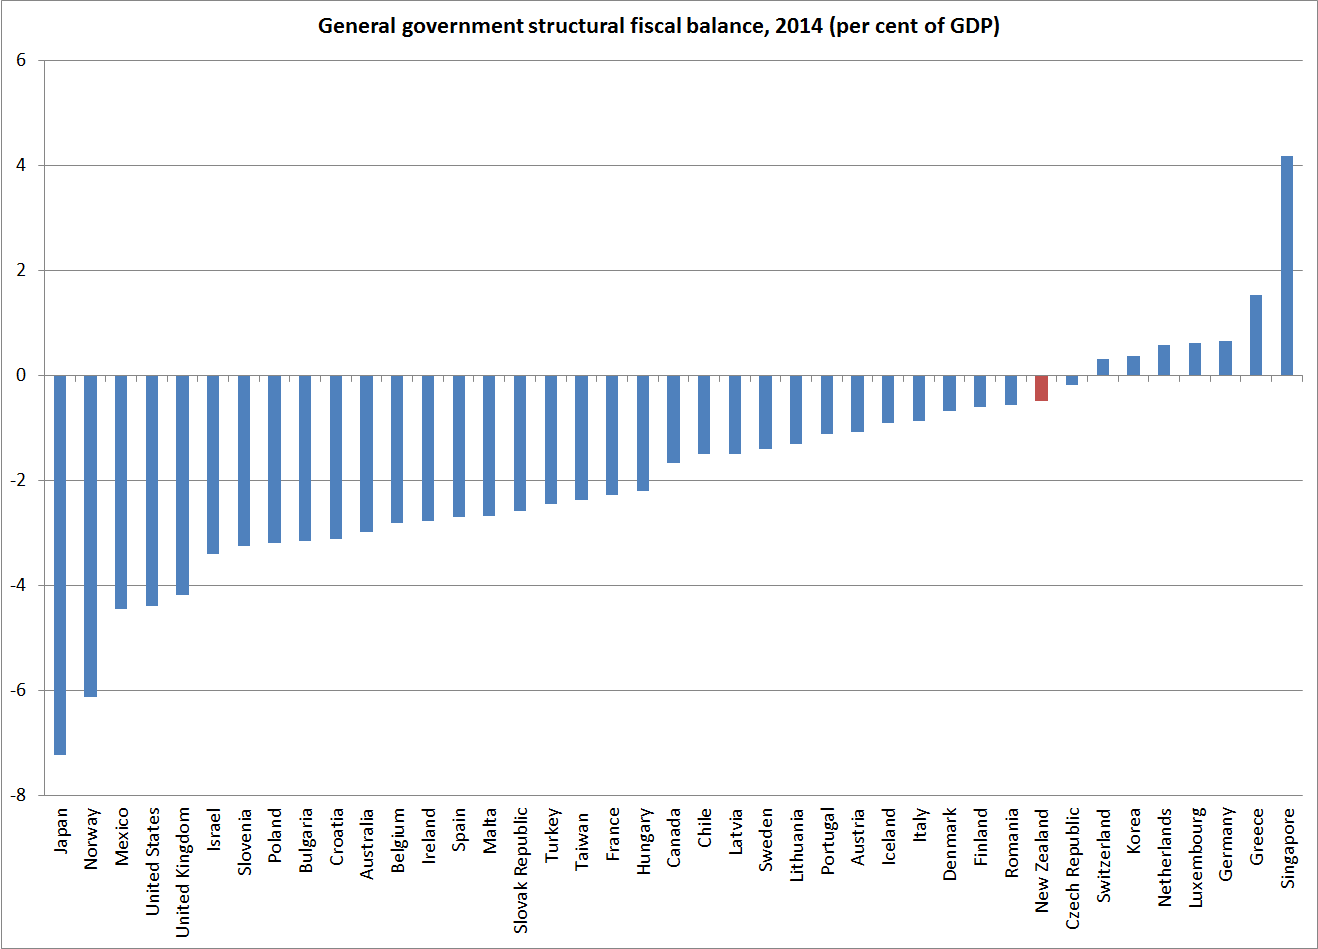
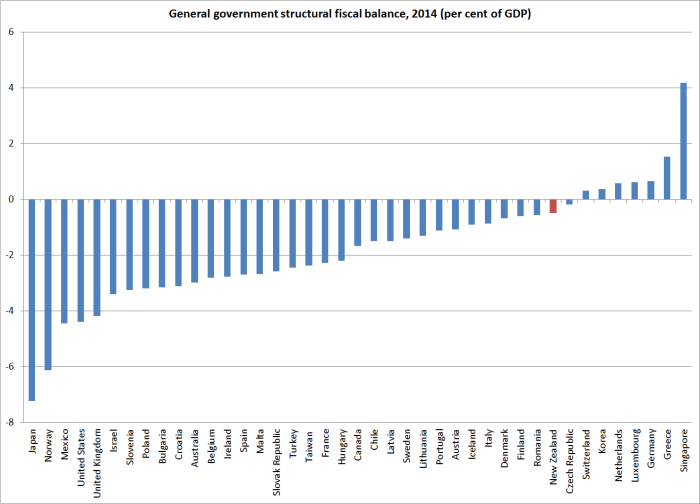
And finally, a chart of the IMF’s estimate of the level of each country’s structural fiscal balance in 2014.  New Zealand looks pretty good on this score (although the terms of trade flatter our numbers somewhat).
fiscal2014
Perhaps the saddest bars on both charts are those for Greece.  Running structural fiscal surpluses, in an economy at the zero bound and with 27 per cent unemployment, would not normally be considered sensible.  But that is what happens when a country loses market access, and yet lingers on in a straitjacket like the euro.  I stand by my assertion a month or two ago that there is no politically acceptable deal (politically acceptable in both other countries and in Greece) that can allow Greece to stay in the euro and yet begin to make material ground reversing the catastrophic loss of output and the appalling unemployment rate.  It increasingly looks as though the break is coming soon.  When and if it does, it will be messy for a time, but it finally offers a way back towards a more fully-employed economy.

“Larry Summers on TPP makes perfect sense”?

Tyler Cowen wrote last night “Larry Summers on TPP makes perfect sense.  I haven’t seen anything on the anti- side coming close to this level of analysis, and in a short column at that.”

I’ve been a bit ambivalent about TPP, so thought that I’d better read the Summers piece.  My problem was that I came away more skeptical than I went in.

My own priors are pretty clear.  Free trade is good –  as a matter of liberty and as a means to greater prosperity.  I’m sure one can find exceptions, but the rule is a pretty good one to live, and make policy, by.

But then Summers tells us that:

First, the era of agreements that achieve freer trade in the classic sense is essentially over. The world’s remaining tariff and quota barriers are small and, where present, less reflections of the triumph of protectionist interests and more a result of deep cultural values such as the Japanese attachment to rice farming. What we call trade agreements are in fact agreements on the protection of investments and the achievement of regulatory harmonization and establishment of standards in areas such as intellectual property. There may well be substantial gains to be had from such agreements, but this needs to be considered on the merits area by area. A reflexive presumption in favor of free trade should not be used to justify further agreements. Concerns that trade agreements may be a means to circumvent traditional procedures for taking up issues ranging from immigration to financial regulation must be taken seriously.

But if free trade is good, the same case can’t be made for “regulatory harmonisation”.  We just don’t know enough about what regulation is sensible, and worthwhile, and we live in democracies where the case for regulation in specific areas should be fought out through domestic political processes.    A diversity of regulatory approaches is often the way we learn.     And protections for intellectual property are typically far too high anyway –  in other words, agreements on such matters risk being (or are by design) generally anti-competitive, anti-market, measures.

In fact, the strongest argument for TPP I could find in the article was one grounded in domestic US politics ( recalling that Summers had been a senior official in both the current and previous Democratic administrations).

The repudiation of the TPP would neuter the U.S. presidency for the next 19 months. It would reinforce global concerns that the vicissitudes of domestic politics are increasingly rendering the United States a less reliable ally.

Really?    We all know that second-term US Presidents, especially those whose Vice-President is not heir presumptive, quite quickly become lame ducks.  Is this presidency really any different?  And where is the pressing demand for TPP?  No doubt there are elites in each of the negotiating countries with a great deal at stake, but where is the popular demand for this agreement?  As Summers puts it, it doesn’t seem to be a free trade agreement anyway.  Which population centre will think worse of the US if negotiations stall?    No doubt some US business groups will be aggrieved, but that is domestic politics, not international relations.  Failure of TPP would be embarrassing for Barack Obama, but that seems less like a national interest issue than a partisan one?

I’ve long been a bit puzzled by what was supposed to be in any deal that would make it economically worthwhile for New Zealand (as distinct from being “inside the club”).  I recall the IMF doing some modelling a decade or more ago on the US-Australia FTA, which had concluded that that agreement had been modestly welfare-diminishing for Australia –  as if a desire for a deal, any deal, and perhaps the momentum that any  process takes on over time had overridden a hard-headed assessment of the economic interests of Australia.   If there were genuine large-scale liberalisation of the global dairy trade, then we might reasonably think New Zealand would be better off from a deal.  But has that ever seemed very likely?  And if only small (or no) trade gains are on offer, how should we weigh that against the losses from strengthened intellectual  property protections?

And how should be think about the incentives on our key political participants?  Having pursued an agreement for so long, what sort of threshold would have to be crossed before they would be willing to walk away from negotiations?  It is not clear that the personal and national interests are necessarily tightly aligned.  Perhaps the US Congress will  vote in ways that mean they never have to make that decision.

To repeat, I’m a free trader.  I think New Zealand should have removed its remaining tariffs, and wound back its anti-dumping regime, long ago.  I’m in favour of a materially more liberal approach to foreign investment.  And I generally favour less regulation rather than more.  But all these are causes that should be fought out openly, and in the domestic political process.    So, I hope there is a better case for TPP than that put forward by Larry Summers, who actually seems somewhat ambivalent if it weren’t for the impact on Obama’s political position, but so far I haven’t found it.

And that before I saw Keith Woodford’s recent column on interest.co.nz.  Woodford knows a great deal about the global dairy industry, and he makes what seem like pretty persuasive arguments that there might not be much in it for New Zealand even if the US and Canada were to move towards an unsubsidised and less heavily regulated dairy industry.

Savings and investment since 2007

Last week, I started showing a few charts about how New Zealand had done against various other advanced economies since 2007, the last year before the recession that engulfed most of the world in 2008/09.

Today I’m going to show the charts for investment and national savings, using the data from the IMF’s WEO database.

First investment.

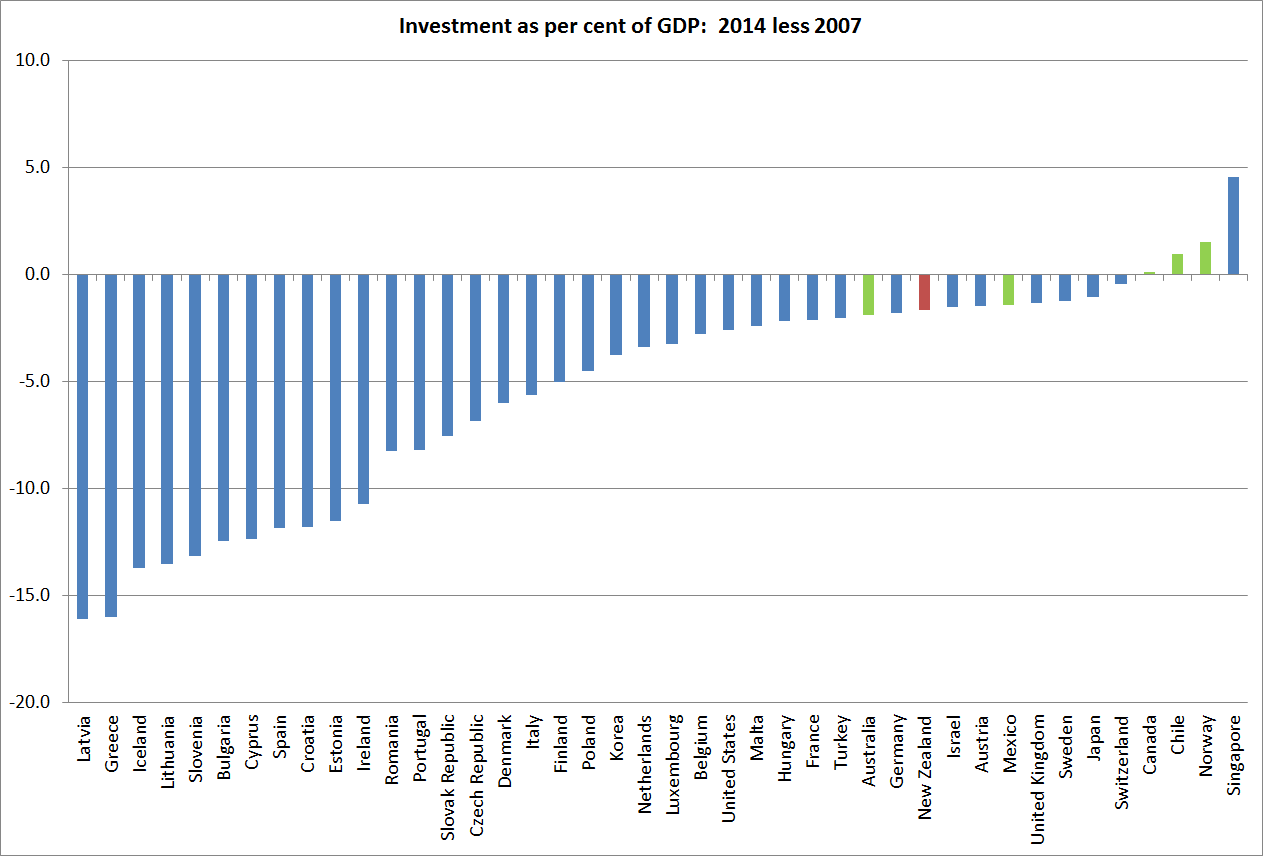
investment2014

Of this group of advanced countries, only four had a share of investment in GDP higher in 2014 than it was in 2007.  That probably doesn’t come as a great surprise.  2007 was a cyclical peak, and by last year hardly any of these countries would have been considered to have been operating at capacity.  Across the advanced world as a whole, population growth rates are falling, and lower rates of population growth mean less of GDP needs to be devoted to investment for any given level of technology.

But my main interest was the cross-country dimension.  Perhaps unsurprisingly, the commodity exporting advanced economies have all been among the countries with the most strength in investment.  But Germany comes between Australia and New Zealand, and I was surprised to find the United Kingdom, Japan, and Sweden doing better than either New Zealand or Australia.  At the other end of the chart, the 18 weakest economies all either use the euro, or have a currency pegged to the euro.

The New Zealand story itself is a little less favourable than it might first appear. Recall that I noted last week that there had been no sign of a surge in New Zealand business investment in response to the high terms of trade.  And, on the other hand, a significant amount of the strength in New Zealand’s investment in the last few years has been the repair and rebuilid activity in Canterbury.  It counts as gross investment but, since it is mostly replacing capacity that was destroyed or severely damaged, it isn’t adding much to the capital stock.

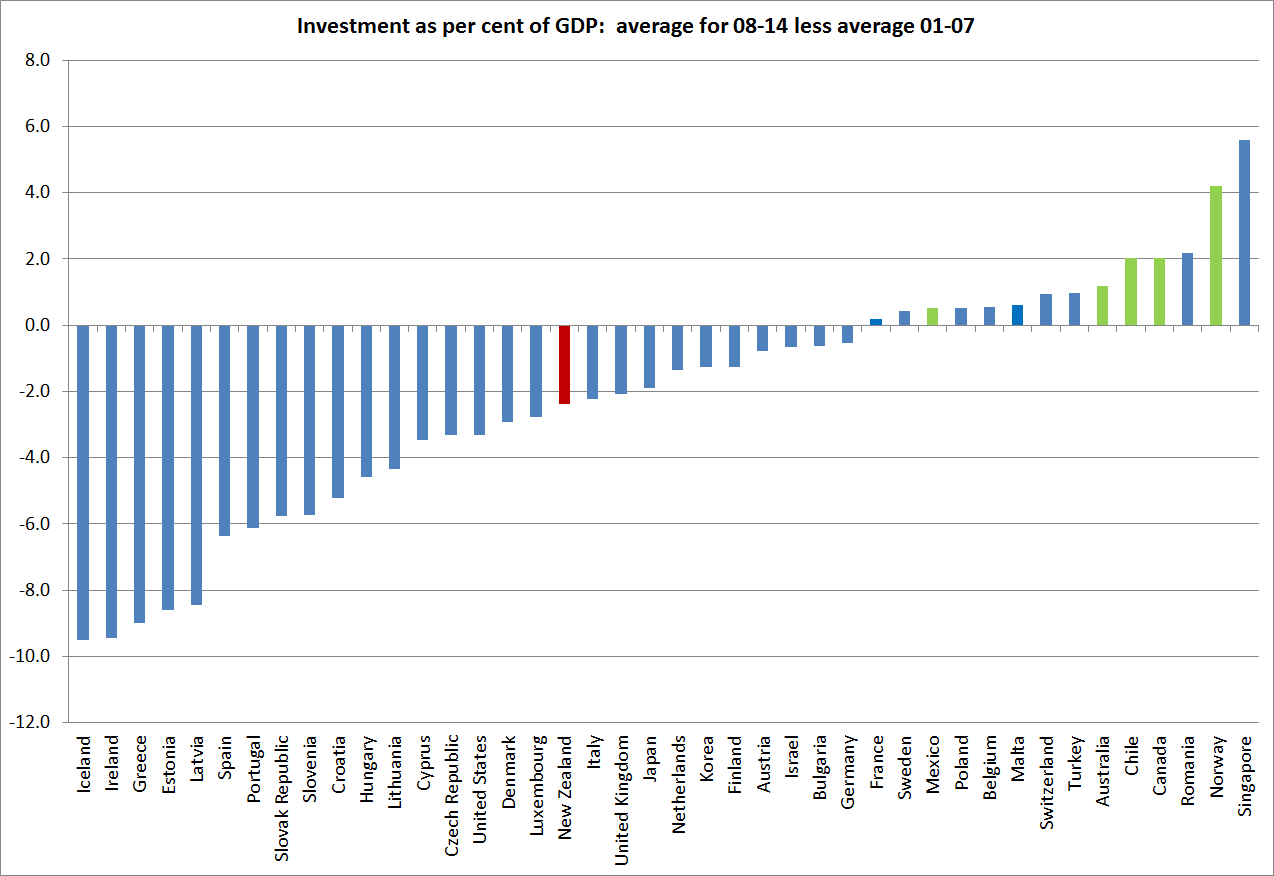
If we do the same chart comparing the average for 2008-14 with the average for 2001-07, New Zealand drops back to the middle of the field, and well behind the other commodity exporters.

investmentwholeperiod

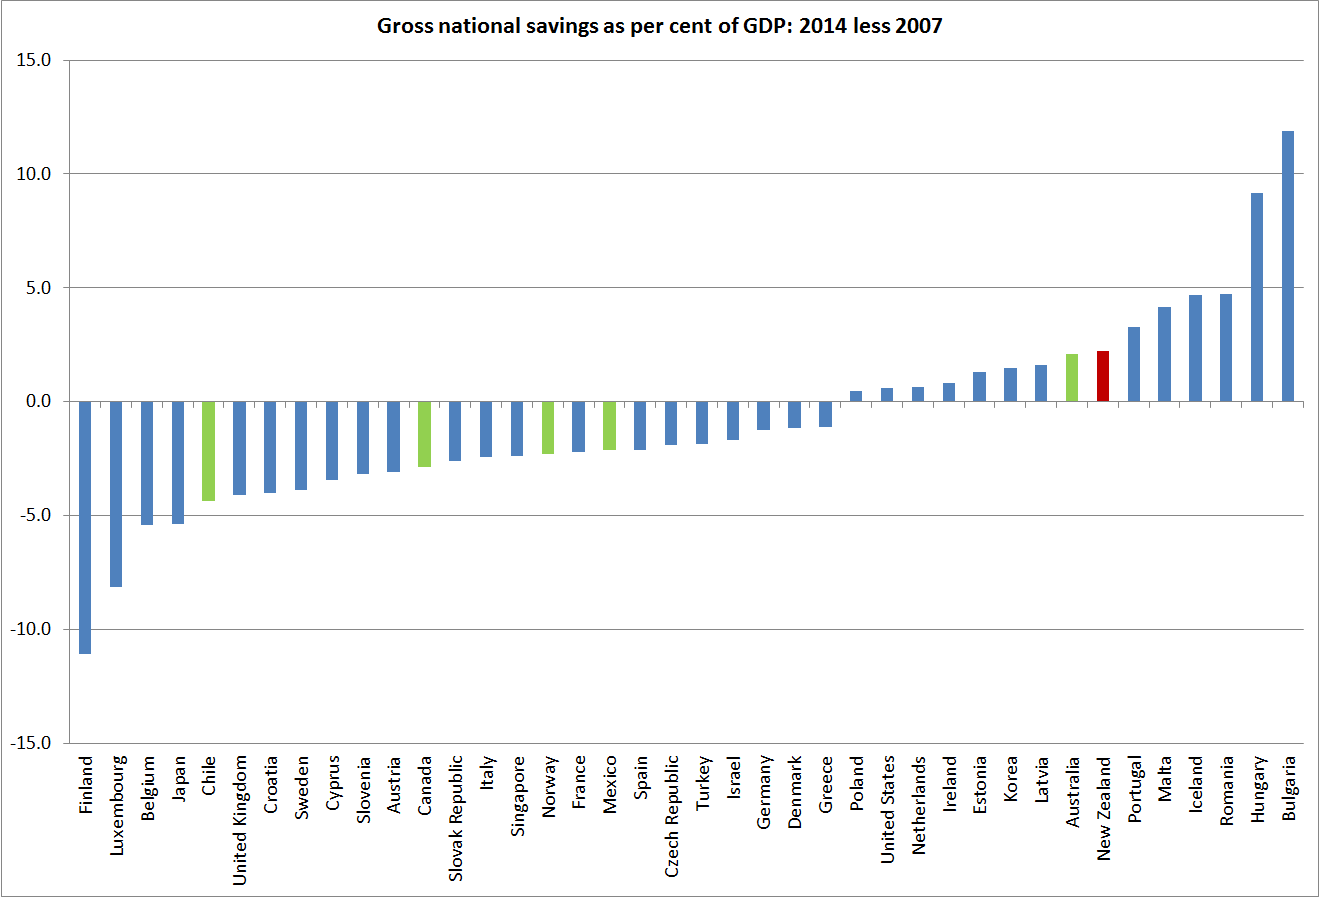
And what about national savings?  On this chart, any patterns are much less obvious.   Savings rates have fallen in more countries than they have risen, but 16 countries have had increases in their national savings rates.  Euro area countries, for example, are not bunched at one end or the other, and New Zealand and Australia show up as among the countries with the larger increases in national savings rates.

savings

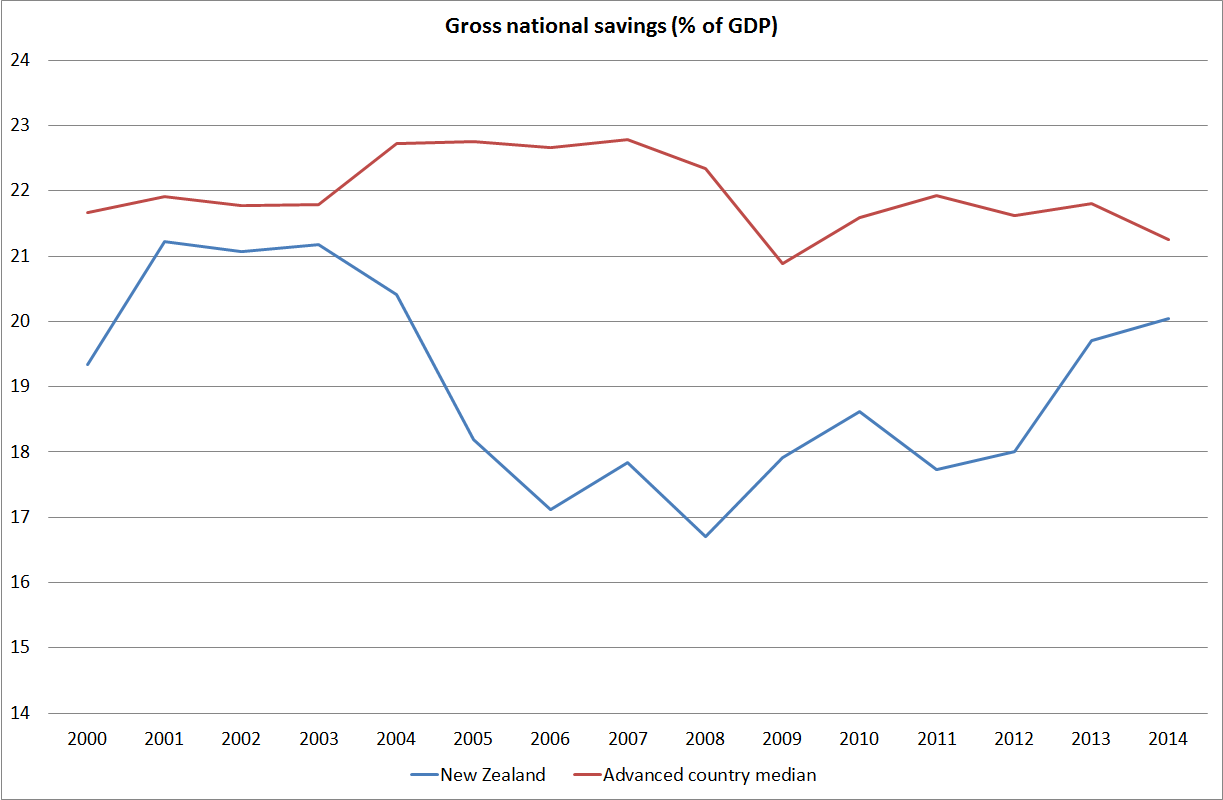
Before anyone starts getting excited about, for example, the impact of Kiwisaver, I should point out that when I compared savings rates for 2008-14 as a whole with those for 2001-07,  New Zealand dropped right back to around the middle of the chart.  Unlike the median advanced country in this sample, New Zealand’s national savings rate fell away sharply in the middle of the last decade, as public (and business) savings rates dropped away sharply.   Our national savings rate is only now back to around the level seen in the early 2000s.

savings2

(And one final note, these are ratios of national savings to domestic product.  In other words, the savings of New Zealanders as share of all that is produced in New Zealand, whether by New Zealanders or foreigners.  In other words, the two series aren’t strictly comparable.  For most countries the difference doesn’t matter, but here national income is materially less than domestic product (the difference is mostly the net earnings of foreigners on New Zealand’s negative net international investment position).  Taking national savings as a share of national income, New Zealand’s national savings rate would be around the median of this group of advanced countries.)

A disappointing cheap shot from ACT

I keep an eye on what quite a few political parties have to say.  Among the bits and pieces that turn up in the in-box is the ACT Party’s newsletter.  This afternoon it had this gratuitous piece in it.

Keep Politicians away from Monetary Policy
Like the rugby boor who wants to endlessly debate past refereeing decisions, we have Russell Norman, with time on his hands now, tweeting about the OCR decision: Would Reserve Bank have made (mistaken) decision to start tightening last year if Board (w broad economy reps) were deciders not just Gov? One thing Russell obviously is not, is an expert on monetary policy.

Who knows what the answer to Russel Norman’s question is.  It might well have depended both on the sort of Board chosen, and the quality of the people appointed to it.  But it seems to me that is an entirely reasonable question for an opposition party finance spokesperson to be asking.  Parliament made the Reserve Bank operationally independent.  Parliament funds the Reserve Bank.  The Minister of Finance takes the lead in setting the policy target.  And the Finance and Expenditure Committee –  which Norman has served on for some years –  has an important role in scrutinising and holding to account the Reserve Bank, including in its conduct of monetary policy.  And, as everyone recognises, Reserve Bank choices, and  occasional Reserve Bank mistakes, have implications for people and their businesses.  People elect MPs to hold public agencies to account.  And we learn by reviewing past decisions in the light of experience.  Who does ACT think should be asking questions if not MPs?

I’ve long been rather ambivalent about the ACT Party, but have usually respected their willingness to treat serious issues seriously. And, in fairness, much the same could be said of the Greens.  There are plenty of Russel Norman’s observations about monetary policy that I’ve disagreed with over the years, but his proposal for a different governance structure is not unusual internationally, and his question as to whether it might have made a difference to the actual path of policy seems an entirely reasonable one.

Cheap shots of this sort don’t advance either the issue, or the reputation of the ACT Party.

Housing, financial stability etc – LEANZ seminar 25 June

About the time, back in April, when I posted some comments on Grant Spencer’s speech on housing LEANZ invited me to speak at one of their Wellington seminars, next Thursday 25 June.

LEANZ is an organisation dedicated to the advancement in New Zealand of the understanding of law and economics. It provides a forum for the exchange of information, analysis and ideas amongst those with an interest in this form of analysis. That interest may be practical (for example, the field of law and economics is very relevant to many aspects of the practice of law, public policy and consultancy), or it may be more academic.

“Nowhere is the baneful effect of the division into specialisms more evident than in … economics and law … the rules of just conduct which the lawyer studies serve a kind of order the character of which the lawyer is largely ignorant; this order is studied chiefly by the economist who in turn is similarly ignorant of the character of the rules of just conduct on which the order he studies rests.” F A Hayek Law, Legislation and Liberty Vol I, pp 4-5. LEANZ hopes to work to bridge this divide.

This is the topic blurb I gave them some time ago –  by the look of it, written before the new lending restrictions proposed in the May FSR

House prices, especially in Auckland, have become increasingly unaffordable. This is largely the outcome of the collision between two sets of public policies: restrictions on land use which impede new housing supply, and high target levels of inward migration of non-citizens.  One or other policy might make sense, but the combination has very adverse effects on the younger and poorer elements of the population of our largest city.  It is a real phenomenon rather than a financial one, and the pressures can only be sustainably alleviated by government action in these policy areas.  The Reserve Bank appears to have taken on itself some responsibility for trying to manage house price fluctuations.  However, the Bank’s involvement appears to be based on a misconception of what is going on, and a misapplication of insights from financial crises abroad, notably that in the United States last decade. There is little or no evidence that financial stability in New Zealand is in any way threatened.  The LVR restrictions –  and others the Bank appears to be contemplating – undermine the efficiency of the financial system.  They may also be slightly impairing its soundness.  Parliament should be asking harder questions about whether such uses of regulatory powers, especially by a single unelected official, are appropriate.

LEANZ tell me that all are welcome to attend –  there is no obligation to become a member first, although I’m sure they would also be happy to have a few more paid-up members.   Details of the event are here.