Reserve Bank spending plans – as transparent as those of the SIS?

Sometimes events determine what I write about.  I had no intention of writing two posts today about Reserve Bank governance, but then I saw that Parliament had ratified the new Funding Agreement for the Reserve Bank.  Since these things come round only every five years, and since the Funding Agreement is a material part of the Bank’s governance framework, today was the day to write about it.

Most government activities are funded, following each year’s Budget, by annual appropriations made by Parliament.  Huge documents are published providing details of the plans the government is seeking appropriations for.

By contrast, historically most central banks were funded from their own resources, and legislatures had no real say in their spending.  A statutory currency monopoly generates a lot of income, even in this era of lower interest rates and electronic payments.  When the Reserve Bank was being reformed in the 1980s, everyone agreed that that model was inappropriate. Some parliamentary accountability/approval for the Bank’s spending was needed.  But, equally, since the main point of the reforms was to provide operational independence for the Reserve Bank on monetary policy, no one really favoured a system of annual parliamentary appropriations for the Bank.  The concern was that a Minister of Finance who wanted the Bank to run looser monetary policy could use the threat of a cut to the next year’s appropriation as behind-the-scenes leverage on the Governor.  Such pressure might be particularly easy to exert since the Governor was both sole monetary policy decision-maker, and chief executive of the organisation.

The model that was settled on and passed by Parliament was a five-yearly Funding Agreement.  Under this model, the Governor reaches an agreement with the Minister of Finance as to how much the Bank can spend in each of the next five years[1], and that agreement only becomes effective when it has been ratified by Parliament.  In fact, it is not even obligatory to have a Funding Agreement – the Act says only that the Governor and Minister “may” reach an agreement, and if there is no agreement then, in principle, the Bank has no formal constraints on its spending.

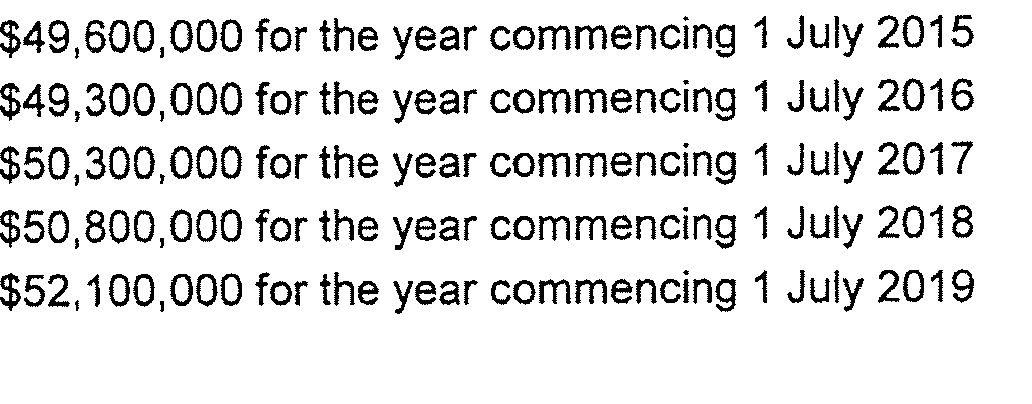
Parliament ratified the latest Funding Agreement last night, after a short debate (of which more below).  The Bank and the Minister had agreed that the Bank will spend $49.6 million this coming year, rising by about 5 per cent in total over the following 4 years[2].

I don’t have any particular argument with the size of the Funding Agreement total, or the modest increase over the next few years (although it does seem to be a larger increase than many government departments, with flat baselines, have been experiencing).  My concern is about process.

In particular, for one of the most powerful government agencies in New Zealand, the agreement contains almost none of the information people might reasonably need, whether as MPs or citizens, to know whether $49.6 million is the right amount.  The entire document runs to just over two pages, but the meat of it is simply five lines
funding agreement

That is the same level of detail we get in the Estimates about the spending of the SIS – and at least Parliament (a) has to vote for the SIS’s spending, or the spending can’t happen, and (b) has to vote each and every year.

MPs were asked to vote on the Funding Agreement yesterday with no information about what the Bank and the Minister proposed that the Bank would do with the money.  Presumably the Minister is aware of the Bank’s plans, but he now has no control over them beyond the top line number.  In particular, the Bank has two quite distinct main statutory functions and it would be useful to know how the spending is split between monetary policy and financial stability.  And within financial stability, how much is being spent on responsibilities under the Reserve Bank Act and how much on those under the Insurance (Prudential Supervision) Act?  And how are those splits envisaged as changing over time?

There is nothing in the Act that requires funding agreements to be so abbreviated, and there is certainly nothing that would have stopped the Bank, the Minister, and Treasury releasing background papers to accompany the Funding Agreement, either before it was put to Parliament.  That would have given MPs, and outside observers, the opportunity to scrutinise the plans for the Bank’s spending before the matter came to a vote in the House.  Estimates hearings for other departments spring to mind.

The Funding Agreement system was a huge step forward when it was introduced in the 1989 Act.  But it is really not good enough 25 years on.  It could be made to work in much more open and transparent way without any legislative changes (as above).

But after 25 years, it is probably time for a re-think of the entire model.  Why should the Reserve Bank be able to spend at all without parliamentary appropriation?  Even if one doesn’t go that far, shouldn’t the (elected) Minister be responsible for telling the Bank how much it can spend, not reaching a (legally voluntary) agreement with the (appointed) Governor on the matter? The Governor can provide advice, and make a bid for spending (as all agencies around town do), but the Minister and Parliament should decide.   Is there really any case for not making the Reserve Bank’s regulatory functions (at least) subject to an annual parliamentary appropriation?  And if monetary policy decision-making responsibility were to move to a non-executive committee would there still really be a need for monetary policy to be funded five years at a time by Parliament[3]?  I’m not sure how I’d answer that final question, but it should at least be asked.

The Funding Agreement model, as laid out in statute, and as it is worked in practice, is just another example of the gaps, the democratic deficits, in the governance model Parliament has put (left) in place for the Reserve Bank.  The onus for change is with the Minister and with Parliament.

And just briefly on the parliamentary debate itself, which you can read here.  It wasn’t Parliament at its finest, but then what could MPs do with so little information? Perhaps even with more information it would still have been an opportunity for hammering hobbyhorse issues?  But what if there had been an estimates hearing first?

In addition to the Associate Minister, four MPs spoke:

  • Grant Robertson seemed to be suggesting that the Bank needed more resources because the government had abdicated policy around the housing boom to the Bank.  More seriously, he argued that the Bank “should be funded for a comprehensive overview of monetary policy and of the policy targets agreement”, arguing (and this is the first time I have heard him speak on the PTA) that New Zealand needs “the kind of policy targets agreement that would enable monetary policy that actually supports the exporters of New Zealand.”
  • Russel Norman spoke, almost entirely about the housing market and financial stability.
  • For New Zealand First Fletcher Tabuteau spoke.  He took the opportunity to advocate significant change in the Reserve Bank, including the change in objectives proposed in private members bills in the previous Parliament by Winston Peters.  Somewhat gratifyingly (I think) he quoted me, and the article last weekend on my governance ideas, noting that I considered the current Reserve Bank governance model “outdated, risky, and out of step internationally”.
  • David Seymour (ACT) also spoke.  It was a curious speech, perhaps intended primarily as a rebuttal of the previous speaker.  He claimed that the Bank of Canada is modelled on the Reserve Bank of New Zealand (which is simply wrong), and appeared to blame the US housing bust on multiple objectives of the Federal Reserve (not a view that would be very widely shared).

But what else could they talk about when they have no more information about planned expenditure than is provided about the SIS?

[1] This is an approximation, both because the Bank can dip into capital (so the agreement does not formally cap the Bank’s spending even on the areas it covers) but also because various aspects of the Bank’s activities are not covered by the headline Funding Agreement total.

[2] Note that in the previous Funding Agreement the Bank had approval to spend $56.4 million in 2014/15.

[3] And actually one problem with the Funding Agreement model has been the difficulty of envisaging what spending will be required five years hence (in both real and nominal terms). No corporate board signs off on budgets five years ahead.
Time to reform Reserve Bank goverance – conceptions of monetary policy

I’ve been arguing that it is Time to reform the governance of the Reserve Bank.  Earlier in the week, I pointed out that no other country does things the way we do (giving a single unelected official discretionary control over monetary policy and much of financial regulatory policy), and that New Zealand does not operate any other areas of policy in this way.  Other policy decisions are generally made by elected politicians or by boards, not by single unelected officials.

But, as I have also pointed out, the model adopted in 1989 had its own logic.  Not only did it reflect (slightly uneasily) the public sector reforms then being put in place, that set out to establish powerful but accountable (and dismissable) chief executives of core government ministries, but it also reflected views about monetary policy that were around at the time.  And when the 1989 Act was being written, and debated, it was the monetary policy role of the Bank that got far and away the most focus. The Act said (and still says) that monetary policy is the “primary function” of the Bank.

The gist of the story is this (more extensive background is here and here):

  • Monetary policy in the late 1980s was highly contentious and subject to lots of uncertainty.  Policy was focused on getting inflation down once and for all, in a newly-deregulated economy where many indicators were hard to interpret.
  • But in some quarters, especially in the Treasury, there was a view that the issues could (and should) all be made much simpler, especially once the initial post-liberalisation period passed.  If, for example, the Reserve Bank could be required to target a steady growth rate in the money base, there would be little room for discretion, and no room for debate as to whether or not the Bank had done its job.
  • Even if those sorts of targets weren’t feasible (and I don’t think anyone in the Reserve Bank ever thought they were), perhaps an inflation target itself could a very close approximation.  If inflation ended up inside a target range, job done.   If not, then not.
  • In short, in the minds of some those shaping the Act there was a sense that monetary policy should not be particularly controversial, and should be a largely technical matter, not involving material amounts of discretion.

Against that backdrop (and I’m inevitably stylising views somewhat), a single unelected decision-maker made some sense. The person would have little effective discretion, and could be dismissed if he/she stepped out of line.

Of course, actual monetary policy, whether in New Zealand or abroad, turned out nothing like that stylised story, even in a low inflation environment.  If done sensibly, monetary policy under inflation targeting involves huge amounts of discretion, amid a great deal of uncertainty.  There are choices to be made that have implications for the price level, and for how things like the unemployment rate and the real exchange rate (and the impact those have on livelihoods of people and businesses) for several years at a time.  Oh, and there hasn’t been an election since 1990 when monetary policy has not been a campaign issue for at least some of the parties.

So the single unelected decision-maker is not a model other countries use, it isn’t how we in New Zealand run other areas of policy, and it also doesn’t fit well with how monetary policy actually works, here or abroad.

Here are the relevant extracts from my paper:

As things were seen in the late 1980s:

This outputs vs outcomes framework was an important factor in the debate around how the Reserve Bank of New Zealand should be governed[1].    From the original discussions around the possibility of converting the Reserve Bank into an SOE, through until at least a year after the Reserve Bank Act was passed, elements of the Treasury were heavily influenced by a strand of thought that reckoned that monetary policy could be appropriately, and perhaps best, configured as an “output” problem.  If so, an autonomous decision-maker could be held clearly and directly accountable for delivering a pre-specified desired output.

At one stage, the idea of a statutory quantitative limit on the Reserve Bank’s note issue was floated.  Rather more persistent was the view that a target rule for growth in the money base – something that could be directly controlled by the Reserve Bank if it chose – was the appropriate basis for setting monetary policy.  If so, it would have been easy to judge whether (or not) the Bank had done its monetary policy job.

Within the Reserve Bank and Treasury it was largely common ground that something like price stability was the appropriate medium-term desired outcome.  However, it was also accepted that, in a market economy, inflation was not directly controllable by policy actions, and could be influenced (indirectly) by monetary policy only with fairly long and variable lags, and subject to a variety of exogenous shocks[2].   A robust relationship between the monetary base and medium-term price stability might have provided a suitable foundation for an outputs-based approach.  But such a relationship never emerged.

The point here is not that the governance aspects of the 1989 Act mechanically reflected views of particular individuals about which operational targets the Reserve Bank should use to conduct monetary policy.   It is more that the milieu inevitably, and perhaps even appropriately, affected the thinking about institutional design.  On the one hand, public sector reforms processes put a strong focus on individualised accountability.  On the other, there was a sense – perhaps rarely written down explicitly, but implicit in a lot that was written – that once low inflation had been achieved, the conduct of monetary policy should be relatively straightforward and not especially controversial.  The implicit vision of monetary policy was of an important, but essentially technical, matter.

And now:

Except for fixed exchange rate countries, output-based approaches to monetary policy do not work.  That was fairly generally recognised internationally by the time the 1989 legislation was passed, but ideas around an output-based framework still had an impact on the New Zealand framework.

For a time perhaps, some hoped that even though an inflation target was for an outcome, it might still be amenable to output-like accountability regimes.  If inflation outcomes were inside the target range, the Reserve Bank had done its job, and if not, then not[3].  But it has not proved to be that simple, for a variety of reasons.  Even core inflation outcomes can be away from the target midpoint for years, and considerable amounts of judgement are required to interpret the Policy Targets Agreement (including, but not limited to, questions around avoiding “unnecessary variability” in output, interest rates and the exchange rate).

Monetary policy setting, in the forecast-based approach adopted across the advanced world, involves considerable discretion.  Reasonable people can reach quite different views

And since Reserve Bank discretion involves choices that can materially affect output and unemployment, for periods of perhaps 1-2 years at a time, or the real exchange rate (and hence relative returns across major sectors of the economy), these choices matter to many people.  To be clear, monetary policy choices materially affect only the price level in the long run, but transition paths (especially when discretionarily chosen) have real implications for real people.

At the time the 1989 Act was passed, monetary policy was highly controversial (as, of course, was much of the rest of the reform programme). But the implicit view was that once low and stable inflation was established monetary policy would be a fairly low-key matter, not exciting much debate or political contention.  In fact, since 1989 there has not been a single general election in which at least one party has not been campaigning for change to the monetary policy aspects of the Reserve Bank Act[4]. Latterly, the tide has been rising, and at the last election for example all the parties on the political left were campaigning for change.  The point here is not whether (or not) the advocates for change are correct, simply to highlight that monetary policy remains contentious, and that to vest all powers in such a controversial area in a single unelected official increasingly seems anomalous.

……..

If a central bank has discretion – and all modern ones (not adopting fixed exchange rates) do – then preferences and values come into play, and it is not obvious why the preferences of a single unelected official should be given such a high weight.

One previous Reserve Bank Governor sometimes liked to argue that he wasn’t very powerful at all – that he was tightly constrained and really had little choice around the decisions he took.  If he really believed it (and he was talking only of monetary policy in any case), I think he must have been the only one to have done so.

Reflect, for example, on the last boom during the 2000s.  Core inflation ended up persistently well above the target midpoint (with no action taken against the Governor by either the Board or the Minister).  That suggests that a different Governor could equally legitimately have made choices that delivered inflation as far below the midpoint of the target range.  Over a 10 year view that difference might not have made much difference to the end-point level of GDP, but it almost certainly would have made a huge difference to the trajectory of GDP, and of many economic activity/price variables, including house prices, debt, the exchange rate, and exports.

Or consider the years since 2007.  Actual decisions have been widely regarded as PTA- consistent, but different Governors could have made a plausible case for a materially looser stance.    That is real, and largely untrammelled[5], power of the sort that societies such as ours very rarely repose in a single person –  elected or not –  no matter how able.  (Indeed, this was the gist of Lars Svensson’s case, in his 2001 review for the previous government, for a formal decision-making committee. Svensson thought very highly of the then Governor, but argued that we needed to build institutions to cope with the less good ones –  less technically able, less inclusive, less good judgement or whatever.)

[1] These issues are treated in Singleton, in a Bulletin article on the origins of inflation targeting http://www.rbnz.govt.nz/research/bulletin/1997_2001/1999sep62_3reddell.pdf, and in  this Reserve Bank piece on monetary policy accountability and monitoring http://www.rbnz.govt.nz/monpol/about/2851362.html

[2] As the Bank itself noted in one 1988 paper, the problem with inflation targeting (relative to, say, money base targeting or a fixed exchange rate) is that it had a “trust us, we know what we are doing” dimension.

[3] The high tide of this sentiment was Don Brash’s unequivocal statement in a radio interview in 1993 that if inflation went above 2 per cent (the top of the then target range) he would lose his job (this statement is reproduced in an interview with Dr Brash included in the September 1993 edition of the Reserve Bank Bulletin).

[4] As far as I am aware, this degree of electoral debate over central banking, spanning multiple elections, is unique to New Zealand.

[5] The note on accountability and monitoring, referenced earlier, discusses some of the practical constraints on what appears in statute to be the Board’s considerable freedom of action to hold a Governor to account.

Yet more on stress tests

Two more points on the stress testing issue.

I’ve mentioned a couple of times that someone who was at the Finance and Expenditure Committee hearing on the day of the Financial Stability Report had told me that the Governor deliberately refused to answer a question about the stress tests, and the implications of those results for assessments of the stability of New Zealand’s financial system.

I’m told that the transcript of that hearing is now on the public record, so here is the relevant question and answer.  The questioner is National MP Chris Bishop, who is deputy chair of the committee:

Bishop             Thanks, Governor. I’m just interested in teasing out what the specific risks to financial stability are for Auckland house prices, because the banking sector has rising capital and liquidity buffers; they exceed the minimums. The banks came through the stress testing pretty well last year. Credit growth is relatively restrained, and as a percentage of GDP, credit is below where it was in 2008-09. So given all that, what are the specific risks to financial stability—which is what we’re discussing here today—from the rising Auckland prices?

Wheeler           I think they’re very substantial. I mean, if you look at mortgage commitments, you quoted a number that credit flowing to the housing sector was low. It is on a net basis, but if you look at mortgage commitments, they’re growing at around 20 percent. House prices in Auckland are growing at around 17 percent. They’ve been growing in the rest of the country over the last year at around 2 percent. If you look at house prices to disposable income in Auckland, that ratio is 7.4 percent. But the rest of the country is 4.2 percent. If you look at rental yields in Auckland, they’re at historic lows, which suggests that there’s a lot of people basically investing for capital gain, whereas the rental yields across the country are basically where they have been for the last 10 years.
If you look at the median house price in Auckland, it’s up 60 percent since 2008. We had the highest rate of house price inflation in the OECD from 2003 to 2008. So the median house price in Auckland is now 60 percent above that. If you look at the Demographia survey that was done last year, we were 14th out of 370 housing markets around the world, in terms of affordability. If you look at the survey that was done by ANZ Bank in terms of investor expectations, late last year, basically, investors in Auckland were forecasting that house prices would increase by 75 percent over the next 5 years. Now, our job is to try and keep inflation, on average, at around 2 percent per annum. So that’s just a phenomenal increase in house prices that are anticipated, and that would just drive house price to disposal income ratios up at a huge rate.

So there’s a whole range of reasons why there are major, I think, financial stability risks around Auckland.

The Governor raised a number of interesting issues, and possible areas of risk, but did not respond to any of Bishop’s points or questions.  Now sometimes MPs at select committees can ask questions just to be on record as having asked them, or to make partisan points.  And so there is an art in how public servants respond to such questions.  But Bishop’s questions and points don’t look as though they fit either of those categories.  They seem to be entirely reasonable questions, drawing on the Bank’s own factual material, and yet the Governor simply chose not to engage or respond.  That doesn’t seem very wise, or very accountable.

And now, back to some geeky stuff.  In discussing the stress tests this morning I mentioned the issue of what size house price fall one might reasonably assume if the stress tests were re-run today.  But as someone pointed out, neither I nor the Bank touched on the other factor that is critical in assessing the likelihood of large loan losses, and that is what happens to unemployment.

By and large, falls in house prices alone do not result in large losses for banks.  Between with-recourse lending and a general desire to avoid moving (which is costly and disruptive), owner-occupiers don’t tend to default if they can service their debts.  Banks can, typically, foreclose if the borrower has negative equity, but are unlikely to do so if the debt is being serviced.  Much the same is likely to go for lending for investment properties –  if rents are high enough to cover the debt service, banks aren’t likely to foreclose.  Foreclosing (itself expensive) crystallises a loss, which might otherwise never happen.

Similarly, high unemployment alone doesn’t typically lead to large loan losses on residential lending.  Some individuals will end up losing their houses, but if they have to sell up (or be sold up) the sale price will usually cover most or all of the debt outstanding.

What gets really nasty is the scenario in which house prices fall a long way and unemployment goes up a lot (and stays high for a while).  In that scenario, many people can’t service their debts (even if the OCR is cut) and if they have to sell, in many cases the proceeds won’t be large enough to cover the debts.

That is the scenario the Reserve Bank’s stress tests (rightly) focused on.  It is the true test of the quality of the residential mortgage loan book.

The Reserve Bank tells us that in the stress test they assumed that the unemployment rate “peaks at just over 13 per cent”.  The unemployment rate at present is 5.8 per cent, and the “natural rate” is probably around 5 per cent.  The modern low was 3.4 per cent.  So 13 per cent is a long way away.  In normal times it would take around an 8 percentage point increase in the unemployment rate to get to “just over 13 per cent”.

I was curious how unusual 13 per cent unemployment rates were, so I downloaded the OECD data as far back as it goes.  In most cases, that is just over 30 years (but we also know that in most OECD countries the earlier decades were decades of pretty full employment).

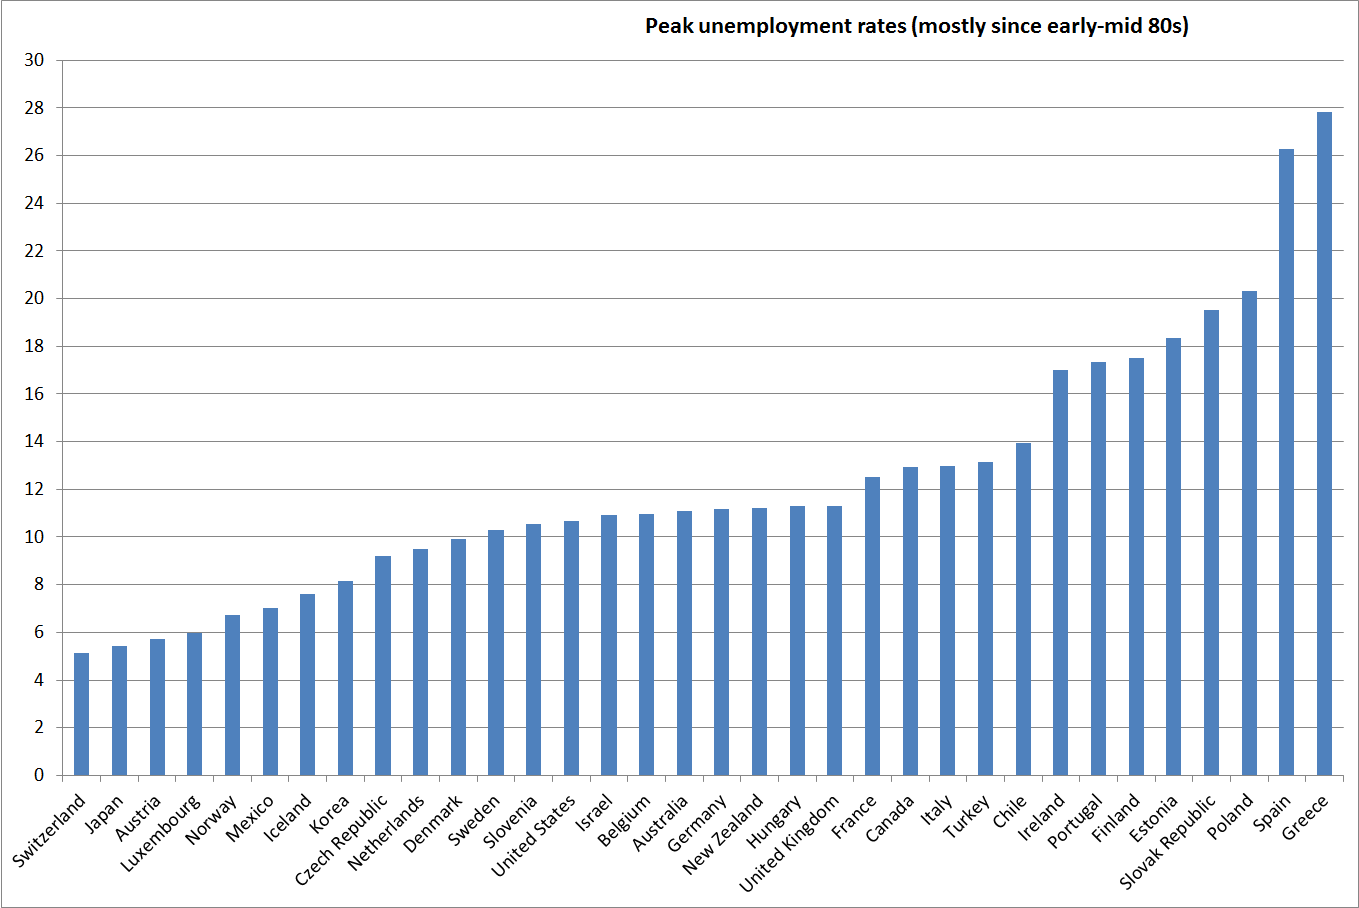
Here is the chart of the highest unemployment rates on record for each of the 34 OECD countries.  Only 13 of the 34 countries has had an unemployment of 12.5 per cent or above in more than 30 years.

peakU

I took a look at those countries.  First, I wanted to understand how much the unemployment rate had increased by in each of those country episodes.  If the NAIRU in one country had been 10 per cent (perhaps reflecting very restrictive labour market regulation), an increase in the unemployment rate to 13 per cent would have much different implications than if that country’s NAIRU was 6 per cent.

Of the 13 countries whose unemployment rates had peaked at over 12.5 per cent, in one case that peak was the first observation in the database (so I couldn’t tell where the unemployment rate had risen from).  Six of the other 12 had had increases in their unemployment rates of 8 percentage points or more (from the previous cyclical low to the measured all-time peak).  Thus, for example, Greece’s unemployment rate peaked at 27.8 per cent last year, but had been as low as 7.5 per cent in 2008.

But the other factor I looked at was the exchange rate regime these countries had been using when their unemployment rate rose to 13 per cent or more.  In only two of the 13 cases had the exchange rate been floating, and in neither of those cases had the unemployment rates increased by anything like 8 percentage points.

Why do floating exchange rates matter?  Simply because they act as a buffer when the economy is hit by severe shocks.  Greece, Spain, and Ireland have had very high unemployment rates (and large increases in those rates) in the last few years because they have had no independent national monetary policy, and no ability for their national nominal exchange rates to depreciate.  The US, the UK, and Iceland, on the other hand, each having had a nasty financial crisis, had nothing like the extent of those increases in unemployment.

Adjustment is a great deal harder, and more costly, without the additional flexibility the floating exchange rate provides.  But New Zealand has had a floating exchange rate for 30 years now, and when the economy has been in serious difficulties the exchange rate has fallen a long way.  No one really doubts that the same would happen again if, say, there was a serious recession here that involved the OCR being cut to, or near, zero.

I’m not suggesting that the unemployment rate could not possibly rise by 8 percentage points here.  From 1987 to 1991, the unemployment rate did rise by 7 percentage points, to around 11 per cent, even with a floating exchange rate.  But that was a pretty stringent test:

  • Huge amounts of labour-shedding from public and private sector structural reform
  • A serious domestic financial crisis
  • And the transitional costs of both lowering inflation markedly, and closing the fiscal deficit, at the same time.

My point is simply to highlight that the Reserve Bank’s stress tests were very stringent, using an increase in the unemployment rate larger than any seen in any floating exchange rate country in at least 30 years.  It is right that stress tests are stringent (the point is to test whether the system is robust to pretty extreme shocks)  but these ones certainly were.  And yet not a single one of big banks lost money in a single year.  That might seem a bit optimistic –  it did to me when I first saw the results –  but they are the Reserve Bank’s own numbers.

And so, again, we are left wondering where is the evidence for the Governor’s latest regulatory initiative?

The Reserve Bank’s stress tests – again

On 13 May, the Reserve Bank released its latest Financial Stability Report. As part of that release, the Governor announced that he intended to impose a ban on (highish LVR) lending secured on Auckland residential investment properties. The Bank indicated that a consultation document on the proposal would be released in “late May”.

The consultation document finally appeared yesterday. I have some fairly extensive comments on the contents of the document, and on the process. I will be making a submission, and will publish that here in due course.

But today I wanted to focus on just one aspect: the place of the stress tests the Bank undertook, with APRA, last year.

As a reminder, the results of the stress tests were reported in the November 2014 FSR (details on pages 9-11 here). The Reserve Bank was, apparently, then very happy with the resilience of the banks (individually and as a system – the latter rather than the former being the required statutory focus). As they noted:

The Reserve Bank’s emphasis tends to be on ensuring that banks have sufficient capital to absorb credit losses before mitigating actions are taken into account. The results of this stress test are reassuring, as they suggest that New Zealand banks would remain resilient, even in the face of a very severe macroeconomic downturn.

As I noted on 13 May, it was somewhat surprising then to find no reference to these stress test results in the latest FSR, even as the Governor was moving to impose very restrictive and intrusive new controls. I suggested that perhaps the Governor did not believe the stress tests. But if so, he owed us an explanation for why, especially in view of the fairly unconditionally positive coverage of the stress test results which he had signed off on in finalising the November report.

I was further puzzled when someone who had attended the Finance and Expenditure Committee hearing on the FSR told me that when the Governor was questioned about the stress test results and their implications for conclusions about the soundness of the financial system, he had simply avoided answering that element of the question.

However, the Reserve Bank then referred to the stress test results in responding to questions to the Herald’s personal finance columnist, Mary Holm. I covered those comments earlier.

On 16 May, there was this extract:

What does the RB think about the possibility of a property plunge. “Whether property prices could drop by half from today’s values is purely speculative,” she says. “Nevertheless, a 50 per cent drop matches some of the more severely affected economies in the global financial crisis such as Ireland.”
So they’re not ruling it out. But would such a drop cause banks to “collapse”? “The short answer is no, we do not believe so,” she says.
“The Reserve Bank conducts regular bank stress tests in collaboration with the Australian Prudential Regulation Authority. The most recent one was last year, and the results of it are featured in the November 2014 Financial Stability Report, pages 9 to 11, on our website.
“This stress-test exercise featured two imagined adverse economic scenarios over five years, one of which involved a sharp slowdown in economic growth in China, which triggered a severe double-dip recession in New Zealand. Among the impacts were house prices declining by 40 per cent nationally, with a more pronounced fall in Auckland – similar to your reader’s worst case scenario.”
So how would our banks fare?
“The Reserve Bank was generally satisfied with how the banks managed their way through the impacts of these scenarios, and we are comfortable that the New Zealand financial system is currently sound and stable, and capable of withstanding a major adverse event.”
Note that present continuous tense in the final sentence: we are comfortable “that the New Zealand financial system is…capable of withstanding a major adverse event”.

That was reassuring, but it did appear inconsistent with proposals for heavy-handed new controls on the other.

And then the following Saturday, we got some more comment from another Bank spokesperson.

“We repeat our comments from last week that the Reserve Bank was generally satisfied with how banks managed their way through the impacts of two adverse economic scenarios in the 2014 bank stress tests, which included a scenario similar to what your reader describes.
“We are comfortable that the New Zealand financial system is capable of withstanding a major adverse event, such as a collapse by up to 50 per cent of the Auckland housing market.”
These words, given to the Herald after the publication of the FSR and published less than two weeks ago, stated quite explicitly that the Bank is “comfortable that the New Zealand financial system is capable of withstanding a major adverse event, such as a collapse by up to 50 per cent of the Auckland housing market”.

And there I half-expected the matter to rest. Since policy development around LVRs seemed to be on a (rather distant) parallel track to stress-testing analysis, I half-expected the consultation document to avoid any mention of the stress-testing results at all, the Bank having reaffirmed only 10 days or so ago the resilience of the system.

But in yesterday’s consultation document, they do address briefly the stress-testing issue. Here is what they say:

The Reserve Bank, in conjunction with the Australian Prudential Regulation Authority, ran stress tests of the New Zealand banking system during 2014. These stress tests featured a significant housing market downturn, concentrated in the Auckland region, as well as a generalised economic downturn. While banks reported generally robust results in these tests, capital ratios fell to within 1 percent of minimum requirements for the system as a whole. Since the scenarios for this test were finalised in early 2014, Auckland house prices have increased by a further 18 percent. Further, the share of lending going to Auckland is increasing, and a greater share of this lending is going to investors. The Reserve Bank’s assessment is that stress test results would be worse if the exercise was repeated now.

First, they note that “capital ratios” in the stress test fell to within 1 per cent [percentage point] of minimum requirements for the system as a whole. But here is how those results were described in the November FSR.

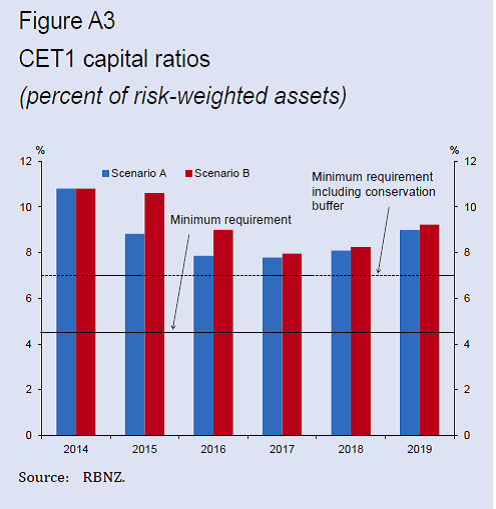
Common equity Tier 1 (CET1) capital ratios declined by around 3 percentage points to a trough of just under 8 percent in each scenario, but remained well above the regulatory minimum of 4.5 percent (figure A3). Banks are also required to maintain a 2.5 percent conservation buffer above all minimum regulatory capital requirements, or else face restrictions on dividends. On average the banking system fell within this buffer ratio in both scenarios, due to total capital ratios falling close to minimum requirements (figure A4). Average buffer ratios reached a low of 1 percent in both scenarios. As a result, some banks would have been faced with restrictions on their ability to issue dividends. The intention of the buffer ratio is to provide a layer of capital that can readily absorb losses during a period of severe stress without undermining the ongoing viability of the bank. Given the severity of the scenarios, capital falling within buffer ratios was an expected outcome.

In other words, the Bank seemed pretty comfortable. As they should have been. A banking system that can withstand a very severe asset market correction and adverse macroeconomic shock with, at worst, “some banks would have been faced with restrictions on their ability to issue dividends”, while all were always above minimum required ratios (themselves calculated using risk weights that are demanding by international standards) is an extremely strong banking system. Plenty of banks abroad raised additional capital during 2008/09 without ever coming close to failure, but not one of the big New Zealand banks ever needed to raise any new capital in these stress test scenarios. But that it is what one would expect when capital buffers are large, and credit to GDP ratios have been going nowhere for seven or eight years.

As the Bank also notes, it is not even that the loan losses in the scenario were large enough to cut into the dollar level of capital banks held: the deterioration in capital ratios arises only because the risk weights on bank loan books rise in the course of the severe downturn. Not a single bank had less capital at the end of the severe stress scenario than at the beginning.

CET1 (tier one, common equity) is the focus of the Bank’s capital framework.  Here is the chart from the stress test results.

CET

The Bank also rightly notes that the scenarios for the stress tests were finalised in early 2014 and things have changed since then. Of course, they have not changed materially in the two weeks since the Bank publically reaffirmed the resilience of the system, but let’s put that detail to one side for the moment.

Unfortunately, neither the Bank nor I can easily tell what this set of facts means for the results if the stress tests were to be run today. Auckland house prices have certainly increased a lot in the last year, the share of lending going to Auckland has increased, and a greater share of this (Auckland) lending is going to investors.  But other things have changed too – among other things, nominal incomes are higher than they were then, and interest rates look to be lower for longer than the earlier scenario envisaged. Those owing the large accumulated stock of debt (a stock that continues to worry the Bank) have had more time, and more income, to strengthen their own ability to handle adverse shocks.

Perhaps the much higher level of Auckland house prices now suggests that any future stress test scenario should use an even larger fall than the 50 per cent used last year. But 50 per cent is about as large a fall in house prices as has been seen, on any sustained basis, anywhere. If a 50 per cent fall is still a reasonable scenario from the new higher level (as I’d argue it is, given that no one has a good basis for knowing the “equilibrium” level of prices in the presence of ongoing regulatory constraints and policy-fuelled population growth), then all else equal there would be fewer loan losses for banks in an updated test not more.

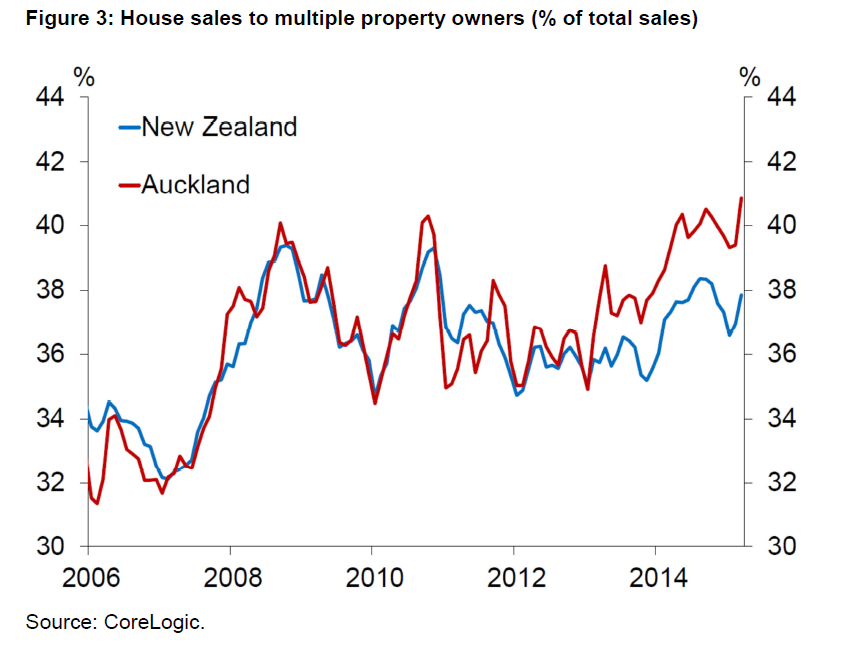
It is certainly true that a higher share of residential lending is now taking place in Auckland (although I suspect the share of the stock can’t have changed much in one year). In the stress test scenario that would, mechanically, mean a higher level of losses (since the scenario assumed a larger fall in house prices in Auckland than elsewhere). And of the lending in Auckland a little more has been going to investors. But note that final point carefully – as Figure 3 in their consultation document illustrates, the proportion of house sales being made to “multiple property owners” (the proxy for investors) is now no higher than the average in the series since 2008.

multiple

The investor property share is higher than previously in Auckland but (a) the difference from the rest of New Zealand is small, and (b) the greater role of investors is partly due to the earlier LVR restriction, which will have forced some first home buyers out of the market, to be replaced by investors. Moreover, in the consultation document the Bank indicates that the earlier LVR restriction has improved the overall “resilience” of the financial system. Even if one believed that lending to investors was riskier than lending to owner-occupiers, all other characteristics of the loan held equal (and the Bank has still not yet persuasively made that case), the overall implications of any changes in portfolio structures over the last year look likely to be small.

Stress tests run today would certainly produce different results to stress tests run a year ago.  But housing loan losses have hardly ever been at the heart of a banking crisis, the stock of debt is rising only slowly, and the 2014 results were so strong that it is difficult to believe that the Bank’s analysts are seriously wanting us to believe that stress tests run today would suggest that the financial system was now imperilled. Indeed, I noted the careful way their claim was worded – they suggest that the results today would be “worse”, but not “materially” or “substantially” worse. Given how strong the 2014 results were – as the Bank itself told us – a slight deterioration, in a business so fraught with uncertainty, should not really be a matter of particular concern.  Recall that in last year’s tests –  an exercise to which the Bank and APRA devoted a lot of resource –  not a single bank had a single year of losses.    It might sound too good to be true, but it is the Bank’s own work, and “no losses” leaves rather large room for them to be wrong without the soundness of the system being in jeopardy.

Unfortunately, the Bank seems to be all over the place on this issue. It is difficult not to feel some sympathy for the staff who are required to dream up rationalisations, and explain away past robust results, to provide some support for the Governor’s strong pre-determined views.  But if they really do believe that stress tests run today would result in a materially greater threat to the financial system then (a) they should probably have steps in train already to raise required levels of bank capital, and (b) it might have been helpful if they made the case in the Financial Stability Report.

Time to reform Reserve Bank governance – domestic public sector perspectives

Yesterday, in discussing my proposition that it is now Time to reform the governance of the Reserve Bank I outlined the contrast between the international perspectives available in the late 1980s when Parliament set up the governance model for the Bank and those available now.  Very few countries then  central banks (or financial regulatory agencies) that had statutory and effective operational policy independence. There was no international standard that could have been followed.  But of the many countries who have reformed their institutions since 1989 not one has followed the New Zealand model.  It is very rare for a single unelected individual to have sole legal responsibility for monetary policy decisions, and unknown for one such person to have decision-making authority on both monetary policy and major policy aspects of financial institution regulation and supervision.

Today, I went to look briefly at how New Zealand public sector governance, and conception around it, have changed since 1989.   The Reserve Bank is just one among many New Zealand public sector agencies, and it is inevitable, and highly appropriate, that thinking around how to design, manage, and govern other New Zealand public sector agencies should influence how we structure our central bank and financial institution regulatory agency.  Huge change took place in the New Zealand public sector in the late 1980s, and the Reserve Bank was somewhat uneasily fitted in to the model.

Back then, the Governor of the Reserve Bank was seen as somewhat akin to a core government CEO. In the reforms of the day, those CEOs were to have performance agreements with ministers, and would be able to be dismissed if they did not achieve the “output” targets specified in those agreements.  Departmental CEOs were envisaged as having considerable operational autonomy to achieve these measureable goals.

The state sector has changed considerably since then.  For a variety of reasons, departmental chief executives have much less autonomy, and there is much greater emphasis on departments working together, and a recognition that most key decisions rest with ministers.  The public service CEO model is not a good guide to how to organise the Reserve Bank, which does have considerable autonomy in policy.

By contrast, the Crown entity model has been developed and systematised subsequently.  The numerous Crown entities each perform statutory roles, across a range of types of activities (some more policy-oriented, and others largely just service delivery).  But I am not aware of any of these entities in which a chief executive has principal policymaking powers.  Rather, key framework decisions are typically made by the board of the respective entity –  and members, and the chair, are directly appointed by a minister.  The Reserve Bank is not a Crown entity (in the formal central government organisation chart) but as a model for governing agencies that exercise independent authority on behalf of the Crown the approaches used in Crown entities (perhaps especially the “Crown agents” class) seem to be a much more suitable starting point for thinking about governing the Reserve Bank.

In the rest of our system of government, single individuals simply do not exercise the degree of power –  without meaningful prospect of appeal or review – that Governor of the Reserve Bank has.

Some extracts from my paper:

As things stood in the late 1980s:

The Reserve Bank was just one of many New Zealand public sector agencies to face far-reaching reforms in the late 1980s.

The governance of government-owned commercial operations had been reformed first (the   SOE model came into effect in 1987).  For entities operating under the SOE model, the governance was to be very similar to that in a conventional corporate: the Minister appointed Board members, who in turn appointed a CEO to conduct affairs under authority granted to him/her by the Board.    For a time, the Treasury had been very interested in the possibility of applying the SOE model to the Bank[1].

The State Sector Act 1988 (and the Public Finance Act 1989) dealt with the non-commercial departments.  The insights that shaped that legislation were more practically relevant to later discussions around the Reserve Bank.

Under the previous state sector legislation, heads of government departments had permanent appointments – a model which had both significant advantages (as regards free and frank policy advice) and significant disadvantages (all but impossible to get rid of weak performers).  The new legislation put chief executives of government departments on fixed term contracts and provided for the establishment of performance agreements between chief executives and the respective ministers.  It provided stronger operational autonomy (from Ministers and from the State Services Commission) for chief executives and agencies, and the focus was on being able to hold individuals to account.

A key part of this, at least conceptually, was the attempt at a clear delineation between, on the one hand, the “outputs” of government agencies (things agencies could directly control – e.g. volume and quality of policy advice; hours devoted to traffic patrols etc) and, on the other hand, “outcomes”.  Outcomes (e.g. a lower crime rate) were things that politicians and the public probably most cared about.  Outcomes were typically affected by the actions of government agencies, but there was no direct and unambiguous mapping between specific actions of agencies and desired “outcomes”.  The conception was that CEOs could be held directly accountable for the achievement of output targets that were set by Ministers in performance agreements.

And as things stand now

Some aspects of 1980s public sector reform have proved resilient.  The domestic SOE model proved relatively successful for commercial operations owned by government, and relatively enduring, in form as well as in substance.  It is becoming less important, particular since the recent wave of partial privatisations, but the proposition that government business activities should be managed commercially, using fairly standard business governance models, has stood up well.

By contrast, in core government departments, the usefulness of the outputs vs outcomes approach as a guiding principle for assignment of responsibilities, and accountability, has probably not lived up to the hopes of the designers.   And, not unrelatedly, the degree of effective operational autonomy for (single decision-maker) department chief executives is far less than was probably envisaged by the early advocates of the model.  More recently, as a matter of active policy, departmental autonomy now appears to be consciously discouraged, with an emphasis on “whole of government” or “joined-up government” approaches –  whether with a view to cost-savings, better policy outcomes, or both.

Much about the way policy is implemented is politically sensitive (i.e. voters expect politicians to be accountable for choices about both “whats” and “hows”).   A government concerned to lift educational standards (an outcome) cannot conceivably simply leave to the Secretary of Education the question of whether to adopt, say, a National Standards regime as an “output” in support of the government’s desired “outcome”

As a result, the clean delineation between outcomes and outputs has rarely worked overly well.  Government departments still have single (unelected) decision-makers (i.e. their chief executives) but those individuals have little effective independence over outward-facing “how” decisions[2] (or, increasingly, over key aspects of the internal management of their own agencies).

There have always been many government entities beyond departments and SOEs.  Numerous Crown entities exist to carry out a wide variety of public functions[3].   A consistent framework for these institutions did not exist in the 1980s but in 2004 the Crown Entities Act was passed.  It was designed, in Treasury’s words, to “reform the law relating to Crown entities and provide a consistent framework for the establishment, governance and operation of Crown entities. It also clarifies accountability relationships between Crown entities, their board members, their responsible Ministers and the House of Representatives”.

The Reserve Bank is not, formally, a Crown entity, standing in a category of its own in the government organisation chart.  There is no obvious reason for that to continue, since there is little obviously unique about the role or functions of the Bank.  But the point I wish to make here is simply that, across the wide range of Crown entities (and various sub-categories within that grouping), I am not aware of any case where a chief executive has principal or exclusive decision-making powers  Crown entities typically exist to give effect to:

  • implement some aspect of government policy (e.g. EQC, ACC, FMA, NZQA),
  • provide advice and/or participate in public debate (e.g. Productivity Commission, Retirement Commission, Law Commission), or
  • carry out some function government has determined to fund and provide (e.g. NZSO, Te Papa).

In some areas, of course, aspects of the application of policy will shade into policy itself, but matters with pervasive external effects are not simply decided by a CEO.  Each of the significant entities I am aware of have a board which has ultimate responsibility for the conduct, and key framework decisions, of the organisation[4].  Board members, and typically the chair, are directly appointed by Ministers, and each chief executive exercises their delegated power under the direct authority of the respective board.

The practice of collective decision-making (and/or formal review or appeal rights) goes still broader, and is deeply entrenched in our system. Indeed, in New Zealand public life, it is difficult to think of any other position in which the holder wields as much individual power, without practical possibility of appeal[5], as the Governor of the Reserve Bank does.  Judges, of course, have the power to imprison – but all lower court decisions are subject to appeal, and higher courts sit as a bench, so that no one person’s view alone decides the case.  Resource management consent decisions, which hugely and directly affect property rights and values, are subject to appeal.  Individual Ministers exercise significant authority, although often requiring the involvement of Cabinet.  In New Zealand, all ministers are elected MPs, and any individual minister serves only at the pleasure of the Prime Minister.  The Prime Minister, of course, has huge power, but cabinet government is a key feature of our system, and (more hard-headedly) the Prime Minister holds power only while he commands the confidence of his own (elected) caucus.  As Kevin Rudd found, that confidence can be withdrawn very quickly.

Typically, public policy decisions that have far-reaching ramifications or that are not customarily made within clear and prescriptive guidelines, are either made collectively, or are subject to appeal, or both.       There is nothing comparable in respect of the Reserve Bank.

[1] The ideas are discussed, not entirely impartially, in chapter 5 of the Singleton et al history of the Reserve Bank.  Note that at the time there was no formal framework for Crown entities.

[2] Of course “who” decisions (eg on prosecutions, or tax audits, or licenses etc) rightly remain far-removed from Ministers.

[3] http://www.ssc.govt.nz/state_sector_organisations sets out all current state sector organisations.

[4] I have not attempted to work through the entire list of Crown entities to check their respective pieces of legislation, so if there are exceptions I would be happy to be advised of them.

[5] The override powers in Section 12 of the Reserve Bank Act do, of course, provide some scope for acting to deal with a Governor doing rogue things – but are not a routine part of governance (and have never been used).  The Reserve Bank can induce, or materially worsen, a recession without significant threat of those powers being used.  Perhaps, for example, it did in 1998, during the MCI fiasco.

A small win for transparency

It has only taken just over two months, for papers that are more than 10 years old, but the Reserve Bank has finally complied with my request for the papers for the March 2005 Monetary Policy Statement.  I welcome the fact that the papers are also being released on the Bank’s website (link below), which makes them widely available, and highlights to future researchers that they have been released.

The Bank has released the papers without redaction, and without withholding any complete papers.  Again,that is welcome (if no more than we should have expected).  But the interesting question is where the Bank’s threshold is.  Would they take the same approach to papers from 2010, or from 2013?  Perhaps someone might like to lodge such requests?   My interest had first been to establish the principle that, albeit with some lag, forecast week papers should be accessible to the public, and open to scrutiny from researchers, MPs, and interested members of the public.  That seems to have been done.

3 June 2015

Mr Michael Reddell

18 Bay Lair Grove

Island Bay

Wellington 6023

Dear Mr Reddell

On 2 April 2015, you made an Official Information request to the Reserve Bank seeking:

Copies of all the papers provided to the Bank’s Monetary Policy Committee, and Official Cash Rate Advisory Group, in preparation for the March 2005 Monetary Policy Statement. In particular, I am seeking all papers that would now be described as “forecast week papers” and any/all email updates/clarifications provided to the committee (whether through hard copies, or thru email groups such as MPCCOM or OCRAG, or their predecessors) from the start of the forecast week for that round to the release of that Monetary Policy Statement

The Reserve Bank is releasing to you the following information:

  1. Alternative forecasts – MPC Paper March 2005
  2. Alternative forecasts presentation (March 2005).ppt
  3. Alternative scenario and uncertainty dept meeting Feb05.ppt
  4. Alternative Scenarios and Uncertainty Memo – March MPS 2005 (final).doc
  5. Alternative Scenarios for MPC.ppt
  6. At first glance – Dwelling consents jan 05
  7. At first glance – Dwelling consents, December 2004
  8. At first glance – wpip December 20040.pdf
  9. At First Glance Feb 05 Consensus Forecasts.pdf
  10. Business investment forecast notes (March 2005 round)
  11. Business Investment Slides March 2005
  12. Consumption forecast notes – March 2005 MPS
  13. Domestic Chart pack March MPS round 2005
  14. Economic Projections for March 2005 MPS
  15. Economic Projections presentation March 2005 MPS
  16. Economic Projections under unchanged policy path, March 2004 MPS.doc
  17. Effective mortgage rates and OCR graph
  18. Emails to MPC and or OCRAG  for March MPS
  19. filenote for Board and OCRAG to reconcile changes between 1st-pass and published March 05 MPS projections
  20. FINAL: Economic projections for March MPS
  21. Financial Market Developments – Week 5 Paper March 2005 MPS.doc
  22. Forecasting notes External Sector March 2005.doc
  23. GDP Forecasting Notes
  24. Indicator chart – 28 February 2005
  25. Migration slides March 2005.ppt
  26. Near-term GDP forecasts
  27. Nearterm GDP slides.ppt

The Reserve Bank intends to publish this response to you on its website. http://www.rbnz.govt.nz/research_and_publications/official_information/

You have the right to seek a review of the Reserve Bank’s decisions, under section 28 of the Official Information Act.

Yours sincerely

Angus Barclay

External Communications Advisor | Reserve Bank of New Zealand

2 The Terrace, Wellington 6011 | P O Box 2498, Wellington 6140

www.rbnz.govt.nz

Who has had the stablest current account of them all?

I was reading last night a BIS paper from a couple of years ago about the current account experiences (most recently, experiences of surpluses) of China and Germany. Being a data junkie that led me on to the IMF WEO database, looking at the current account experiences of the various economies the IMF classifies as “advanced”. There are 37 of them (but as ever it is a mystery as to how San Marino makes the list, and I ignore them from here on).

The WEO database has current account data back to 1980, although for some of the former communist countries it isn’t available until the early 1990s. The range of experiences is fascinating:
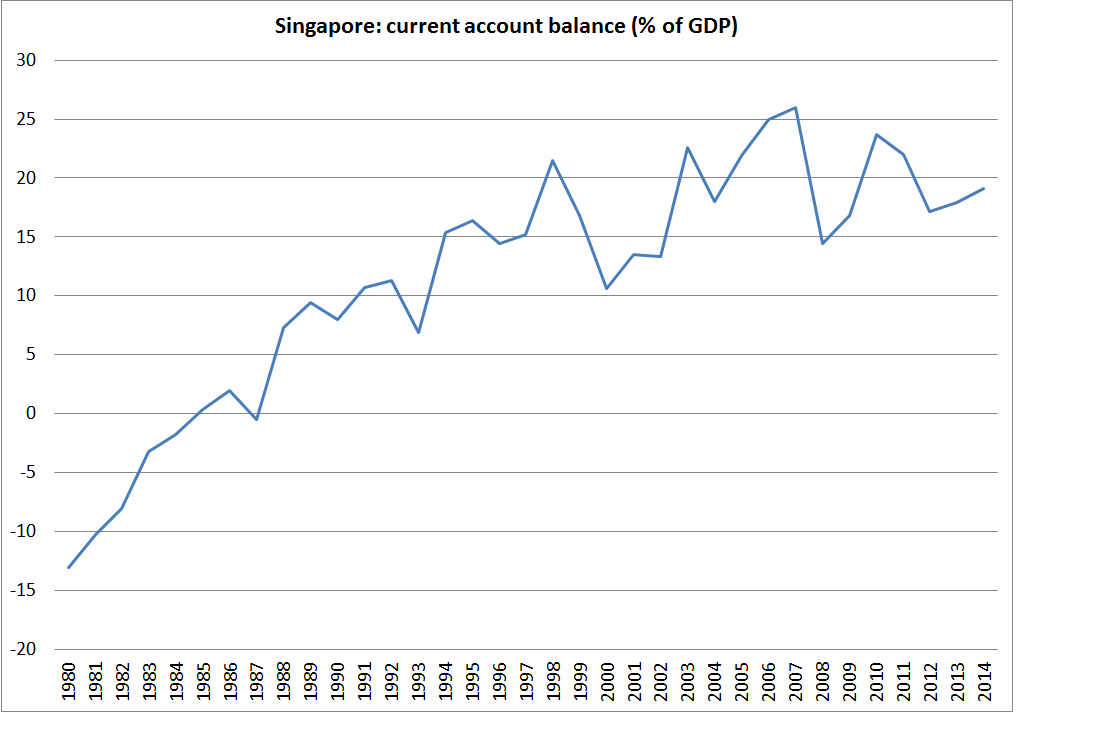
• Largest deficit was 23.2 per cent of GDP (Iceland in 2006, when the aluminium smelters were going in).
• Largest surplus was Singapore in 2007, 26.0 per cent of GDP.
• Only Luxembourg and Taiwan have not run a deficit in any year since 1980
• Only New Zealand and Australia have not once run a surplus in that period.

I was intrigued by the variability (or in many case, lack of it) of the current account balances. The current account balance is often regarded as a buffer, enabling countries to absorb shocks without disrupting a smooth(ish) path of per capita consumption. But here are the standard deviations of the current account balances (as a per cent of GDP) for each of the advanced countries since 1980 (or for the full period for which there is data for each country, but in all cases at least 20 years).

cab

Some of the results surprised me. Australia, in particular, which has had the smallest standard deviation in its current account balances of any of these countries, over 35 years. For a country with a quite volatile terms of trade, and having a massive investment boom in the minerals sector over the last decade, that is quite remarkable. At the other end of the spectrum is Singapore. Singapore’s current account has been becoming much more volatile but the very high standard deviation also partly reflects a structural (but highly distorted) transition from some of the larger current account deficits in the sample, back in early 1980s, to the largest surpluses more recently.

sing

A stable current account deficit is neither obviously good nor obviously bad.  It depends on the shocks the particularly economy has faced. And the exchange rate regime plays a part (although of course, the choice of exchange rate regime should depend, at least in part, on the sorts of shocks the economy faces).

Only four of these 36 countries have had a floating exchange rate for the whole period since 1980 – the United States, the United Kingdom, Canada and Japan. All four show up as having had relatively stable current account balances. We could add in Switzerland – with a brief deviation from floating quite recently – and Australia, which has floated since 1983. Five of the six are then among the countries which have had the most stable current accounts, and Switzerland has been around the median. New Zealand’s experience also sits with this stable group, again despite having had some of the most volatile terms of trade of any of the advanced economies.

What about the other end of the spectrum? Of the 10 countries which have had the most volatile current account balances, only Taiwan and Norway now have floating exchange rates. Iceland’s floated freely for a while, but is now managed, as is Singapore’s.

As one would expect, it looks as though in floating exchange rate countries, the exchange rate has reduced the extent of the variability in countries’ current account balances. That isn’t surprising, and it is consistent with formal New Zealand work on how the exchange rate has responded to commodity prices and/or the terms of trade. But it might not always be a desirable feature either. Some shocks will be domestic in nature, and in principle it might be better to absorb them in greater variability in the current account rather than in the exchange rate. And if the terms of trade are volatile, there might also be a case for allowing more of the variability into the current account, rather than immediately seeing the real exchange rate move against producers in all other tradables sectors (eg if dairy prices soar, a higher exchange rate might smooth the effects on dairy farmers, but could greatly complicate life for other tradables sector producers).  If the terms of trade shock is lasting, the real exchange rate will rise eventually, but if not then perhaps less variability in the exchange rate might have some advantages.

Simple charts like this don’t lead to policy conclusions. After all, one of the big challenges firms (and households and governments/central banks) face is knowing which shocks are temporary and which are permanent.  We need a regime that is robust to our uncertainty about the shocks.  And any consideration of a more-fixed exchange rate for New Zealand would run into the complication of the long-term differential between our interest rates and those abroad. (At the extreme, a fixed exchange rate would equalise nominal interest rates, but wouldn’t itself change the conditions that had required the difference in real interest rates in the first place).

I’ve tended to be a defender and advocate of the floating exchange rate regime for New Zealand – not necessarily as a first best option, but as better than any of the feasible (and freedom-respecting) alternatives for the time being. On the whole, I still think that is probably the right conclusion, but I do find it a little surprising, and perhaps a little troubling, that New Zealand has had one of least variable current account balances among advanced economies in the last 35 years. The positive dimension of that is that New Zealand never faced a serious external funding crisis in that time (unlike the Baltics, or Korea, or Greece or Portugal). But it hasn’t exactly been an untroubled time for New Zealand – it is a period that encompasses Think Big, huge swings in fiscal policy, credit booms and one bust, financial crisis, considerable variability in the terms of trade, and so on.

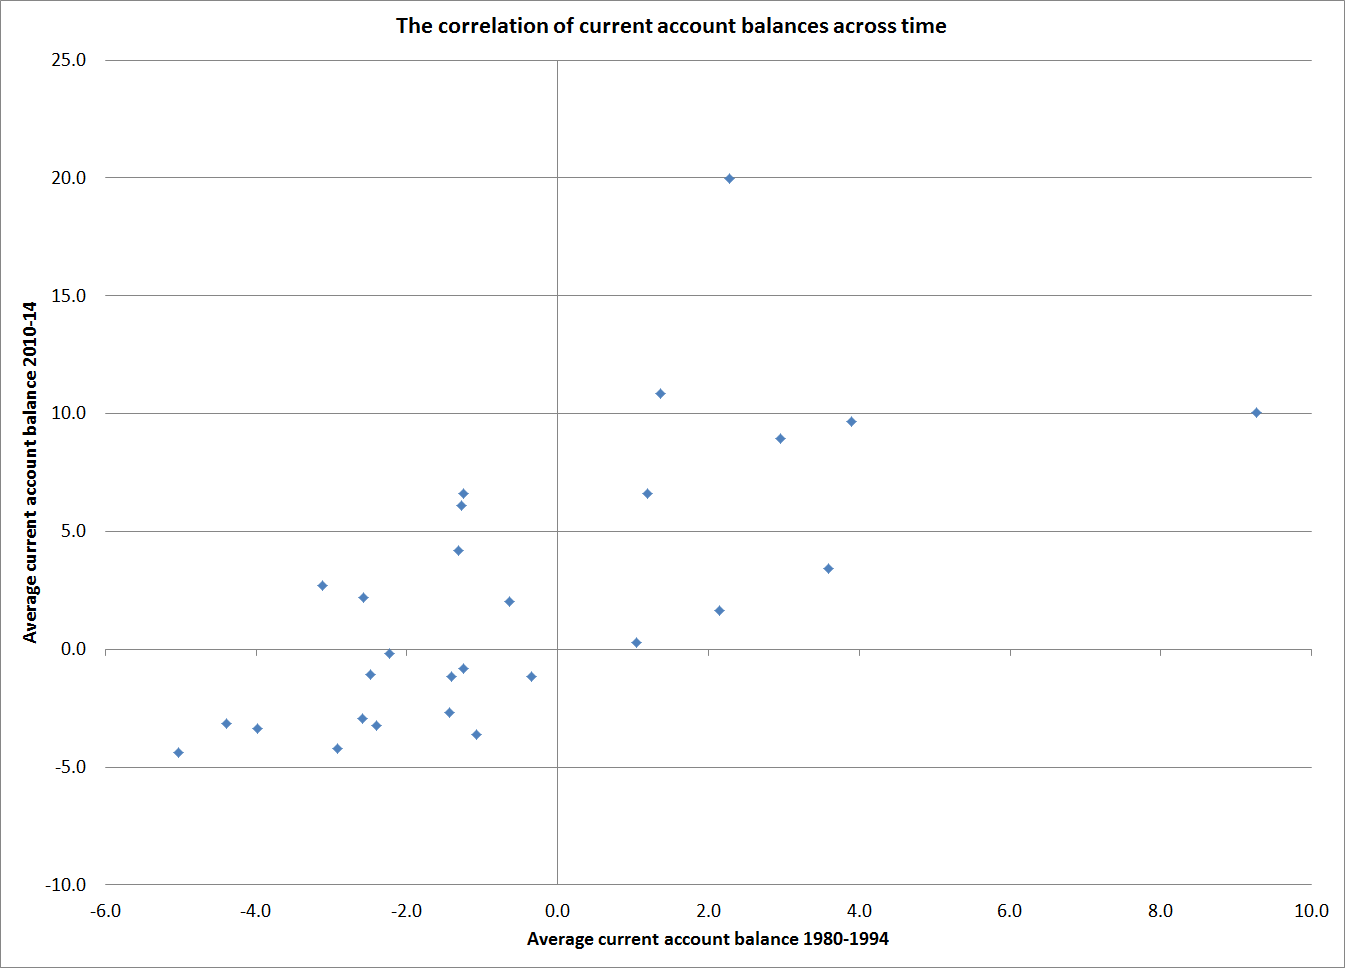
Oh, and this was the chart I first went looking for: There is a loose, but positive, relationship between each country’s average current account balances over 1980-1994 and those now.  Countries that had deficits back then tend to have deficits now, and those which had surpluses then tend to have surpluses now.

cab correlation

Time to reform Reserve Bank goverance – international perspectives

On Saturday evening I put out my paper Time to reform the governance of the Reserve Bank.  It was slightly odd timing in some ways, but the Sunday Star Times had expressed interest in giving the issue some coverage.

Many people won’t read an 18 page paper, so I’m going to highlight some of the key aspects of the paper in a series of posts this week.  The essence of my argument is that decisions around monetary policy and financial regulatory policy should not be exercised by a single unelected official, no matter how good the official.  No other advanced democracy does it that way, and New Zealand runs no other aspects of policy that way.

But I should first repeat one point.  Decisions around the governance of the Reserve Bank are a matter for the Minister of Finance and, ultimately, for Parliament, so my arguments for change are not criticisms of the Bank, but of the choices Parliament and successive ministers have made (most recently, through decisions not to change the system).    Officials operate within structures that politicians establish.  And contrary to the headline in print version of the Sunday Star Times, I am not arguing that the “RBNZ wields too much power”, rather that, given the responsibilities Parliament has assigned to the Bank, the Governor himself (any Governor) exercises too many of those powers.  What powers the Bank should, or should not have, is a topic for another day.

The Reserve Bank operates under an Act that was initially passed in 1989.  The Act has been amended quite a few times since then, mostly to add new powers and responsibilities.  The governance structure, however, has not materially changed since 1989.  In the paper, I highlighted four strands of thinking or data that influenced choices made a quarter of a century ago, and how differently things look on each of those counts today.  The governance structure chosen in 1989 was unusual, but there was a logic to it.  Things are different now.

The first of my four aspects was international experience.  In 1989, not many other central banks had effective and statutory independence in monetary policy (and not much attention was paid to financial regulation).  In 2015, there are plenty of countries to look at.  Only one other allows (as a matter of law) the central bank Governor to make interest rate decisions himself (rather than by legislated committee, with the associated checks and balances).  No other country allows a single unelected official to make decisions on both monetary policy and supervision/regulation himself.

Here is what I said, quite briefly, about international experience.

As things looked in 1989:

First, at the time only a few other central banks had (both statutory and effective) operational independence.  The ones New Zealand officials tended to be interested in were the central banks of the United States, West Germany, and Switzerland, and none of those were from the the British-based tradition of parliamentary and public sector governance.  In other words, there were few international models that could readily be adopted in New Zealand[1].   The Reserve Bank of New Zealand legislation was the first in what was a whole wave of new central banking legislation around the world over the following 10-20 years.

[1] The Reserve Bank’s own initial proposal to the Minister of Finance was based around the Australian statutory model. In that (1959) model the Reserve Bank of Australia’s Board was formally the decision-making body, but the Federal Treasurer could override the Bank so long as this was done openly (tabled in Parliament).  Appealing as the model may have looked on paper, it was a curious recommendation since, in practice, the RBA  participated actively in the public sector policy debate but ultimately did as it was told from Canberra, and the formal override powers were never –  and have never been – used.

For some discussion of this and some of the other historical material see my 1999 Reserve Bank Bulletin article “Origins and early development of the inflation target”

http://www.rbnz.govt.nz/research_and_publications/reserve_bank_bulletin/1999/1999sep62_3Reddell.pdf

And as things stand today

The fourth aspect where events have unfolded differently has been in what other countries have done in reforming their central banks and financial regulatory institutions.

Take monetary policy first.  Since 1989, there has been a substantial global shift, in both legislation and practice, to provide many more central banks with operational autonomy for monetary policy:  Among the G7 countries, central banks in the UK, Japan, and France have been given independence, and the (new) ECB has the highest level of monetary policy autonomy of any modern central bank.  Across eastern Europe (still mostly communist in 1989), and other parts of the emerging world, there have been similar trends.  But not a single advanced country, of the many to have reformed their central bank legislation, has moved to a model with a single unelected individual as decision-maker for monetary policy[2].    Despite all the attention paid to the New Zealand reforms, no country has adopted the New Zealand governance model[3].

Governance models for banking regulation/supervision in other countries are quite diverse.  In some countries many or all of these activities occur within central banks, and in other cases most of the regulatory functions occur in separate agencies.  However, I am also not aware of any advanced economy in which Parliament has delegated the major policy decisions in respect of financial supervision/regulation to a single unelected official.  A decision-making Board, advised by technical experts, is a much more common model, and in some cases many more of the policymaking powers (than in New Zealand) are reserved for ministers.

In sum, in no other advanced democratic country does a single unelected official exercise so much power in matters of monetary policy and financial regulatory policy.  Only in Canada’s case, with rather old legislation, does a single official exercise final legal power (in respect of monetary policy), and the Bank of Canada has very much more limited functions than the Reserve Bank of New Zealand.

[2] I am not aware of any developing countries having done so either, but have looked less deeply into the range of reforms in those countries.

[3] A few years ago Israel amended its central banking legislation to shift from a single decision-making Governor, to a decision-making monetary policy committee.  For a useful survey of monetary policy governance in a range of advanced countries see http://www.rbnz.govt.nz/research_and_publications/reserve_bank_bulletin/2014/2014mar77_1aldridgewood.pdf

More on why our interest rates have been so high

Last week I illustrated how much higher our long-term interest rates have been (and are) than those in other advanced countries, and set out my argument that investor concerns about the large New Zealand negative NIIP position (loosely, “the large external debt”) don’t look to have been the culprit.

In this post, I’m going to show another couple of charts, and then briefly respond to a commenter’s question.

One possible reason why New Zealand’s interest rates might sensibly have been higher than those abroad would have been if New Zealand’s rate of productivity growth had been so strong that returns to large amounts of new investment in New Zealand were very high.  Profitable business opportunities might have abounded, and businesses had been rushing to invest to take advantage of those opportunities, while households might have been rationally anticipating future much higher incomes.

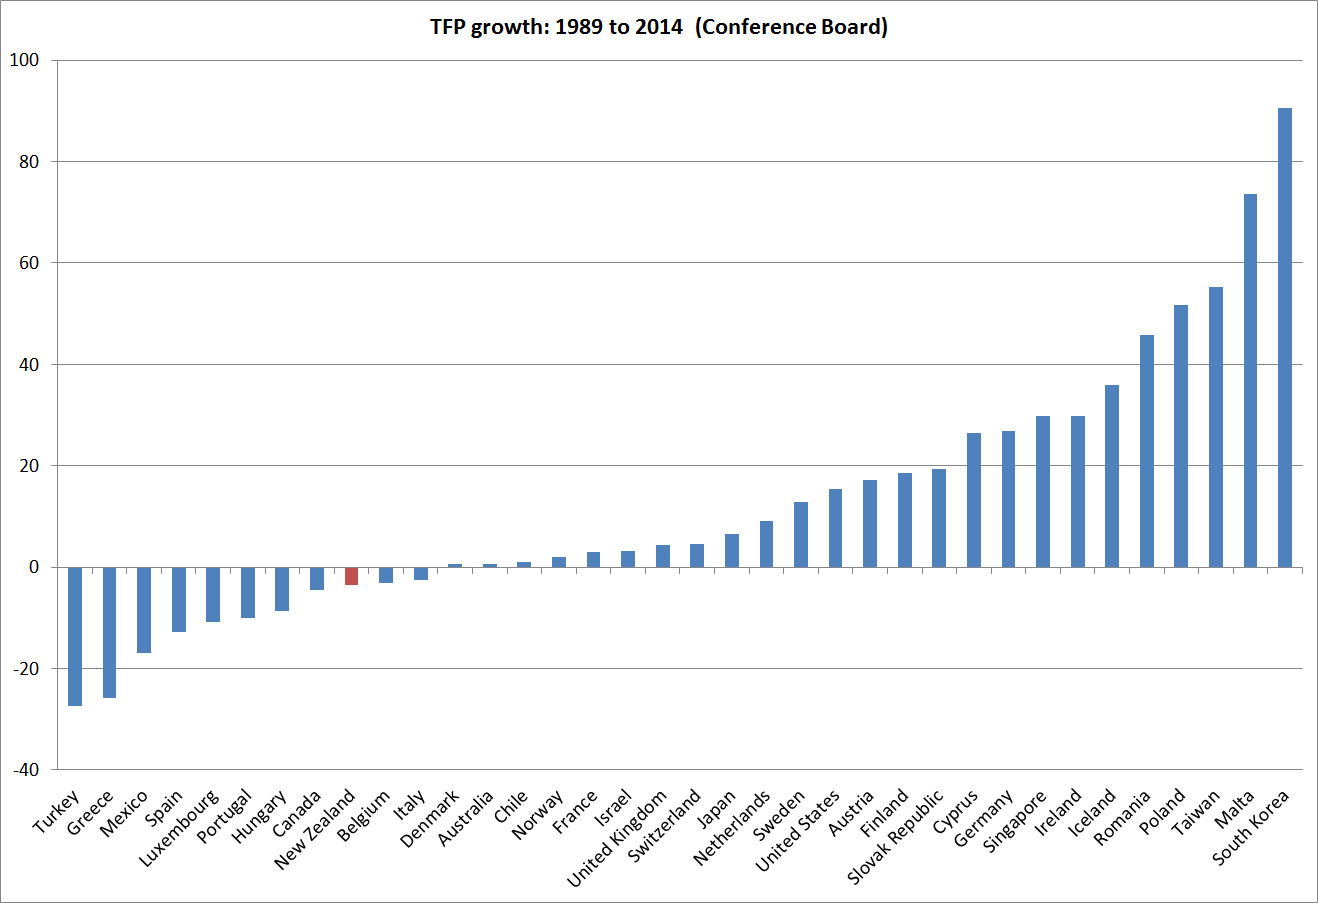
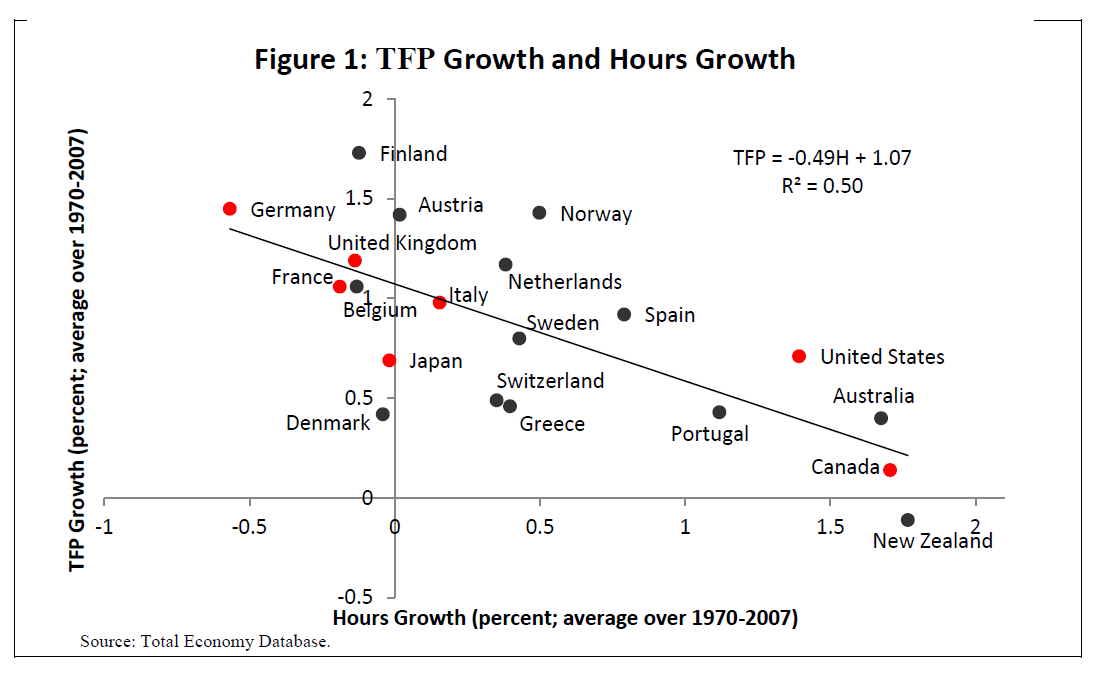
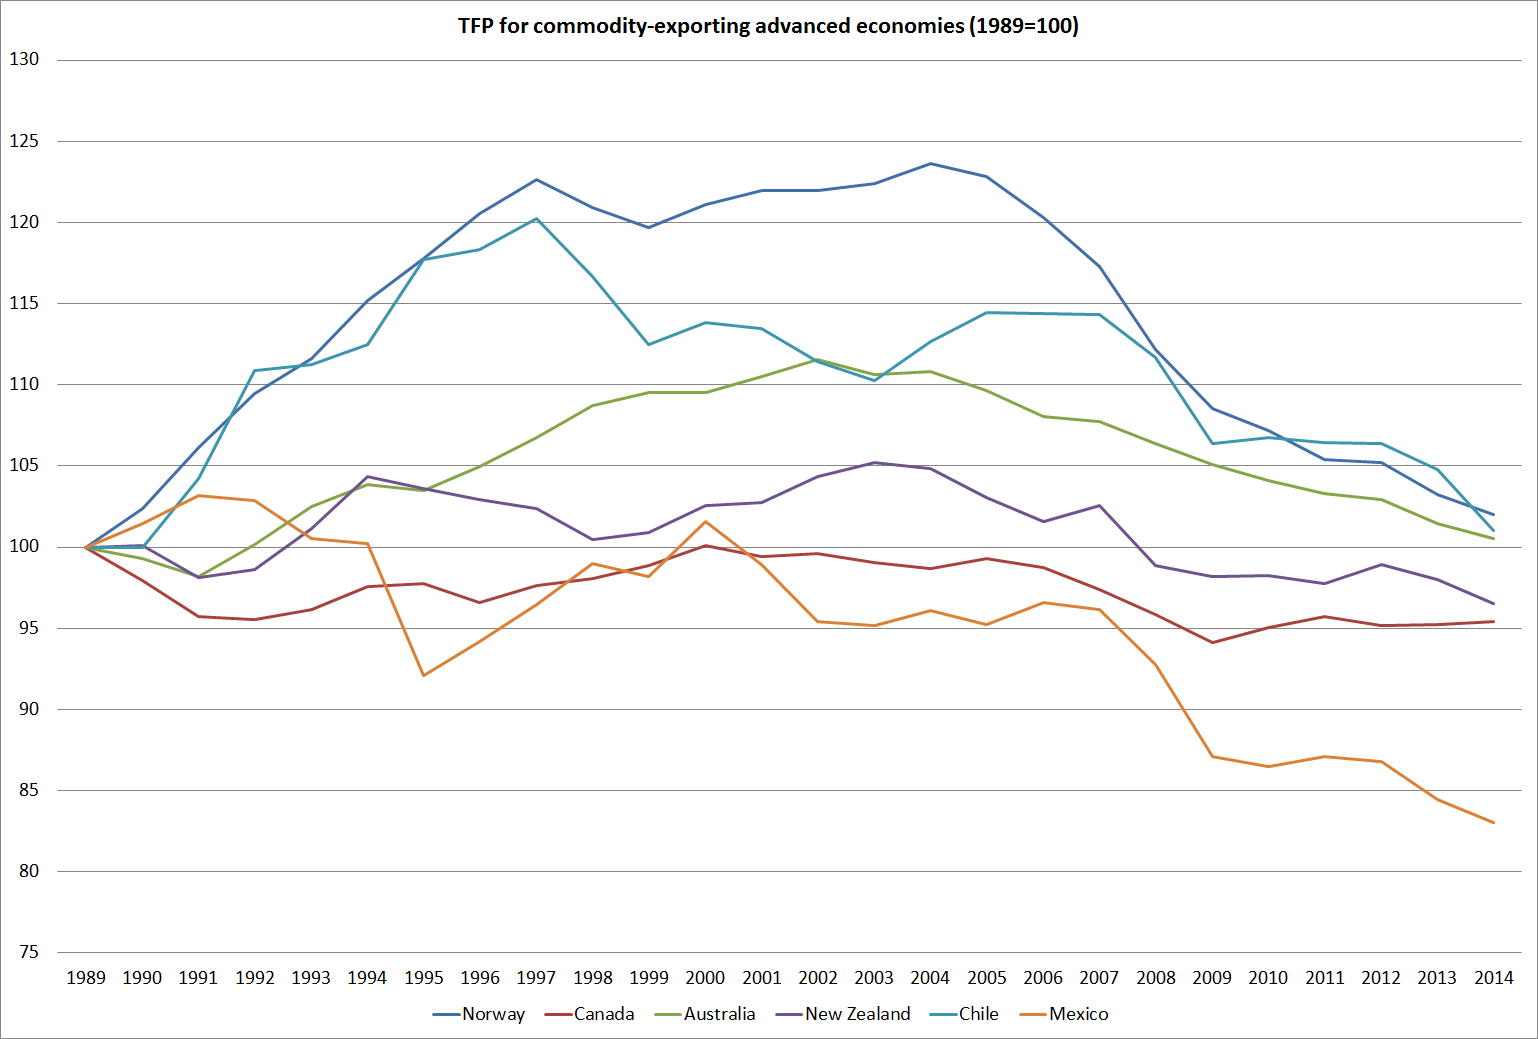
That doesn’t sound like New Zealand over the last 25 years.  In fact, our rate of business investment (as a share of GDP) has been one of the lower among OECD countries.   In recent days, I’ve shown a couple of charts drawn from the Conference Board’s TFP data.   Here is another.  For the advanced countries for which the Conference Board has estimates all the way back, it shows total estimated growth in TFP since 1989 (when the public data start). New Zealand hasn’t been the worst of these countries, but the record is pretty underwhelming.   And Greece, Spain and Portugal each look a bit worse than they deserve because there is so much excess capacity in those economies right now.

tfp since 89

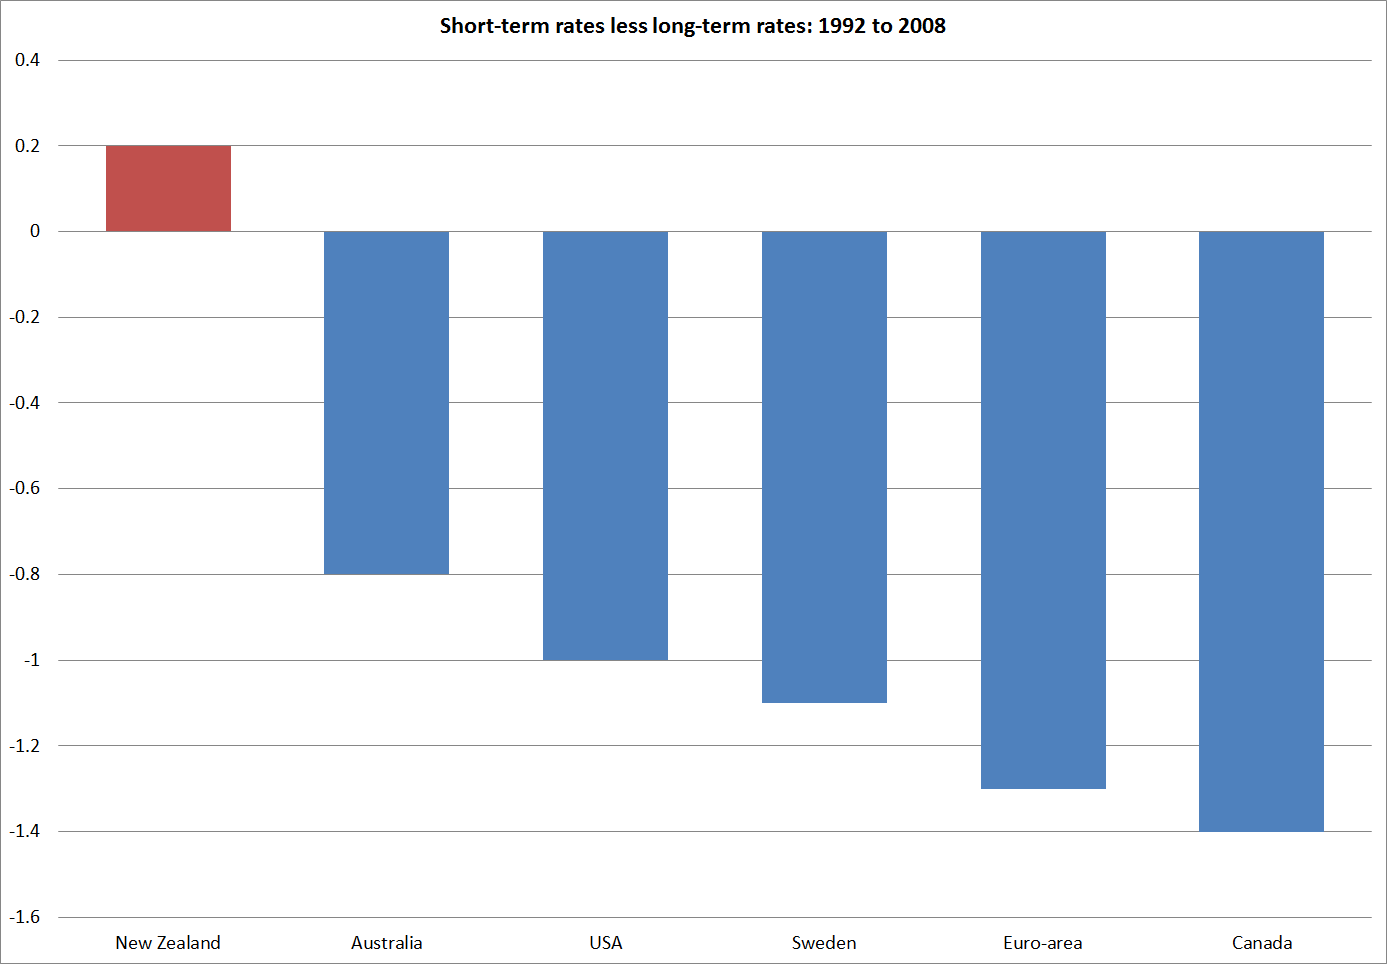
My other chart this morning is about the slope of the interest rate yield curve.  Very broadly speaking, yield curves are generally upward sloping.  That is, short-term interest rates tend to average a bit lower than long-term interest rates.  But New Zealand has been different.

As I showed the other day, long-term interest rates in New Zealand have been higher than those in other advanced countries.  But short-term interest rates have been even higher.   That is what this chart captures.  It uses OECD interest rate data,  The data aren’t ideal: the long-term interest rates are government bond rates, and the short-term rates are those on private sector securities.  But as that is so for each of the countries it shouldn’t materially complicate cross-country comparisons.

I’ve deliberately only drawn the chart to the end of 2008.  Since the near-zero lower bound on short-term nominal interest rates became an issue for an increasing range of countries, looking at the slope of the yield curve has not had the same meaning (since short-term rates can’t be cut as low as they otherwise would).

yield curve

Over that 17 year period –  in which each country had several interest rate cycles – New Zealand stood out.  If foreign investor concerns were at the heart of why interest rates were so high, long-term rates would be high relative to short-term rates (relative to what is seen in other countries).  That is the situation in Greece now.  But as the chart illustrates, in New Zealand it the other way round.  Our short-term interest rates averaged much higher relative to long-term interest rates than was the case in the other countries shown.  It suggests that we should be looking for things that drive short-term rates for our explanation as to why New Zealand interest rates have been persistently so high (again, relative to other countries’ rates).  It also nicely illustrates my observation the other day that New Zealand interest rates have long been regarded as unsustainably high, and not just by government officials and other pointy-headed analysts.  The slope of the yield curve is set in the market.   Private investors have expected our short-term interest rates to fall relative to long-term interest rates (whereas in these other countries there was no such expectation).  But those expectations have been wrong.  Persistent surprises in how long our interest rates have stayed up relative to those abroad can help explain why the exchange rate has been so persistently strong.  My former colleague, Anella Munro, covered some of this ground, in rather more technical terms, here.

And finally, some brief answers to a commenter’s question.  On Friday a commenter asked:

Michael, your analysis seems to make sense – that it’s more pressure on resources than risk premium that explains persistently high NZD interest rates
But it also raises, for me, some further questions.

My understanding is that when the NZ Government used to borrow in USD, back in the 1970s and 1980s,(when NZ was probably a worse credit risk than it is today), it did so at a rate only a small margin above the rate at which the US government borrowed. And I imagine that, today, NZ banks borrow USD at much the same rate as that at which US banks borrow. So if the only difference is in the currency of denomination (ie, the counterparties and the countries are the same) doesn’t that suggest that the explanation for the persistently high NZ interest rate has to have something to do with the currency?

Second, if there has been persistent pressure on resources, why would that not have been been closed by net imports?

Grateful for any responses you may be able to offer.

On the first question,  yes New Zealand credits borrow internationally in USD at much the same interest rates as similarly-rated borrowers from other countries do.  A AA-rated New Zealand bank is likely to pay much the same US interest rate on a bond issue as, say, a AA-rated Swedish bank might.  That certainly helps make the point that, whatever, is accounting for the differences between, say, New Zealand dollar and Swedish krone interest rates it is not the credit quality of the borrowers.    The credit ratings of our banks are as good as those anywhere.

But does that mean that it is all to do with the exchange rate?  Well, yes and no.  I would argue that it is the ability of the exchange rate to move that makes the material cross-country differences in interest rates possible[1].  Since expected risk-adjusted returns should be roughly equal across advanced countries, interest rates on New Zealand dollar assets  can only be higher than those on assets denominated in another currency (for similar quality borrowes) for any length of time, if the New Zealand dollar is expected to depreciate against that currency over time.  When the interest rate gap opens up, the New Zealand dollar tends to rise until it reaches a level that is not regarded as sustainable. At that point, the expected future deprecation more or less offsets the yield advantages.  There is an alternative story, in which the NZD is such a volatile currency that we have to pay premium interest rates to attract the foreign capital we need.  But again, if such  premia exist, and are material, they should result in a surprisingly weak exchange rate.  That hasn’t been the New Zealand story –  indeed, the only sustained period of weakness in the New Zealand exchange rate was around the turn of the century when our policy rate was quite low relative to those abroad (our OCR briefly matched the Fed funds target rate in 2000).   Such premia –  whether to do with the NIIP or a volatile exchange rate –  should tend to encourage resource-switching towards the tradables sector, in a (self-stabilising) manner that reduces future perceived vulnerability and any risk premia.   I scarcely need to point out that we’ve seen nothing of that sort over 25 years.

And just briefly, the second question was whether, if there has been persistent pressure on resources, why that would not have been closed by (net) imports.  The simple answer to that is because the economy can be thought of as made up of tradable bits and non-tradable bits.  If everything in the economy were fully tradable, then any excess demand in New Zealand could be expected to be fully met through imports.  Since tradables prices are set largely in world markets,  there would be no sustained domestic pressures on the inflation rate (and no real need for a domestic monetary policy, or our own currency).  Most of the interesting stuff arises from the fact that much of the economy is not freely tradable across borders, and tradables and non-tradables aren’t fully substitutable (I need a haircut, my mother needs rest-home care, and so on).  So when we see persistent incipient excess demand pressures, some of the pressure shows up in the current account, and some in interest rates.  As a result, despite a pretty strong government balance sheet, New Zealanders’ have run large current account deficits over the last 25 years, and we have had high interest rates relative to those in other advanced countries.  Excess demand pressures, arising domestically, largely explain both phenomena.

[1] As I illustrated in one of my very early posts, back in the 1890s, when the New Zealand government was very heavily indebted, but the exchange rate was fixed, the gaps between New Zealand and UK government bond yields were much smaller than those in recent decades.

TFP growth in commodity-exporting countries

On Friday, I took the Conference Board’s productivity data and looked at how New Zealand had done  on TFP growth relative to other advanced countries since 2007.  “Not that well” was the short answer.

The disappointing performance does need to be kept in some perspective.  New Zealand’s productivity growth has been disappointing for a long time. The Conference Board publishes TFP data only back to 1989.  However, a couple of years ago, some IMF researchers were given access to some unpublished Conference Board TFP data back to 1970.   Of the countries they looked at New Zealand had had the slowest TFP growth over the full period 1970 to 2007, and had grown more slowly than the median country in each of the four sub-periods they looked at.

tfp imf

Against that background, our slower than median TFP growth since 2007 perhaps looks slightly less discouraging  (not much less, given the decades of underperformance we might one day hope to start reversing).

As I noted on Friday, we had done a little better since 2007 than some of the other commodity-exporting advanced countries.  Commodity-exporting advanced countries have all had negative TFP growth over the last decade or so.  This chart shows TFP indexed to 100 in 1989 for each of the six commodity-exporting advanced (ie OECD member) countries.  Over 25 years, not one of them has recorded any material TFP growth (on this particular measure of TFP).  As ever, Mexico is the basket case.

tfp commodity

Weak TFP growth is not always and everywhere bad.  High commodity prices encourage producers of commodities to adopt different profit-maximising production techniques.  For example, poorer ore grades become economic to mine, but to do so takes more inputs.  That shows up as a fall in TFP, but presumably an increase in industry profitability.  In addition, massive investment programmes (as in Australia) to take advantage of high commodity prices do not boost output in the short-term (a project can take years to put in place), but involve the application of more resources to the industry.  That will also show up as lower TFP.    What about New Zealand?  We have not seen a business investment boom in response to the stronger terms of trade, but the dairy industry has altered its production processes, with more supplementary being used to produce more milk per cow.  Those choices were profitable, and sensible from the farmer’s perspective, but at the margin they involve using more inputs for each additional unit of output.  That shows up as a fall in TFP.

Quite how much these factors explain is debated , and requires a much more in-depth analysis of the national data to answer with any confidence.  But in New Zealand’s case, TFP is agriculture had flattened off well before the rise in the terms of trade, which didn’t really begin until around 2004.

tfp agric