I was reading last night a BIS paper from a couple of years ago about the current account experiences (most recently, experiences of surpluses) of China and Germany. Being a data junkie that led me on to the IMF WEO database, looking at the current account experiences of the various economies the IMF classifies as “advanced”. There are 37 of them (but as ever it is a mystery as to how San Marino makes the list, and I ignore them from here on).
The WEO database has current account data back to 1980, although for some of the former communist countries it isn’t available until the early 1990s. The range of experiences is fascinating:
• Largest deficit was 23.2 per cent of GDP (Iceland in 2006, when the aluminium smelters were going in).
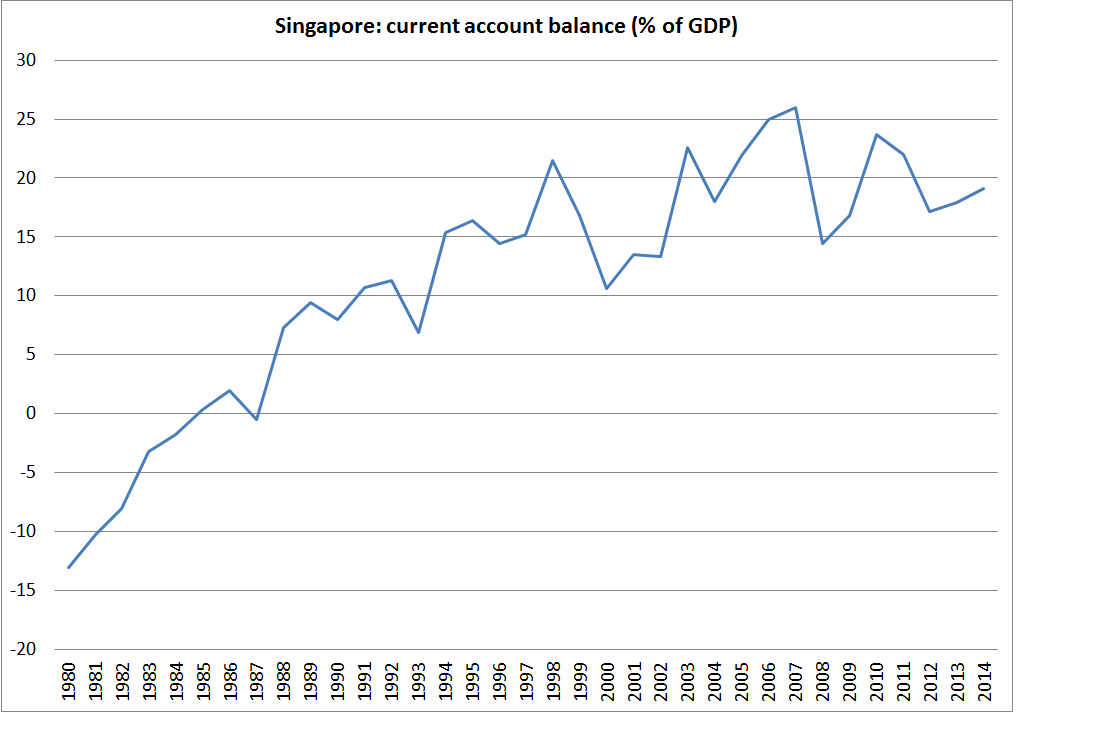
• Largest surplus was Singapore in 2007, 26.0 per cent of GDP.
• Only Luxembourg and Taiwan have not run a deficit in any year since 1980
• Only New Zealand and Australia have not once run a surplus in that period.
I was intrigued by the variability (or in many case, lack of it) of the current account balances. The current account balance is often regarded as a buffer, enabling countries to absorb shocks without disrupting a smooth(ish) path of per capita consumption. But here are the standard deviations of the current account balances (as a per cent of GDP) for each of the advanced countries since 1980 (or for the full period for which there is data for each country, but in all cases at least 20 years).

Some of the results surprised me. Australia, in particular, which has had the smallest standard deviation in its current account balances of any of these countries, over 35 years. For a country with a quite volatile terms of trade, and having a massive investment boom in the minerals sector over the last decade, that is quite remarkable. At the other end of the spectrum is Singapore. Singapore’s current account has been becoming much more volatile but the very high standard deviation also partly reflects a structural (but highly distorted) transition from some of the larger current account deficits in the sample, back in early 1980s, to the largest surpluses more recently.
A stable current account deficit is neither obviously good nor obviously bad. It depends on the shocks the particularly economy has faced. And the exchange rate regime plays a part (although of course, the choice of exchange rate regime should depend, at least in part, on the sorts of shocks the economy faces).
Only four of these 36 countries have had a floating exchange rate for the whole period since 1980 – the United States, the United Kingdom, Canada and Japan. All four show up as having had relatively stable current account balances. We could add in Switzerland – with a brief deviation from floating quite recently – and Australia, which has floated since 1983. Five of the six are then among the countries which have had the most stable current accounts, and Switzerland has been around the median. New Zealand’s experience also sits with this stable group, again despite having had some of the most volatile terms of trade of any of the advanced economies.
What about the other end of the spectrum? Of the 10 countries which have had the most volatile current account balances, only Taiwan and Norway now have floating exchange rates. Iceland’s floated freely for a while, but is now managed, as is Singapore’s.
As one would expect, it looks as though in floating exchange rate countries, the exchange rate has reduced the extent of the variability in countries’ current account balances. That isn’t surprising, and it is consistent with formal New Zealand work on how the exchange rate has responded to commodity prices and/or the terms of trade. But it might not always be a desirable feature either. Some shocks will be domestic in nature, and in principle it might be better to absorb them in greater variability in the current account rather than in the exchange rate. And if the terms of trade are volatile, there might also be a case for allowing more of the variability into the current account, rather than immediately seeing the real exchange rate move against producers in all other tradables sectors (eg if dairy prices soar, a higher exchange rate might smooth the effects on dairy farmers, but could greatly complicate life for other tradables sector producers). If the terms of trade shock is lasting, the real exchange rate will rise eventually, but if not then perhaps less variability in the exchange rate might have some advantages.
Simple charts like this don’t lead to policy conclusions. After all, one of the big challenges firms (and households and governments/central banks) face is knowing which shocks are temporary and which are permanent. We need a regime that is robust to our uncertainty about the shocks. And any consideration of a more-fixed exchange rate for New Zealand would run into the complication of the long-term differential between our interest rates and those abroad. (At the extreme, a fixed exchange rate would equalise nominal interest rates, but wouldn’t itself change the conditions that had required the difference in real interest rates in the first place).
I’ve tended to be a defender and advocate of the floating exchange rate regime for New Zealand – not necessarily as a first best option, but as better than any of the feasible (and freedom-respecting) alternatives for the time being. On the whole, I still think that is probably the right conclusion, but I do find it a little surprising, and perhaps a little troubling, that New Zealand has had one of least variable current account balances among advanced economies in the last 35 years. The positive dimension of that is that New Zealand never faced a serious external funding crisis in that time (unlike the Baltics, or Korea, or Greece or Portugal). But it hasn’t exactly been an untroubled time for New Zealand – it is a period that encompasses Think Big, huge swings in fiscal policy, credit booms and one bust, financial crisis, considerable variability in the terms of trade, and so on.
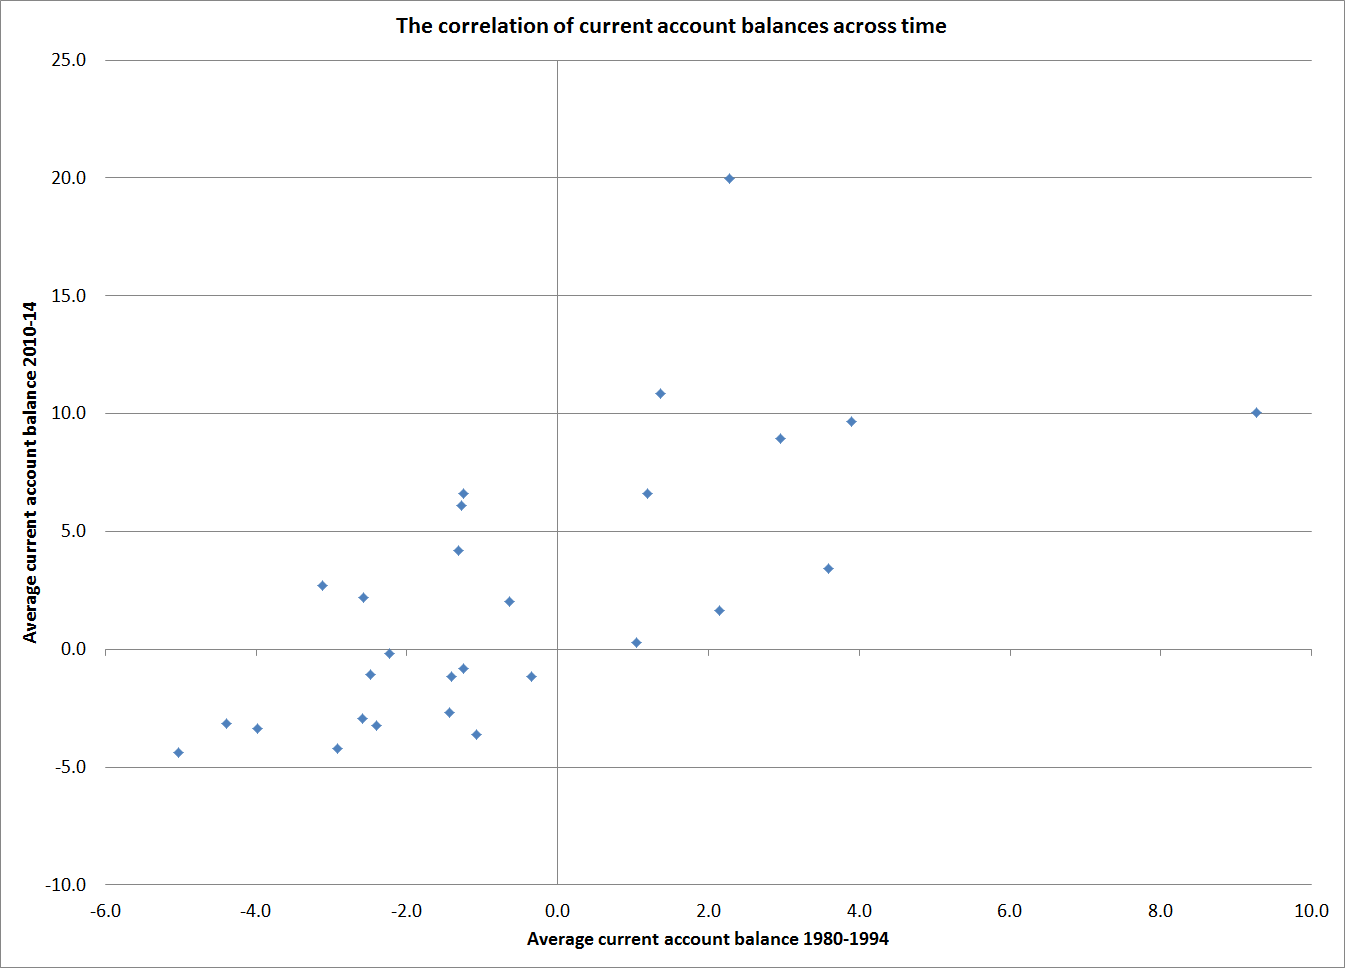
Oh, and this was the chart I first went looking for: There is a loose, but positive, relationship between each country’s average current account balances over 1980-1994 and those now. Countries that had deficits back then tend to have deficits now, and those which had surpluses then tend to have surpluses now.

Stability of Australian current account helped by foreign ownership of mining firms, so somewhat insulated from terms of trade swings. But I agree that the mining investment boom should have made a dent in it.
LikeLike
Yes, fair point. But then the exchange rate is still very responsive to the TOT, and has been for a long time.
LikeLike