Why New Zealand languishes

Back in February when no one was aware of this blog, and I was just trying to work out how to use the software, I posted the entry below.

Why New Zealand languishes

More people need more capital

The government’s Budget Policy Statement and the Treasury’s updated forecasts were released yesterday.  I’m not going to comment on the Treasury forecasts in any detail –  it doesn’t help that Treasury produces the only PDFs I’ve encountered anywhere that somehow my computer won’t open – although I’d happily bet against their apparent view that the neutral nominal interest rate is still 4.5 per cent and that inflation is going to quickly get back to the middle of the target range.

But two policy initiatives warranted brief comment.  First, the resumption of contributions to the New Zealand Superannuation Fund (NZSF) is being deferred again.  Leveraged speculative investment funds don’t seem a natural activity for governments, and my only disappointment is that the NZSF isn’t being dissolved.  As Grant Robertson put it, the further delay will put pressure on future governments to review the age of eligibility for NZS etc.  Precisely.

The second initiative was the increase in the capital allowance by $1 billion for the coming financial year.   I’m rather sceptical of the quality of much of the government’s capital spending (Transmission Gully, Kiwirail) but this increase shouldn’t be surprising.  There are a lot more people in New Zealand than was forecast a few years ago, and people need places to live, schools, road, hospitals, shops, factories etc.  A significant chunk of the total capital stock is owned by the government (almost a sixth just by central government) and all else equal, if we have a lot more people more needs to be spent to provide the associated capital stock. That is true in the private sector –  houses, shops, factories, offices –  and in the public sector.   The latest official capital stock data show a net (of depreciation) central government capital stock of around $110 billion.  The population shock in the last few years will have been at least 1 per cent, so we shouldn’t be surprised by the need for additional public sector capital spending.  It shouldn’t be seen as some sort of discretionary fiscal stimulus or (according to the odd argument Graeme Wheeler ran last week) as a way of easing inflation pressures.  It is just something made necessary by the surprisingly strong population.  It is a concrete illustration of how demand effects from immigration surprises typically exceed supply effects in the short-run, again contrary to the new Reserve Bank view.

The net capital stock is almost three times annual GDP: each new worker needs the equivalent of three years production in additional capital (whether housing or factories or whatever)   New workers add to labour supply, of course but of themselves they don’t directly add to the capital stock.  And, as noted, the required addition to the capital stock is large relative to the additional new labour supply in the first year  –  typically several multiples of it.  And we have a new wave of migrants each year, each requiring further additions to the capital stock.    Real resources have to be devoted to putting in place that capital stock (we don’t simply import completed houses, roads, schools or office blocks).

None of this should be particularly controversial.  If a country’s population is growing faster then, all else equal, the amount (share of GDP) that has to be devoted to investment (capital stock formation) should tend to be larger than otherwise.  An acceleration of population growth should be expected to boost investment, and countries with faster population growth rates might be expected to have higher investment/GDP ratios than countries with slower population growth.  The differences should be quite stark: a country with 1 per cent per annum  population growth might be expected to devote around 3 percentage points of GDP more to investment than the average country with zero population growth.  That is just enough more so that the growth in the population would not adversely affect the capital stock per capita.    It is never going to be a precise relationship, since there is always a lot else going on.  And some countries have patterns of production that are less capital-intensive than others (eg the UK’s financial services industries are probably less capital intensive than Germany’s heavy manufacturing).

But, in fact, the relationship doesn’t look to have been there at all, either historically or more recently.

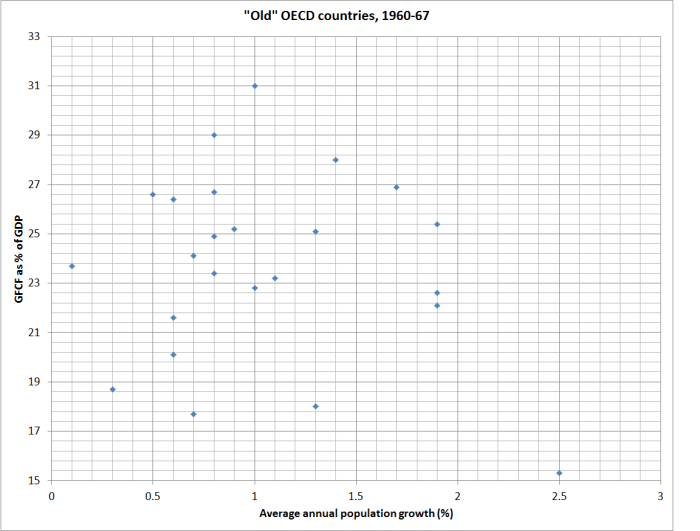
The OECD volume I had down the other day also had data for average annual population growth and gross fixed capital formation for the “old” OECD countries for the 1960 to 1967 period.  Here is the scatter plot, with a dot for each country.

gfcf and gdp old oecd 1960s

There is basically no relationship at all, and certainly nothing as strong as 3 percentage points more of GDP in investment for each 1 percentage point faster annual population growth.  It looks as though, across countries,, more rapid population growth tends to crowd out some investment growth. And since everyone needs to live somewhere, and governments have statutory command over resources and fewer market disciplines, the most likely investment to be crowded out is business investment.

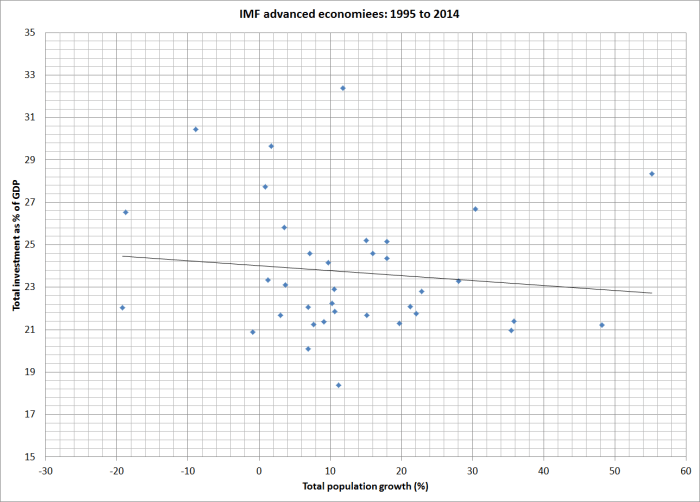
The 1960s is a long time ago.  So I also downloaded the same data from the IMF WEO database for each of the advanced countries for the last 20 years (1995 to 2014).  Here is the relationship between total population growth and the investment share of GDP.  The relationship is basically non-existent, and if anything (not statistically significantly) the relationship is the wrong way round.

gfcf to gdp 95 to 14

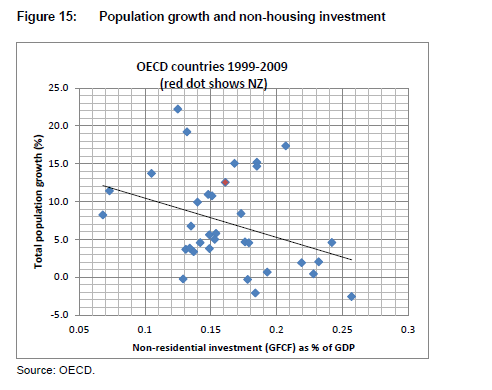
I didn’t have the energy to track down updated non-housing investment data, but I’ve shown previously that there has been a negative relationship between non-housing investment and the rate of population growth across advanced economies.

population and non-housing investment

According to the conventional story, this just should not be happening.  After all, our population growth is now largely the result of immigration policy, and high rates of skilled immigration are supposed to spark innovation, skills transfer, and new investment not just to maintain per capita capital stock but to capture the gains to the rest of us from the influx of capable people.  In fact, across countries and –  as far as we can tell –  across time faster population growth tends to squeeze out some business investment in the productive sectors.  Why?

There are two ways of articulating the story.  Strong demand, reflecting the desire to boost the capital stock to keep pace with the  population growth, tends to puts upward pressure on domestic interest rates (relative to those elsewhere).  That crowds out some of the desired investment (it just doesn’t happen), especially the return-sensitive business investment. It also tends to raise the exchange rate, providing a double-whammy adverse effect on investment in the tradables sector.     Growing per capita exports becomes harder.

The other way of looking at it, is to look at the relative prices of tradables and non-tradables.  Tradables prices are determined in world markets, and domestic demand doesn’t really affect them. But non-tradables prices are set in the domestic economy reflecting domestic demand (and underlying productivity growth).  High domestic demand associated with rapid population growth tends to raise the prices of non-tradables, and wages, while leaving tradables prices unchanged.  That makes it relatively more attractive to produce for the non-tradables sector, all the more so since all tradables production uses (now more expensive) non-tradable inputs.  External competitiveness is eroded and investment in non-tradables replaces, to some extent, investment in tradables.

Which brings us back to yesterday’s announcement.  The additional government capital expenditure was probably necessary, but at the margin, it will tend to be to squeeze out some other capital investment elsewhere in the economy.  The cross-country perspectives suggest that fast population growth will come at the expense of maintaining the per capita capital stock, and make it harder for New Zealanders to keep up, or close the gap on, the incomes of people in other advanced countries.

None of this is new.  It was the perspective of able New Zealand economists looking back on the post-war New Zealand experience.  Here, for example, is Professor Gary Hawke, writing in the last full economic history of New Zealand in the early 1980s.

the economic consensus is strong one. In essence it simply observes that productivity was highest in agriculture whereas population growth was catered for by the relative expansion of other activities. Population growth thus fostered expansion of relatively low-productivity activities and therefore tended to reduce average per capita income. The key assumption is that sectoral productivities would not have been even more unfavourable in the absence of population growth, and discussion of later chapters shows that assumption to be reasonable….Perhaps if less importance had been attached to full employment, or if a different exchange rate had been implemented, the sectoral productivity trends could have been changed. Perhaps so, but population growth made it more rather than less difficult to effect those changes in policy, even if they had been desired, and, in terms in which it was debated, the economic case against population growth in the post-war economy was always a strong one.

It still is in 21st century New Zealand.


Is the Fed risking a policy reversal?

The Wall Street Journal ran an article yesterday by Jon Hilsenrath about this week’s (widely-expected) increase in the Federal funds rate target.  So extraordinary have the times been that many Americans will have gone almost a quarter of their working life and never experienced an increase in official interest rates.

Hilsenrath is generally regarded as a well-briefed journalist, and writes intelligently about the Federal Reserve and related issues.  This article seems to have two separate points to it.  The first is the suggestion that Federal Reserve officials themselves are worried that “they’ll end up right back at zero”.  And the second is a report of a new WSJ poll of economists about the outlook for the Fed funds target rate over the next five years.

Taking the poll first, 58 per cent of the surveyed economists reportedly expect that the Fed funds target rate will be back at zero in the next five years, and 16 per cent think the target will have been taken negative.

58 per cent seemed, if anything, a surprisingly low percentage, and not telling us very much.  After all, most policy rate cycles seem to have been only around five to seven years.  In the US, the Fed started raising rates in February 1994 and was back where it started by September 2001.  And then it started raising rates in June 2004 and was back where it started by October 2008.

In Australia, the RBA started raising rates in August 1994 and was back to the same level by September 2001.  It started again in November 2003, and was back where it started by December 2008, and the rate cycle that started in October 2009 was unwound by December 2012.

And what about New Zealand (abstracting from the very quickly reversed small cycles)?

Start                                      End

March 1994                         November 1998

November 1999                November 2001

January 2004                      December 2008

In New Zealand we never quite got to a cycle even as long as five years.    So if I was ever asked, and without looking at a single piece of data, I’d say there was always a pretty good chance that policy rate tightening cycles would be fully unwound within five years.

Some will argue that the current US position is different, in that it is starting from such a low rate.  Perhaps, but the Fed funds target was 1 per cent before the previous cycle got underway.  Neutral rates seem to have been declining around the world, and there is little sign that the US is an exception to that.  And on the other hand, as the WSJ article notes, the US recovery has now been underway for six years, so it is a long way into the recovery (weak as it has been) for the tightening cycle to be starting.

So if Fed officials had only this sort of five year horizon in mind in worrying about the possibility of reversal, it probably shouldn’t be newsworthy.  Shocks will inevitably happen, and there is a good chance that even if a tightening is warranted now, it won’t be needed in several years’ time.

But it would be more newsworthy if some significant chunk of the FOMC were worried that the US might experience the sort of policy reversal all too many advanced countries have had in the last few years.  The WSJ article lists a number of policy reversals in the period since the 2008/09 recession , including that of the ECB and those of smaller countries such as Sweden and Israel.  Mercifully, and perhaps reflecting the extent to which New Zealand has dropped under the radar in recent years, they don’t highlight New Zealand –  the only advanced country to have had two quick policy reversals since 2008/09.  I wrote about the various policy reversals a few months ago (here and here).

All too many central banks have misjudged the extent of the inflationary pressures in their economies, tightening before the evidence was in that inflation was really increasing.  Acting pre-emptively probably made sense in the early post-recession period –  forecast-based policy has, after all, been the mantra.  But it has become harder to justify as the years went by, and inflation continued to remain surprisingly weak (at any given interest rate) in most countries.  In New Zealand, forecast-based policies have probably ended up increasing the variability of interest rates.

Perhaps the US is different, and they really will be able to sustain not just a single Fed funds rate increase but a succession of them (of the sort apparently envisaged by many FOMC members in the dot chart).  But it isn’t clear to me why the US should be different.  It has been a pretty anaemic recovery, and if the unemployment rate has fallen a long way, the employment rate is still very subdued.  And the real exchange rate has risen a lot.  It isn’t that high by historical standards, but a 15 per cent increase in the real exchange rate over the last 18 months or so makes a difference even in a country where exports are only 14 per cent of GDP (tradables are a much larger share).

In this climate, I’d have thought that the inflation numbers themselves should be a key guide.  But even there, there is little obvious reason to think higher interest rates are warranted.  The Fed chooses to target inflation as measured by the deflator for personal consumption expenditure (PCE) –  as distinct from the CPI.  Headline annual PCE inflation is 0.2 per cent (those weak petrol prices, which affect US inflation more than NZ inflation, because taxes are a much lower share of petrol prices).  PCE inflation excluding food and energy has been 1.3 per cent over the last year –  an inflation rate unchanged now for many months.  And the trimmed mean PCE inflation rate has also been steady, at 1.7 per cent.  The Fed’s chosen target is 2 per cent inflation.  Perhaps one could argue that inflation is not too far from the target, especially if one chose to emphasis the trimmed mean measure, but it is not getting any closer.  Given the state of knowledge, and the precedents from other countries, it seems quite likely to be premature to act now.

pce

Which raises the question of why are they (apparently) moving now?  Perhaps the majority of the FOMC is just falling into the same trap other central banks (including the Reserve Bank) have done, expecting a resurgence of inflation (even though there is little or no sign of it yet).  Perhaps it is the low unemployment rate?    But is it not plausible that the NAIRU could be moving lower again?  Former senior Fed official Vince Reinhart has an interesting commentary out, in which he suggests that part of the motivation for a move now might be a desire by Janet Yellen to establish credibility as someone sufficiently tough and willing to move, that she can afford to make the case later for moving only very gradually.  Perhaps there is something to that story, but I hope not.  My impression is that central bankers usually play things fairly straight, reacting to the data as they read it (whether reading it correctly or otherwise) because any other approach is a dangerous game. Of course, American politics is different, and there is a lot of suspicion of the Fed on the right.  But in an anaemic recovery, when so many other central bankers have tightened and then had to reverse themselves, and in a global economy where the threats seem to be growing rather than dissipating, and where (for example) commodity prices are moving ever lower, adopting a strategy that might jeopardise the US recovery out of some desire to “establish credentials” would seem particularly inappropriate.   Within the terms of their own articulation of their mandate, there is little sign that the Fed has had monetary policy too loose in the last seven years –  Scott Sumner and others make a reasonable argument that they were too slow to ease at the start –  and no sign that monetary policy is too loose now.  None of us might adequately understand why interest rates are as low as they are, but that isn’t a basis for a central bank to try to end that on the basis of not much more than a mental model that “in a sensible well-functioning economy, interest rates really should be higher than they are now”.

And all that is before the growing signs of renewed financial fragility and risk.  I found this chart that I saw in a newsletter yesterday somewhat sobering.

defaults

Thoughts prompted by an old book

It is a good rule after reading a new book, never to allow yourself another new one till you have read an old one in between.”       C S Lewis

Over the weekend I was reading the 2nd edition of Portrait of a Modern Mixed Economy: New Zealand, published in 1966.  The original Portrait, by Professor (at Canterbury) C  Westrate had been published in 1959, and the second edition was a simpler, shorter, updated version completed by Westrate’s son after his father’s early death.  I’m fascinated by anything on New Zealand and its economy from this period, because it was a time when New Zealand was widely regarded as still having some of the highest material living standards anywhere in the world.  There were already intimations of uncomfortably slow productivity growth (relative to other advanced economies) appearing in official and quasi-official reports, but no real hint of the deep decline in our relative living standards that was to follow.

To read such a book is also to be reminded just how remarkable the unemployment record was.    For all the distortions that went with it, there was something impressive about sustaining an unemployment rate at around 1 per cent or less for decades (on the Census measure, which approximates the current HLFS approach).  And they weren’t, mostly, make-work public enterprise jobs.

Of course, the distortions were numerous.  Westrate quotes data that in 1964 government consumer subsidies were equivalent to 35 per cent of the retail price for butter, 40 per cent for milk, 55 per cent for bread and  65 per cent for flour.  The subsidies were a bit lower than they’d been a decade earlier, but it was to be another couple of decades before they were completely removed.  And while I’d come across the (statutory) raspberry marketing body previously, I hadn’t known that we had a monopolistic Citrus Marketing Authority, which controlled all imports and the sale of all local production.  Odd as those measures now seem, I wonder what of the current regulatory state people in 2066 will look back on in puzzlement?  How could they, our grandchildren may wonder.

In the 1960s, the Reserve Bank –  and monetary policy –  was firmly under the control of the government of the day.  But I was reminded of the way that wage-setting was then officially delegated to unelected bureaucrats – in this case, the Arbitration Court where employer and employee representatives usually neutralised each other, leaving key decisions on basic wage structures to a single judge.  As Westrate notes, it is debatable quite how much sustained impact the Court had, since labour market fundamentals matter and the Court only set minima.  But in some respects the same could be said for the Reserve Bank: interest rates are ultimately set by fundamental forces shaping savings and investment preferences, but the administrative choices of officials matter in the shorter-term.

But what I really wanted to comment on today was the discussion of New Zealand’s external trade.

Westrate notes that exports accounted for a higher share of national income than in most trading countries –  “consistently near the top of the list”.  So far, so conventional –  I wrote a while ago about Condliffe’s observation a few years earlier that New Zealand in the 1950s had had among the highest per capita exports in the world.  But what caught my eye was that Westrate introduced a explicit discussion of how external trade might be even more important in New Zealand than it appeared, because of the high share of domestic value-added in New Zealand exports, mostly “agrarian commodities”.  Westrate was Dutch and had previously been a professor at one of the Dutch universities, and he notes that although the Netherlands, for example, has a higher export share of its economy than New Zealand “it is known that  exports from the Netherlands contain a good deal of foreign value.”  As he notes, the data didn’t exist to do the calculations, and indeed it is only in the last few years that the OECD and WTO have started producing good cross-country data in this area.  The story about the high domestic value-added share in New Zealand’s gross exports is now conventional wisdom, but probably wasn’t in the 1960s.

Having said that, if the story that New Zealand was one of the countries with the highest trade share in the world had once been true –  and quite possibly it was in the 1920s –  it doesn’t look as though it was in fact true by the time Westrate was writing –  which should not be too surprising given the heavy cloak of industrial protection New Zealand had put in place, that tended to reduce both the import and export shares of our economy.  Books and official reports from the period often compare New Zealand with the US, UK, Australia, Canada, France and Germany.  And for many purposes, comparisons with those countries might have been quite enlightening.  But when it comes to foreign trade, it is now well-recognised that large countries typically do less external trade as a share of GDP than the small ones do.  There are more markets, and more suppliers, at home than is likely to be the case for a small country.  When a large country has a very large trade share –  China pre 2009 and Germany now – it is often a sign of other imbalances.

Finding comparable long-term historical data is always a bit of a challenge.  But I had on my shelves a 1990 OECD compilation volume of historical statistics, with data on a wider range of variables (including exports of goods and services as a share of GDP) for 1960 for the “old” OECD countries.

For New Zealand exports as a share of GDP in 1960 were 22 per cent.

For the smaller Europeans (Netherlands and smaller), the proportions were:

Exports (good and services) as a % of GDP, 1960
Austria 24.3
Belgium 38.4
Denmark 32.2
Finland 22.5
Greece 9.1
Iceland 44.3
Ireland 31.8
Luxembourg 86.7
Netherlands 47.7
Norway 41.3
Portugal 17.5
Sweden 22.9
Switzerland 29.3

With a median of 31.8 per cent. (By contrast, for the G7 countries, the median was 14.5 per cent.)

As Westrate noted, we don’t have the data to know what the share of domestic value-added was in exports in 1960.  The first OECD date are for 1995.  But even by then, when domestic value-added of New Zealand’s exports was 83.2 per cent, the median for those smaller European countries was 76.4 per cent – lower than New Zealand, but not an order of magnitude different.  If –  heroically, and really only illustratively –  the same value-added shares had prevailed in 1960s, New Zealand’s export value-added would have been around 18 per cent of GDP in 1960, while the median European country would have been around 23 per cent of GDP

What of the present?  The latest OECD-WTO value-added data are for 2011 (I wrote about them here).  Over the intervening 16 years, the domestic value-added share of New Zealand’s exports barely changed, while the median of that same sample of smaller European countries had fallen sharply, to 67.3 per cent, as the importance of global value chains (especially within continental Europe) has increased sharply.

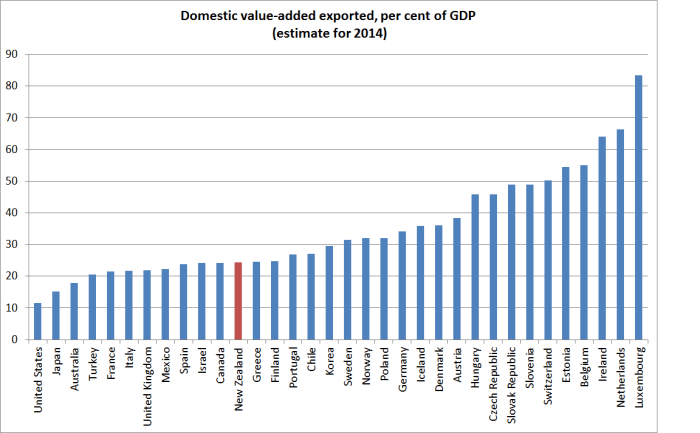
For the more recent period, we have much larger set of OECD countries to look at (many of them also quite small).  The data for exports as a share of GDP is available for 2014.  If we apply the 2011 domestic value-added share of exports, to the 2014 data on total exports, we get this pattern of domestic value-added in exports as a share of GDP.

domestic value add all oecd

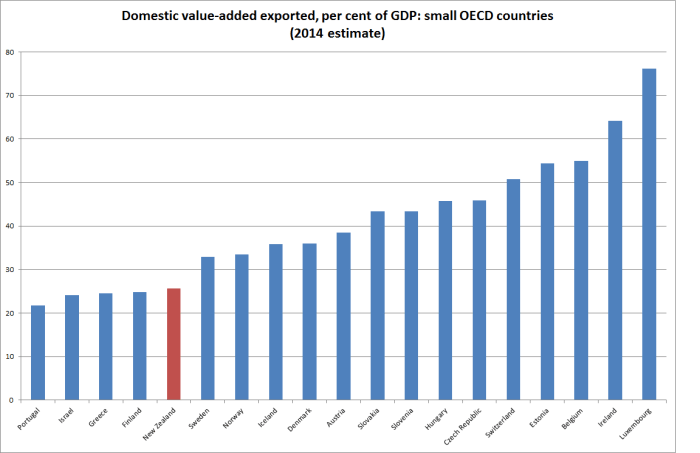
But what about “small” countries?  If we rank the OECD countries, there is a natural break between Belgium with 11 million people and the Netherlands with 17 million.  Here is the chart for the 19 OECD countries with populations of 11 million people or fewer (nothing would be altered by including the two countries with around 17 million).

domestic value added small oecd

New Zealand isn’t the lowest ranking country on the chart, but those that are worse aren’t generally ones we would want to emulate.  Greece and Portugal speak for themselves –  and, indeed, the export shares for those countries are flattered by the weakness of the domestic economy at present.  Israel has had as poor a productivity record (and as modest per capita GDP) as New Zealand.  Finland had been performing well until 2008, but since then it has been one of the worst-performing economies in Europe, and its exports as a share of GDP have fallen sharply.

A customary response to the New Zealand data is to point out that remote countries tend to do less international trade that less remote ones.  By almost any measure, New Zealand is among the most remote of these countries.    But if trade with the rest of the world is a significant part of how smaller countries get and stay rich –  maximising the opportunities created by their ideas, institutions and natural resources –  shouldn’t we be more bothered about the implications of our remoteness?   New Zealand just isn’t a natural place to build lots of strong businesses, unlike – say – Belgium, Denmark, Austria or Slovakia.  That doesn’t mean such businesses can’t be built at all here, but it is an uphill battle.

And it has probably become more of an uphill battle in the last 20 to 25 years.  Gross exports have risen hugely among many of the European countries since 1995, but so has domestic value-added from exports (all as shares of GDP).  And it isn’t just the former communist countries emerging –  in Denmark export value-added as a share of GDP has risen by 7 percentage points,  and in Austria the increase has been 12 percentage goods.  In New Zealand, by contrast, there has been almost no change.  This isn’t some mercantilist story in which exports are good for their own sake –  but finding more markets for more stuff, enables people at home to import and consume more of other stuff.

As I’ve noted before, it looks as though New Zealanders have been responding – for decades now –  by moving to other countries, especially Australia, where the income prospects have been perceived as stronger.  But our governments have wrong-headedly sought to bring in lots more people, to more than replace those who are leaving.  Somewhat to my surprise, the quality of many of those people now seems questionable at best –  recall the most popular occupations for skilled migrants.  But the real issue should probably be whether continuing to aggressively pursue a larger population, as matter of policy, makes sense in a country that is so remote, and where not even the soil is that naturally fertile.  It is, in many respects, a nice place to live, but the ability to generate top-notch advanced country incomes for even the current population must be seriously questioned.  To do so, a small country needs to be able sell a lot more of it makes to the rest of the world than has New Zealand has been managing –  in the 1960s or now.

The government’s exports target rather crudely recognises the issue, but they have no credible economic strategy that might bring about such a transformation.

(And while climate change is not an issue that I pay much attention to, less rapid population growth through reduced immigration targets might also be a rather cheaper way of meeting somewhat arbitrary emissions targets.)

A hawkish easing and a dovish tightening

A financial markets participant who lost money in the market moves following Thursday’s Monetary Policy Statement got in touch yesterday to ask where I ranked Thursday “hawkish easing” –  an OCR cut that actually tightened monetary conditions by prompting a 1.5 per cent increase in the exchange rate –  among policy mistakes.

He may well have had an international context in mind, but my mind went back to various episodes in New Zealand since I got closely involved in 1987.  As I pointed out to my correspondent, even if one counted Thursday as a mistake –  and I certainly thought the policy stance was wrong, and the communications pretty unconvincing –  there had been many worse over the years.  Making mistakes, either  in communications on the day or in the wider stance, is pretty much inevitable in the sort of discretionary monetary policy management most countries adopt.  Unfortunately the Reserve Bank of New Zealand seems to have more black marks against its name than most.  One could think of the MCI debacle in the late 1990s –  which led directly to the troublesome clause 4b of the PTA – or the two lots of policy reversals (tightenings that had to be unwound) since 2010.   Misjudging the overall appropriate stance of policy matters more (whether too tight or too loose) but it takes time for those errors to become apparent.  My mind went back specifically to a “hawkish easing” fifteen years ago, when the market’s adverse verdict was immediately clear.

By May 2000, the Reserve Bank had been tightening monetary policy quite aggressively for some time.  It was the first ever OCR cycle –  the OCR was only introduced in early 1999, and we’d been raising the OCR by 50 basis points at a time.    The OCR was at 6 per cent, the same as the Fed funds target rate –  which itself was raised to 6.5 per cent on the morning of our MPS.

The May 2000 Monetary Policy Statement was released on 17 May.  We raised the OCR by another 50 basis points to 6.5 per cent, and the projections foreshadowed the likelihood of another 75 basis points of increases over the next few quarters.

The exchange rate had been relatively low for some time by then (around 58 on the TWI as it is currently measured, but 54-55 on the index as it then was).    When returns on USD assets were basically equal to those in the NZD, that weakness was hardly surprising (it is the example I use to illustrate why I’m pretty sure that if our OCR ever gets cut to near-zero our exchange rate will have fallen a long way).

Running into the MPS release, the TWI had been weakening a little.  I was deputy head of the Financial Markets Department at the time, and I recorded in my diary the night before the release that we were “likely to see the TWI lower” following the release.

In those days, we met at 7:30am on the morning of the release, to give final advice to the Governor and enable him to confirm his OCR decision.   It was to be stressful day, but my diary records that at the meeting “just as well everyone, with more or less enthusiasm, on the OCR group endorsed 50bps –  and at our morning meeting at 7:30 no one expressed even the least qualms”.

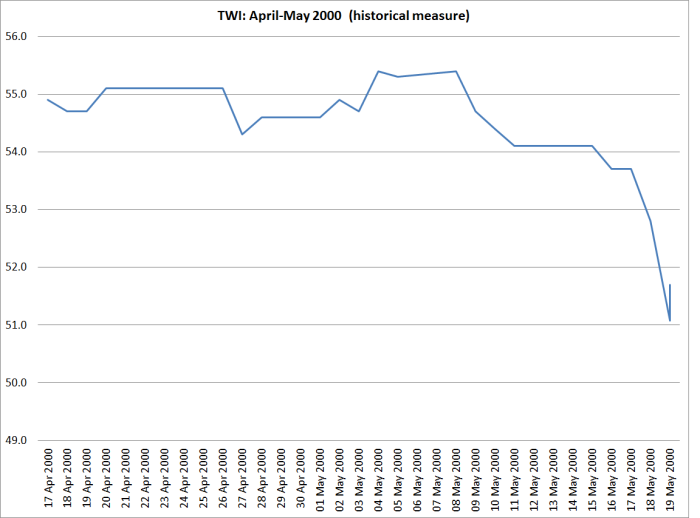
As I went on, “I’d expected the exch rate to ease off –  not to 52.8.  Over the following day or two, it fell as low as 51.08 –  on a 50 point OCR increase, we saw the exchange rate fall by almost 5 per cent at worst, and around 4 per cent when things had settled down.  Our widely-expected tightening ended up materially easing monetary conditions.  We were more than a little flustered, and my diary records us hoping “without success, that one of the wire service reporters would ring so we could point him in Murray [Sherwin’s] direction for a [clarifying] comment”.

twi may 2000

What was going on?   Basically, the market (particularly offshore) did not believe us.  They took the view that if we continued to raise the OCR that aggressively we would “kill the economy and hence exacerbate the future easing”.  I was pretty sceptical at the time (as I imagine were my colleagues), but as it happened we tightened no further, and were cutting the following year.  And as it happened there was a “growth pause” in 2000 that we had not anticipated.  The exchange rate was to fall by a further 10 per cent over the following few months and headline inflation went briefly to 4 per cent by the end of the year.

The May 2000 OCR increase, and the hawkish path it continued to portray, was a pretty material misjudgement by the Reserve Bank.  But what made it particularly bad was the strength of the immediate adverse reaction.  We badly misjudged that reaction.  There were a couple of local economists who were more hawkish than we were, but the market as a whole spoke –  and it did not believe us, or believe that we would be able to carry through our envisaged policy.  Even politicians weighed into the debate (Prime Minister and Minister of Finance).

By contrast, the only way to read the overall reaction since Thursday, has been that Graeme Wheeler’s latest policy announcement, and flat forward track, has been treated as credible.  Only time will tell whether the OCR, and with it the exchange rate, will eventually have to go lower, but for now the Governor’s stance, that he does not envisage further cuts, is being taken seriously.  And although there are some sceptical commentators (including – at least – Westpac, your blogger, my correspondent, and some macro advisory firms), there has been no controversy in the local media, nothing very critical in the commentaries from the local bank economists, and no comment at all from politicians on either side.  If anything the tone of the questioning in the press conference was slightly sceptical of the need to have cut at all.  So if I were Graeme Wheeler, I’d probably have got to the end of Thursday a bit disappointed that the exchange rate had risen by 1.5 per cent, but thinking that overall the reaction hadn’t been bad at all.  After all, the (never very likely) alternative might have been that people treated the flat rate track, and end of the easing cycle story, as not very credible at all. If so, the exchange rate might have fallen significantly – an excessively hawkish stance increases the need for easing in the future.

Credibility matters a lot to decision-makers.  Since no one can be 100 per cent sure what the right policy is, having the consensus with him probably matters a lot. After May 2000, Don Brash didn’t.  For now, Graeme Wheeler does.


Why isn’t the high unemployment rate bothering more people?

At 6 per cent, our unemployment rate is no longer low.  And yet it seems to excite little interest, whether from  the media, economic commentators, the Reserve Bank, or the government.

I’ve argued that the Reserve Bank’s unnecessarily tight monetary policy over recent years (as revealed by core inflation outcomes) has contributed to the high unemployment rate.  Within a standard model, this shouldn’t be a remotely controversial claim. If, as the Bank reckons, inflation expectations are in line with the target, then actual core inflation outcomes persistently below target will have reflected less utilisation of productive capacity (labour and perhaps capital) than would have been possible.  Put that way, it sounds bloodless and technocratic, but real people are affected here –  people unable to get a job at all, or to get as many hours as they would like.  Lower policy interest rates would have stimulated some more domestic demand, and would have lowered the exchange rate, stimulating some more external demand.  And core inflation would have come out nearer the target.

I’m not going to repeat the debate as to whether, with the information they had at the time, the Reserve Bank could reasonably have run a different stance.  I think so, and said so in writing within the Bank at the time.  But the point here simply is that, at least with hindsight, monetary policy was persistently too tight, and there has been an output and unemployment cost to that –  in a recovery that was, in any case, probably the most anaemic New Zealand has had for a very long time.  And the cost goes on –  even now, the unemployment rate is rising, not falling.

But how do we compare?  I downloaded the OECD data on unemployment rates for the 19 OECD monetary zones (ie 18 countries with their own monetary policy, plus the euro area).

Despite having some of the more flexible labour market institutions among advanced countries, New Zealand’s unemployment rate, at 6 per cent, is currently a bit above the 5.5 per cent median for this group of countries.

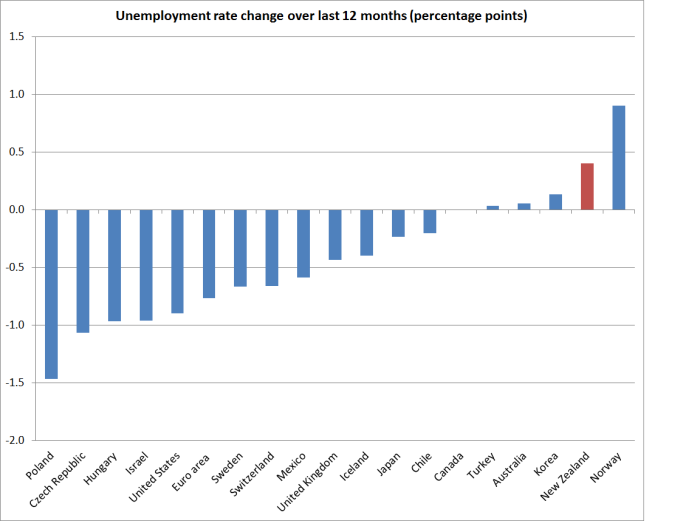
And over the last year, only four of these countries have had an increase in their unemployment rate at all.  New Zealand’s increase  has been second only to that in Norway.  The last year has been tough for Norway, with the collapse in oil prices.  The central bank has cut interest rates, by 75 basis points. But they are somewhat constrained.  The inflation target in Norway is 2.5 per cent, and core inflation is at least that high.  The central bank lists four core inflation measures on its website: one is at 2.4 per cent, one at 2.5 per cent, and the others at 2.8 per cent and 3.1 per cent.  Each of those measures is higher than they were a year ago.  Without looking into Norway in more depth, the rise in the unemployment rate (which is still only 4.5 per cent) doesn’t look like something that monetary policy can usefully do much about.  New Zealand is different.

U change since sept 14

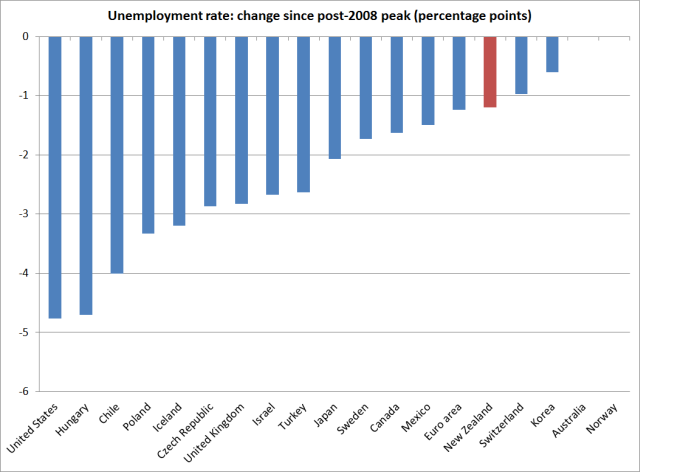
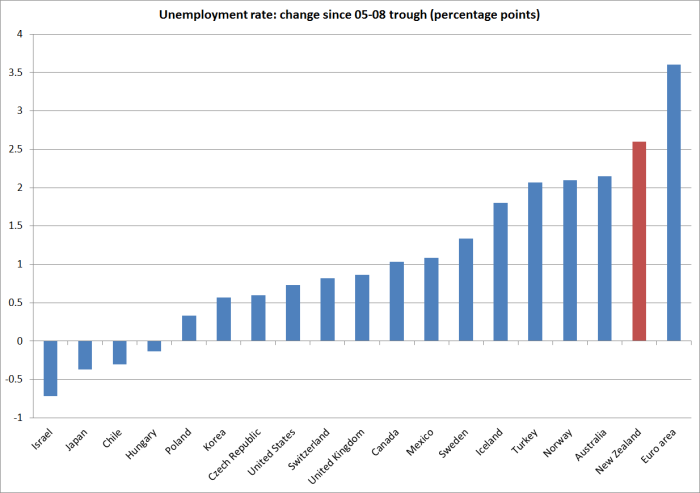
New Zealand also shows up at less attractive ends of the charts if we look at how the unemployment rate has changed since either the peak reached in the recessions from 2008 on, or from the trough in the boom years.  On the latter measure, the only area that has seen more of an increase in the unemployment rate is the euro area as a whole (which has pretty much exhausted the limits of conventional monetary policy).  And it is not as if our boom was extraordinarily large –  using OECD estimates, our peak output gap in the boom years (3.2 per cent) was bang on the median for this group of countries.

U chg since recession

U chg since 05-08

So New Zealand’s outcomes look pretty bad.  Relatively high unemployment now in cross-country comparisons, rising unemployment, and by some margin that largest increase in the unemployment rate since the boom years of any country that still has conventional monetary policy capacity left.  It should be a fairly damning indictment.

Of course, Australia also shows up towards the upper end of each of these charts.  Each of the RBA’s core inflation measures is now below their target, although (a) by less than core inflation is below target in New Zealand, and (b) this gap between outcomes and target has only really emerged in the last few quarters.  By contrast, core inflation in New Zealand has been clearly below the target midpoint for more than five years.   I suspect the Reserve Bank of Australia should also be cutting their policy rate further, but at present any error there looks less egregious than the error in New Zealand.

(Defenders of the Reserve Bank could, of course, reasonably point out that the Bank has cut by 100 basis points this year, and that monetary policy works with a lag.  However, since the Bank forecast yesterday that the unemployment rate will still be 6 per cent in March 2017, and inflation then is forecast to be only 1.5 per cent –  even with a material acceleration of growth –  that point is not particularly telling on this occasion.  It simply means that this year’s cuts have stopped the situation getting even worse.)

I’m not entirely sure why the unemployment outcomes seem to be getting no traction in the New Zealand debate.  Perhaps there is something in the insider/outsider story –  neither the bureaucrats making policy nor the market economists commenting on it are unemployed.  And perhaps many of them are, like me, of an age that the 11 per cent unemployment rates in the early 1990s shaped their perspective?  And having spent much of his career abroad, mixing mostly with international agency elites, the Governor may also have a rather limited degree of identification with the New Zealanders at the bottom end who are paying the unemployment price. But none of this seems particularly compelling.

As is widely recognised, the main Opposition political party has been failing, and isn’t helped by having a finance spokesperson who seems to struggle to get to grips with the issues, and to communicate them in a way that either resonates outside central Wellington, or in the House.  And yet, the unemployment rate would seem to be a natural issue for the Labour Party, with its strong union base, and voter base among the relatively less well-off sections of the community.

I suspect the Minister of Finance isn’t very happy with the Bank’s handling of things –  he has hinted as much in several public comments earlier in the year.  But what is in for him to make more of the Reserve Bank’s failing?  The government’s popularity ratings remain high, and the media and business elite continue to retail a narrative in which New Zealand’s economy is doing just fine –  despite near-zero per capita GDP growth, almost non-existent productivity growth (and high unemployment).

Which leaves me wondering whether elite opinion support for large scale immigration –  repeated yesterday by the Reserve Bank Governor –  is part of the story.  The Reserve Bank reckons that the high rate of immigration has raised the unemployment rate and lowered wage inflation –  it is there in the text of the MPS yesterday.  I reckon they are wrong on that: the demand effects of immigration surprises have almost always outweighed the supply effects, and so surprisingly high immigration has, if anything, tended to hold the unemployment rate down in the short-term (in the long-term it is the labour market institutions that determine it).  If you really strongly believe in the benefits of high rates of immigration to New Zealand –  and that has been the elite view, against the evidence of a steady trend decline in New Zealand, for a century or more – but think it is raising the unemployment rate in the short-term, then you might be reluctant to express any serious unease about the high and rising unemployment rate, lest it cast doubt on your preferred immigration policy.  If there is anything to that interpretation, I’m sure it is subconscious rather than conscious.  And I’m not sure if it explains anything either.

This is one of those times when central bank independence is not really serving the interests of New Zealanders.  The logic of the argument was that independent central banks would protect us from high inflation. Now it is working the other way round.   If the Minister of Finance were making the OCR decisions, the political pressure to do something about rising unemployment –  at a time of very low inflation –  would probably be more focused and intense.  The Minister of Finance has to face questions in the House every day, and make himself regularly available to the media and voters.  By contrast, the Governor hides away behind a cloak of technocratic expertise, and a Board which sees its role as to protect and promote the Bank.  That means no effective accountability (remember, real accountability means real consequences for real people).

A central bank adrift?

What to say about the Reserve Bank’s latest Monetary Policy Statement?

Having just reread my comments on the September MPS, I could simply run most of those comments again.

The Bank’s stance doesn’t really surprise me very much, but it is disappointing to say the very least.  New Zealand is being particularly poorly served by its central bank at the moment.

At least they cut the OCR.  Some had doubted it would happen, but the Bank has now belatedly completed the reversal of the totally unnecessary tightening cycle the Governor and his advisers initiated last year.   Even now, however, since inflation expectations have been falling, the real OCR is still higher than it was at the start of last year.  Over the intervening period, core inflation has stayed well below the midpoint target, and headline inflation has been at or below the bottom of the target range for most of the period.    The unemployment rate has risen, and per capita income growth has slowed markedly.    Somewhat surprisingly, there was not a single question at the press conference about that succession of misjudgements.

I was also a bit surprised that the word “unemployment”  did not crop up at all in the press conference.  The structural unemployment rate is influenced by various structural features of the economy (labour market regulation, demographics, the welfare system etc), but no one really doubts that monetary policy choices affect the short-term fluctuations in unemployment.  When the unemployment rate is above any reasonable estimate of the NAIRU, has been rising, and is forecast to continue to stay high, hard questions should be being asked of the central bank Governor.  They weren’t.    The Governor tells us that he is content not to have inflation back to the midpoint of the target range for another two years.  But there will an output and unemployment cost to that choice.  And a choice it is: the Governor probably can’t do much about inflation in the next couple of quarters, but a lower OCR over the next few quarters would, on the Bank’s own numbers, have got inflation back to target sooner.  But the Governor tells us that, as things appear to him at present, there are no more OCR cuts to come.

On its own numbers (I’ll come back to criticisms of those numbers shortly), the Bank defends its choice by arguing that

with inflation expected to increase steadily, consistent with the inflation target, a much sharper adjustment in interest rates than projected risks being inconsistent with clause 4b of the PTA

Clause 4b reads

In pursuing its price stability objective, the Bank shall implement monetary policy in a sustainable, consistent and transparent manner, have regard to the efficiency and soundness of the financial system, and seek to avoid unnecessary instability in output, interest rates and the exchange rate.

The Bank does not explain how it thinks a more aggressive approach to easing monetary policy would be inconsistent with clause 4b (and no one asked).

Perhaps it is interest rates they are worried about?  But the OCR has been between 2.5 per cent and 3.5 per cent since early 2009.  If they were to cut the OCR to, say, 1.75 per cent, the worst that could happen might be that in 12 or 18 months time they might need to raise interest rates again, probably into that 2.5 to 3.5 per cent range.  That doesn’t seem like particularly substantial variability by any historical standards.

Occasionally the Governor talks about avoiding output variability.  I’m pretty sure the authors of that phrase in the PTA mainly had in mind avoiding unnecessary recessions, but even if we grant that growth could be too strong in some circumstances, it doesn’t seem like a relevant story right now.  After all, on their numbers (Table 2:1) they think per capita GDP growth has been zero this year.  They forecast that growth will pick up, and they have overall GDP growth peaking at about 3.5 per cent in 2017.  Even with slower population growth that isn’t a troublingly high per capita growth rate.  In past cycles, we’ve typically had a year or two of 4 or 5 per cent or higher GDP growth.  Partly as a result of a succession of Reserve Bank misjudgments, we haven’t had anything like in the years since 2009.  If anything, it is what we need now to reabsorb into work the high (and rising) number of people who are unemployed.

More likely, it is the not-very-meaningful statutory provision “have regard to the efficiency and soundness of the financial system” that the Governor has in mind.  If so, he should be more upfront in making his case, and in identifying the tradeoffs involved in holding up interest rates to influence house prices and possible financial stability risks.   The Governor did note that cutting interest rates further would raise the housing risks.  But the Bank has other tools at its disposal to safeguard the soundness of the financial system, even if there were convincing evidence that that soundness was being threatened.  Using monetary policy to try to manage the possible risks around a relative asset price change is a recipe for putting the rest of the economy through the wringer.  The Governor’s monetary policy target is 2 per cent CPI inflation.  The Reserve Bank is continuing to making the same mistake Sweden’s Riksbank made.

Perhaps relatedly, Assistant Governor John McDermott responded to a journalist’s question by arguing that “very very low interest rates increase the risks in the economy”.  It is quite disconcerting to hear the Reserve Bank signing up to this BIS line –  with no supporting analysis.  And we should be wary of this “very very low interest rates “ line when the OCR today is sitting exactly at the level it has most often been at for the last six and half years (a bit higher in real terms).  Like the Governor’s constant claim that global monetary policy is very stimulatory, it depends on assumptions about neutral interest rates that the data increasingly don’t seem to support.  The Bank seems driven by a mental model that is deeply uncomfortable with a 2.5 per cent OCR, rather than by the data –  low inflation, weak per capita growth, rising unemployment, and weak commodity prices.

But are the Bank’s own numbers  even plausible?  I don’t think so.  They are projecting a material increase in GDP growth rates over the next couple of years, but it isn’t remotely clear what that optimism is based on.   The Canterbury repair and rebuild process will be gradually tailing off over that period, some recovery in dairy prices is probably already factored into producer expectations and behaviour, and the rate of immigration is expected to fall away quite materially. Population growth in 2017 is more likely to be 1 per cent than 2 per cent.    Even the Bank believes that the unexpectedly high rate of population growth has boosted GDP over the last couple of years.  So what will counter the impact of a material slowing in the rate of population growth?  It can’t really be the rest of the world’s economy.  The Governor rightly sounds a bit worried about the risks in China –  although the Bank seems blithely indifferent to the global deflationary shocks that China is representing – and there is nothing in the rest of rest of the world to suggest any material acceleration of growth next year.  For what it is worth, global energy and metals commodity prices are continuing to fall –  and while the direct effect of those falls might be modestly positive for New Zealand, they are only mitigating the impact of the weakening global environment.

Of course, forecasting is a mug’s game –  which is why monetary policy probably shouldn’t be driven off medium-term forecasts of things we (and they) know almost nothing about).  So it isn’t impossible that the Bank’s growth and inflation forecasts could come to pass.  But what they’ve given us today is not a convincing story as to how this acceleration is going to happen.  After all, their interest rate projections are no lower than those in September, and as the Governor noted the exchange rate has risen since then.  It rose further this morning.

There were a number of other odd dimensions to the document and the Governor’s comments.

Once again, the prime policy discussion (chapter 1) discussed headline inflation, but not core.  We are supposed to take comfort from headline inflation perhaps getting above 1 per cent early next year –  itself a weaker outlook than they’ve run previously –  but they offered no reasoning at all for why we should expect core inflation to rise.  And yet these are the lines they want the media to use.

In the press conference, the Governor bemoaned the fact that monetary policy decisions were always tricky because everyone in the country has a view (and this is inappropriate why?  It is, after all,  our economy, not the Governor’s).  He then claimed that it was very hard to move inflation expectations up once they start falling, and that this was so because in highly indebted economies people were reluctant to take on more debt.

Perhaps the Governor has not noticed that inflation expectations in New Zealand have already been falling –  on many measures they’ve never been lower, at least since the target midpoint was raised to 2 per cent.  The Bank quotes some carefully selected measures that average 2 per cent to suggest there is no problem, but (a) those expectations have fallen a lot over the last couple of years, and (b) they carefully ignore the indicative information revealed  in market prices.  The gap between indexed long-term government bonds and conventional long-term government bonds is currently about 1.4 per cent.  It isn’t a perfect measure by any means, but it is a price reflecting the choices and assessments by people putting real money at stake.  That is not typically so in the survey measures the Bank chooses to emphasise, which are often heavily influenced by the echo chamber of local market economists and media.

Inflation is very low, inflation expectations have been falling, and the Bank argues that in this climate it is hard to get inflation expectations up again.  So why not foreshadow more OCR cuts to come?    After all, the Governor was again anguishing about the exchange rate being too high.  Perhaps what holds him back is concern about housing, but then as the Governor told his questioner, he thinks people are reluctant to take on very much more debt.  He can’t have it both ways.  Even in New Zealand credit growth and housing market activity has been pretty subdued in the last couple of years, across the whole country, compared with what we saw in the mid 2000s.

The Governor was also asked whether the government should loosen fiscal policy. I assumed the questioner had in mind an increase in government spending which would stimulate demand and perhaps take some pressure off monetary policy. But oddly, the Governor came out with a suggestion that he thought a case could be made for more infrastructure spending, especially in Auckland.  My initial reaction was that reasonable people could differ on the case for more infrastructure spending, but I wondered if the Governor of the Reserve Bank should really be opining on such matters.  But I almost fell off my chair when he went on to explain that more infrastructure spending would increase capacity in Auckland and lower inflation pressures.  Perhaps in the long run, but had it not occurred to the Governor that putting infrastructure in place represents a material net increase in demand over the years when it is being put in place?

Perhaps more importantly, I am also puzzled about the Bank’s stance on immigration, and the evidence base that lies behind it. The Governor is clearly at one with New Zealand elite opinion –  he told the news conference that he thought high levels of immigration were “a good thing for New Zealand” and that he did not think there should be any immigration policy changes.  Views differ on the long-term economic impact of immigration, and many certainly agree with him, but why was this a subject the Governor is commenting on at all?  Historically, the Reserve Bank has been studiedly neutral on the long-term issue, and focused (rightly) on the short-term cyclical implications.  Governors who use the platform they have been given to advocate their personal policy preferences in other areas risk further undermining support for the autonomy they enjoy in respect of monetary policy.

But even the Bank’s view on the cyclical impact of the recent high levels of immigration seems confused.  In chapter one (the press release) they assert that high levels of immigration have reduced capacity pressures and contributed to  a lowering of inflation (ie supply effects exceed demand effects).  In chapter 5, they produce a scenario about the impact of immigration staying unexpectedly high over the next year or two.  In that scenario they explicitly articulate what appears to be their latest new view, in which a change in immigration has no net short-term impact on capacity or inflation pressures (short-term demand effects are just matched by short-term supply effects).  There is no analysis in support of any of this.  And there is no engagement with their own past research, or with the consensus view of New Zealand macroeconomists going back decades that whatever the possible long-term gains from immigration, in the short-term the demand effects dominate the supply effects (which shouldn’t be surprising, since the per capita capital stock requirements of each new person are materially greater than one year’s labour supply).  It was only two years ago that they published a research paper which showed these results.

mcdonald rresults

Demand effects exceed supply effects in the short-run (of several years).

The Bank seems all over the place on these issues. Perhaps they have fresh new research on the issue, but they put out two new Analytical Notes this morning, and there was nothing on immigration. I have asked for copies of any analysis they have produced in support of their new view, including how it might relate to the 2013 research.

It isn’t impossible that the effects of a surprise influx of immigrants could be near zero. If, for example, that influx just reflected the weakness in Australia, our largest trading partner, we’d have losses in demand for our exports to Australia offsetting the positive demand effects of the change in the net migration flow to Australia. But that isn’t an argument the Bank is running.  In fact, we have no idea what their arguments and evidence are.  It simply isn’t good enough, for such a major cyclical variable.

My overall take this morning was of an institution at sea.  Even if their case is in fact strong, neither the Governor nor his Chief Economist seem convincingly able to make the case, despite all the resources at their disposal.  The Chief Economist could not even effectively answer a simple question about why we wanted to get inflation up.   He ended up falling back on line that we want to avoid becoming like Japan.
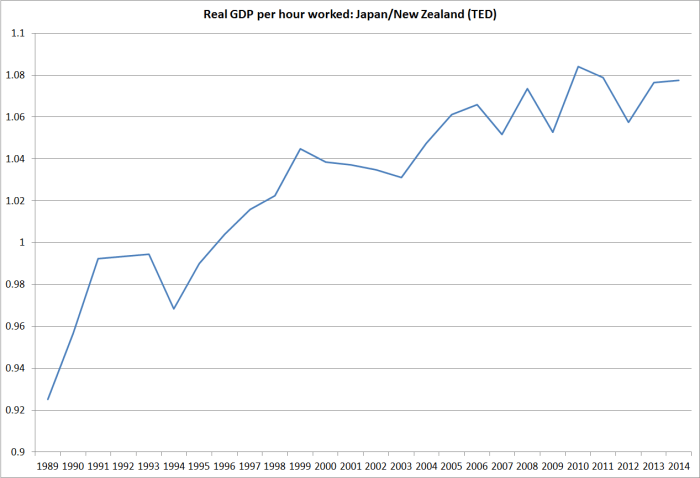
real gdp phw jp vs nz

But, actually whether one starts from 1989 (the peak of the Japanese boom) or from 2007 (the peak of ours) Japanese productivity growth has somewhat outstripped that of New Zealand.  And recall that one of the lessons of how the Japanese ended up with persistent deflation was that they kept monetary policy materially too tight for much of the 1990s.  We might not have deflation yet, but persistently tight monetary policy –  tighter than it needs to be –  is only increasing our chances of ending up uncomfortably close to an undesirable deflation ourselves.  It is all very well for the Governor to make the (accurate) point that no country has raised its inflation target since 2007.  But in the sort of global climate we’ve now had for years, those who still can (countries that don’t have interest rates at zero) should be making full use of the scope to keep inflation and inflation expectations up.
The Shadow Board on the OCR

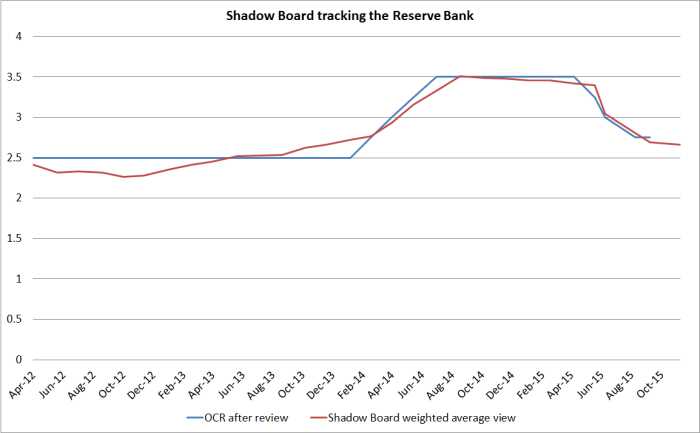
Some months ago I wrote about the NZIER’s Shadow Board, a panel of expert and informed observers who are each asked prior to each OCR review to provide a probability distribution as to what OCR is “appropriate for the economy”.  It isn’t quite the same job as the Reserve Bank has –  the Bank has to follow the PTA, and in principle the panel members might, say, agree with the two NZIER economists who recently argued for nominal GDP targeting.

There isn’t usually much information in the results of the Shadow Board exercise.  They usually track remarkably closely with the Governor’s own choice about the OCR, so they are right or wrong about as often as the Governor is.

That pattern continues this month.  The mean expectation across the respondents has dropped a little, from 2.70 per cent in October to 2.67 per cent  this time.  Whichever way the Governor goes tomorrow the Shadow Board will have been close.

shadow board tracking RB

I’ve been more struck by the lack of much diversity in the views (across panel members) and the high degree of confidence with which each panel members appears to hold his view.  This time the lower quartile expectation is 2.5 per cent and the upper quartile is 2.75 per cent.  According to these respondents there is only a 12 per cent chance that something other than 2.5 or 2.75 is the right OCR for the economy.

I don’t really understand how anyone can be that certain, given the uncertainties about the current state of the economy, the future, and about the connections between real activity and inflation (or other nominal variables monetary policy can target).

I told an interviewer this morning that I thought the economy would be better off with the OCR at 1.75 per cent than at 2.75 per cent.  I hadn’t distributed my probabilities then, but I’ve put them in the chart below (and compared them to those of the Shadow Board).  My numbers effectively say that I think there is roughly a 30 per cent chance that the consensus view is correct.

shadow board and me

It would be interesting to know the probabilities the Governor and his chief advisers would assign.  We’ll know the mean tomorrow, but almost certainly will learn little or nothing about the distribution.  Having information of that sort –  whether as a table like the Shadow Board provides, or as fan charts  –  would provide useful information on how these senior officials think about the economy.


What should the Governor do?

Tempting as it is to write about the Ombudsman’s weak report on the OIA, or to carry on looking at the Wellington airport proposal (taxpayer subsidies for long haul holidays for Wellingtonians, the return of a Think Big mentality, as Brian Easton suggested here), it is time to get back to macro.

Tomorrow is the final Reserve Bank Monetary Policy Statement for the year.  The focus, of course, is on whether or not the Governor chooses to cut the OCR, but it is worth briefly looking at what Parliament requires from the Reserve Bank in its MPSs.  That is set out in section 15(2) of the Reserve Bank Act.

The policy statement shall be signed by the Governor and shall—

(a) specify the policies and means by which the Bank intends to achieve the policy targets fixed under section 9:

(b) state the reasons for adopting those policies and means:

(c) contain a statement of how the Bank proposes monetary policy might be formulated and implemented during the next 5 years:

(d) contain a review and assessment of the implementation by the Bank of monetary policy during the period to which the preceding policy statement relates.


As I’ve noted previously, this bit of the legislation needs updating.  But it is the law, and it isn’t typically followed very closely by the Bank.  MPSs tend to be full of data analysis –  important and sometimes interesting –  but light on policy.  There is never much, for example, on the reasons why the Reserve Bank is adopting one particular approach to policy rather than another.   And when there is such discussion it is never very serious –  it is almost always a caricatured or straw man alternative  Scrutiny and accountability involves, in part, the ability to assure ourselves that powerful policy officials have thought seriously about the alternatives.  For example, at the start of last year, the alternative of not raising the OCR.

MPSs never look five years ahead, but then there isn’t much they can usefully say about such a horizon.  Whenever core inflation gets back to target they should envisage keeping it there, absent the unforeseen and unforeseeable shocks.  As I said, the legislation needs amending.

And MPSs don’t often contain much in the way of serious review and self-critical assessment of past policy.  In one respect that is understandable.  Bureaucratic incentives don’t encourage open self-scrutiny. But that is precisely why Parliament puts such provisions in legislation, to lean against the natural self-protective tendencies of powerful agencies.  We’ve heard defensive lines from the Governor –  “of course I was right” –  but little to give us (public, Board, FEC) much confidence that the Bank has really thought hard about its monetary policy performance in the last few years.   Given the target Parliament set for the Governor, it looks as though mistakes have been made.  Contra Donal Curtin, it isn’t a “gotcha culture” to suggest as much, simply a recognition of the difficulty of doing monetary policy consistently well.

But what of tomorrow?    Most economists apparently expect the Governor to cut the OCR, even if market pricing is less certain.  I don’t claim any insight into what he will do, but I am clear that the OCR should be cut.  And that the likelihood of further cuts next year should be foreshadowed.

Liam Dann had a piece in the Herald the other day looking at the pros and cons of cutting now.  I was a bit surprised to see him listing the prospect of a drought this summer as a reason to cut now.  I disagree.  Apart from anything else, it is too late to make any material difference: the biggest impact of further OCR cuts now will be seen next summer, and I doubt anyone has any particular insights on what the weather will be like then (or even on what the after-effects, eg on pasture or stock condition, of this year’s drought might be).

But also, even if a drought were to temporarily knock real GDP, it is not clear it would make much difference to incomes (nominal GDP) –  Reserve Bank research done at the time of the last drought found, somewhat surprisingly, that New Zealand droughts tend to raise world diary prices.  If so,. some people will be worse off, but some will probably be better off.  Monetary policy can’t usefully deal with distributional issues.

And, of course, the fall in real GDP associated with a drought is also a temporary reduction in the supply capacity of the New Zealand economy, so it doesn’t have very obvious implications for the level of excess capacity or of inflation pressures.

Droughts can be nasty things for rural producers, but mostly they are best looked through by monetary policy makers.

I was also a bit surprised by one of the items on Dann’s lists of reasons to hold.  This was the suggestion that the economy had been doing quite well, in maintaining real GDP growth of around 2 per cent, perhaps even picking up to around 3 per cent next year.  I highlight this not to pick on Dann, but because it is such a common line.  People seem to lose sight of the fact that Statistics New Zealand estimates that New Zealand’s population grew by 1.95 per cent in the year to September, faster than almost any advanced country.  In other words, 2 per cent real GDP growth would represent no per capita growth at all. Perhaps we are living in an age of diminished expectations, but since when was almost zero per capita growth a mark of a reasonably well-performing economy?

As a reminder, the unemployment rate has risen back to 6 per cent this year.  With inflation as low as it has been, monetary policy should have been set looser.  If it had been not only would inflation have been a bit higher, but the economy would have been growing rather faster.  That would have been a good thing, not a bad one.  Over the 17 years 1992 to 2008, real GDP growth averaged 0.8 per cent per quarter.  Since then it has averaged 0.5 per cent.    Monetary policy can’t materially influence the longer-term structural performance of the economy, but when inflation is so low we should be expecting to see growth rates materially above potential.  Monetary policy choices have meant that hasn’t happened.

Here is another way of looking at the disappointing performance of the economy in the last few years. The trend line is the path the economy would have followed if it had sustained the average growth rates of 1992 to 2008, and the red line is the actual path.  The gap between the two is now equivalent to around 15 per cent missing GDP.

real gdp pc trend and actual

There is also the argument that the OCR should not be cut because of property price inflation in Auckland (perhaps Hamilton and Tauranga too).  Reasonable people can debate the merits of whether house prices (or perhaps credit growth) should be part of the goal for monetary policy.  But they are not at present.  And the job of the Governor is to implement policy in accordance with the Policy Targets Agreement.

My view is that house prices should generally not be part of what monetary policy is targeting.  High house prices, particularly in a single city (even the largest) are largely a real relative price phenomenon –  in this case, the interaction of supply restrictions and policy-induced population growth.  Monetary policy is singularly badly suited to trying to deal with uncomfortable relative price movements –  doing so involves throwing the whole rest of the economy round to make up for some other microeconomic policy failures.  We should always be vigilant about the possibility of emerging financial stability threats, while being modest about how much we (or the Reserve Bank) really know about those risks.  But if policy responses are needed to contain those risks, there are perfectly good conventional options open to the Reserve Bank –  increasing the risk weights on housing loans and/or increasing overall capital requirements.  Such approaches are effective in limiting the potential damage to the financial system if things go wrong, while imposing minimum distortionary effects on the rest of the economy now.   And, of course, while its gets boring to say so, monetary policy works in part by lifting the demand for, and price of, long-lived assets.

A final line I’ve seen repeated several times in recent days is the suggestion that in any case monetary policy can’t do much to raise inflation.  I’ve not seen any very serious analysis or argumentation in support of that view, and it seems to simply to reflect the fact that inflation is low relative to target in much of the advanced world.  But in most of the advanced world, the scope of conventional monetary policy to do more has been long since exhausted –  interest rates have been at or near zero for years.  Neither we, nor Australia, are in that position.  We can cut the official interest rate.  And even if some are sceptical that lower domestic interest rates will do much to boost domestic demand, lower interest rates would almost certainly lower the exchange rate.  A lower exchange rate will, all else equal, boost domestic prices to some extent. And, more importantly, it will over time encourage more investment, production and employment in the tradables sector of the economy.  There is no reason to believe that something closer to full employment of domestic resources would not tend to lift core inflation.

As I’ve noted repeatedly, core inflation has been below the target midpoint –  the number explicitly highlighted in the PTA –  for several years.  There is no sign that anyone really fully understands quite why or (hence) that the Reserve Bank has been able to adequately correct its models and forecasts to avoid a repetition of this outcome in the future.   Given that, it would be prudent for the Reserve Bank to be acting now in a way that it believes would actually deliver core inflation in the upper part of the target range.  Act on the basis of forecasts that you think will deliver, say, 2.5 per cent core inflation 18 months hence.  If the Bank did that, they might be right and core inflation might end up higher than the midpoint.    If so, as it became more certain that was the case, there would be plenty of time to tighten gradually.  But if the forecasting  (or understanding) errors of the last six years continue, it is likely that core inflation would end up somewhere near 2 per cent.  The latter would be an unambiguously good outcome –  good in its own terms, and also good for the unnecessarily unemployed.

At present, by contrast, and unless the MPS tomorrow reveals some startling new analysis, we have simply to take on faith the Bank’s view that the current approach to policy and forecasting  is enough to get back to 2 per cent, even though it has not been enough for years now.  With the zero-bound no longer that far away, and with nothing in the domestic or global environment suggested any sustained acceleration in growth or inflation pressures any time soon, it is an approach that should have been seriously considered.  And if it isn’t adopted, perhaps in scrutinising the MPS tomorrow, FEC members might ask the Governor about the reasons he has chosen to adopt one policy approach over the other.

Further thoughts on Wellington airport – Part 2

In my first post today, I posed some questions around the plausibility of the assumed increase in international travel into and out of New Zealand if the proposed Wellington airport runway extension was to proceed.

In this post, I want to focus mainly on how the consultants have calculated the net national benefits from the runway extension.

The Sapere cost-benefit analysis estimates net benefits to New Zealand from proceeding with the runway extension now of $2090 million (2015/16 dollars).  These results are summarised in Table 30 of the report.  Of these gains, just under half accrue to New Zealand users of the airport (in respect of both passenger and freight traffic) and just over half accrue to “other sections of the community”.

Even if the passenger number assumptions are correct, the benefits to New Zealand users appear to be somewhat overstated, and the benefits to the rest of the community are largely non-existent.

Take  the users first.    The main benefit to New Zealand users is the lower cost of travel.   Much of that is the cost of time.  The consultants have valued the time of New Zealand travellers using some standard values from an Australian Civil Aviation Safety Authority document, but don’t appear to have allowed for the fact that New Zealand earnings  (and hence the appropriate value of time) are materially lower than those in Australia.  In PPP terms, real GDP per hour worked in New Zealand is only around 75 per cent of that in Australia.  That suggests the consultants have overstated the value of the time savings, and that the actual number would be lower by perhaps 25 per cent.

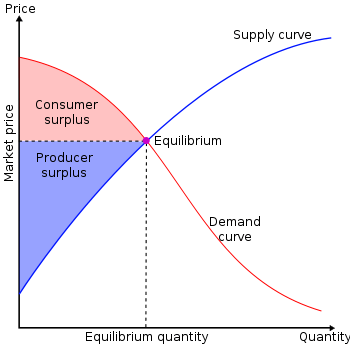
Concepts of consumer and producer surplus are very important in evaluating the welfare implications of proposals such as this.   The basic idea is illustrated in this chart.

surpluses.png

Consumer surplus is the value from consuming a product or service over and above what the consumer had to pay for it.  For some consumers, the surplus will be large (think of the first refreshing drink on a very hot day), but for the last additional consumer (the marginal) consumer, that surplus should be zero.  People will purchase additional products or services up to the point where the marginal cost to them is just equal to the marginal value of that additional consumption.  We’ll come back to producer surplus shortly.

Sapere have allowed for an estimate of the consumer surplus  that arises from the additional use of air travel services by outbound New Zealand residents ($73 million of the benefits). I’m not totally clear how they derived that benefit estimate   But they consciously do not to attempt to put a value on the additional consumer surplus New Zealand residents gain from the additional goods and services consumed on their additional overseas holidays.  It is hard to estimate such a value, but (as they pointed out to me) this omission does somewhat understate the benefits to New Zealanders of a runway extension that leads to the sort of increased outbound New Zealand traffic the calculations are based on.  However, while this is an omission, the magnitude seems likely to be quite small.  Recall that these are the marginal travellers, for whom a holiday abroad is only attractive because of the option of travelling directly through Wellington.   It is also worth stressing that while these gains are real, they accrue directly to users of the airport, and provide an additional basis on which the airport could recoup the considerable cost of providing the longer runway.

The bigger questions arise around the estimates of the benefits to the rest of the community.

The first of these is the value of the additional GST on sales of goods and services to the 200000 more (by 2060) annual foreign visitors to New Zealand as a result of the runway extension.    That GST is mostly a net real gain to New Zealand (foreigners funding our government spending).    In the Sapere estimates, it would be worth a discounted present value of $184 million, so represents almost 10 per cent of the estimated total economic benefits.

But increased GST from foreigners spending in New Zealand is not the only GST effect likely from extending the runway.  Cheaper travel also works by encouraging more New Zealanders (especially those from around Wellington) to travel abroad.  When New Zealanders travel abroad they pay GST (or the equivalent) to foreign governments.  And the income they spend abroad can’t subsequently be spent at home.  Had they spent the same money in New Zealand, the GST would simply have been, in effect, a transfer from one set of New Zealanders to another.  But with an increase in foreign travel, it is now a transfer to foreign governments. Even on the InterVISTAS/Sapere numbers, around a third of the net increase in foreign travel results from New Zealanders going abroad.  If anything, I’ve suggested that long-haul flights to/from Wellington, if viable, might be more attractive to New Zealanders than to foreigners.  At best, the GST gain is likely to be no more than half the Sapere number.

But much the biggest issues relate to the possibility of benefits to New Zealand from additional foreign tourists buying real goods and services in New Zealand.  Sapere appear to have estimated a total for the likely increase in tourist spending in New Zealand and then subtracted an estimate for the cost of providing those services.  For that they have assumed that 45.5 per cent of the expenditure is domestic value-added (ie returns to labour and capital).  That approach doesn’t seem right and generates highly implausible estimates.

The producer surplus is the gain to the provider of a good or service over and above what he or she would have been willing to provide that service at (see the earlier chart).   The cost of providing the service includes the cost of intermediate inputs (materials etc) but also the cost of the labour and the cost of capital (a normal rate of return).  If the producer sells product at that cost, there is no producer surplus. In this context, there is no net economic benefits –  economiccosts have just been covered.

Over the long haul, in reasonably competitive markets, producer surpluses should be very small (in the limit zero).  For a hotel that budgeted on 80 per cent occupancy, a surprise influx of visitors for the weekend will generate a producer surplus –  the windfall arrivals add much more to revenue than they do to costs of supplying the service.  But over the long haul –  and the airport project is evaluated over the period out to 2060 –  it is fairly implausible that there will be any material producer surplus resulting from well-foreshadowed increases in visitor numbers.  Most of what tourists spend money on in New Zealand are items such as accommodation, domestic travel, and food and beverage.  In all those sectors, capacity is scalable.  One would expect new entrants just to the point where only normal costs of capital were covered.  In the long run, supply curves for most of these sorts of services/products should almost flat.

My proposition is that there are few or no producer surpluses likely to arise from a trend increase in foreign tourism as a result of extending Wellington airport.  But even if there were, any such gains would have to be offset against the loss of producer surplus for New Zealand producer (to foreign producers instead) from New Zealanders taking more holidays abroad.  It makes little difference to the hoteliers if I take my holiday in London instead of Queenstown, while at the some time someone in Manchester takes his in Queenstown instead of taking it in London.

Even if the consultants are right that there would be more additional inward visitors than outward, any producer surpluses from either set of numbers should be small.  And the net of two small offsetting numbers is even smaller.

The safest assumption, in evaluating the WIAL proposal, is to assume that the economic benefits of the proposal all accrue to users, and that there are no material net economic benefits (or costs) to the rest of the community.  Perhaps there is a small amount in the net GST flow, but it is hardly worth focusing on given the scale of the other uncertainties.

Perhaps this point will seem counterintuitive to lay readers and city councillors.  Surely “Wellington” or “New Zealand” is better off from having more foreign visitors (assuming the numbers outweigh the increased outflow of New Zealanders)?  And if so, shouldn’t we –  Councils, government –  be willing to spend money to get those benefits?   The short answer is no.    Good and services cost real resources to provide, and in a competitive market simply providing more goods and services won’t make the city or country better off –  you need to be able to sell stuff that generates more of a return than it costs to provide (including the cost of capital).  Vanilla products and services typically don’t do that.  After all, labour that is used to provide services to tourists is labour that can’t be used for something other activity.  And over a horizon of 45 years we can’t just assume there are spare resources sitting round unused.  Spending public money to generate this economic activity will come at a cost of some other economic activity being displaced (as well as the deadweight costs of taxation, which are allowed for in the cost-benefit analysis).

If, to a first approximation, there are no “net incremental economic benefits” for the “rest of the community” then even if the WIAL/Sapere passenger number estimates are totally robust, the net benefits of the project drop from $2090 million to $954 million.

In my earlier post, I noted that the cost-benefit analysis had been done using a 7 per cent real discount rate.

The authors defend it by reference to the Treasury’s guidance on evaluating infrastructure and single-use building projects (eg hospitals and prisons).

Frankly, I’m sceptical that that is an appropriate discount rate for this project.  And I would be astonished if Infratil –  the dominant shareholders in WIAL – treated their own marginal cost of capital for a project like this as being as low as 7 per cent real.  Perhaps a case might be made for something that low in respect of projects that depend simply on existing traffic (growth) patterns –  eg the current extension to the domestic terminal at Wellington –  but at the margin this runway extension has the feel of a much higher risk project.  After all, they could build it and no one might come.  I’ve written previously about government discount rates, and also linked to a recent Reserve Bank of Australia article suggesting that private sector firms are typically using hurdle rates of at least 10-13 per cent nominal (almost as many in the 13-16 per cent range).

I would reiterate the point here. For a project like this, a much higher discount rate should be being used.  Perhaps if it all goes wrong, WIAL itself might be able to recoup the costs from all airport users (I don’t know the Commerce Commission limitations on that), but even if so, this evaluation is being undertaken from a national benefit perspective.  The risk of all users being lumbered with higher charges to cover the cost of a project gone wrong has to be factored in to any evaluation as to whether public money should be used. A 10 per cent real discount rate seems a pretty reasonable commercial benchmark, and the sensitivity analysis (table 33) indicates that using a 10 per cent discount rate rather than a 7 per cent rate roughly halves the estimated net economic benefits of the project on the “most likely” scenario.

Using a higher discount rate and removing the producer surpluses (that are most unlikely to exist)  would reduce the estimated net national gains of the runway extension proposal –  advertised at in excess of $2 billion – by around three-quarters, even if the passenger number estimates were totally robust.

If one uses the low scenario instead (Table 33), net economic benefits are estimated at $802 million.  But $533 million of those benefits were estimated to accrue to the rest of the community –  and I’ve argued that those producer surpluses just don’t exist to any material extent.   And on that scenario, using a 10 per cent discount rate reduces the net economic benefits by 57 per cent relative to the estimate done using a 7 per cent discount rate.

Perhaps there is a viable proposition in all this for the airport company itself.  I rather doubt it.  I suspect that the additional landing and passenger charges that would have to be levied on the new wide-bodied/log haul services would undermine the additional demand to the extent where it was simply uneconomic to provide those services. Wellington doesn’t look like a natural place for economic long haul services. But that should be the airport company’s call, with their own money at stake

Councils –  and especially Wellington City Council –  should steer well clear of the temptation to put ratepayer money into this proposal.  It is not as if Infratil appears to be proposing to reduce its stake in the airport.  What is apparently proposed is a ratepayer/taxpayer capital subsidy, without the councils gaining any additional ownership interest.    If things go wrong, the airport company itself may well, over time, be able to recover its investment, since many people need to use Wellington airport.  Even if things go right, the Wellington City Council has little way of recouping the cost of its gift/investment.  And if things go wrong, it has no way at all.  Only the chimera of alleged “wider economic benefits” could lure otherwise intelligent people into a proposition with such a weirdly asymmetric payoff structure.