Household debt, house prices….and Sky


Stories about household debt and house prices are everywhere at present.  For anyone interested, Radio NZ’s Sunday morning show yesterday had a 20 minute (pre-recorded) discussion with Chris Green, of First NZ Capital, and me on some of the issues. I think we agreed on more than we disagreed, both emphasizing that large falls in real house prices have happened before and will, no doubt, happen again.  And the domestic economy is currently less robust than either Treasury or the Reserve Bank would have us believe.

The Radio NZ interviewer was, it seemed, keen to run with a narrative of mass collective irresponsibility, but as I’ve noted here before there is no sign that higher house prices are leading to a huge surge in consumption (any more than has happened with previous house price booms), and good reason to think that many people are very uneasy about the size of the debts they are having to assume to get into a first house.  I could have added that house sales per capita, and mortgage approvals per capita are not particularly high by historical standards.  Scandalous as the house price situation is, if there is a mania –  contagious exuberant optimism –  it must be very localized.

Tomorrow, I want to focus again on the Reserve Bank’s stress tests and how we should think about those results.  But before getting into that, it is worth briefly repeating a few other relevant points.

First, there is the constantly repeated claim, especially from some commentators on the left, that the system of banking regulation incentivizes banks to lend on housing security, skewing their whole portfolios towards housing lending, beyond the natural levels justified by the underlying riskiness of different classes of loans.     That is simply false.    The essence of the argument is that in calculating capital requirements, loans secured on housing generally carry a lower “risk weight” than most other forms of bank credit.   They do, and that is because such loans are generally less risky.  Compare a loan secured on an existing house in an established suburb, supported by the wage or salary income of the occupants, with a loan to a property developer for a new project on the fringe of a fast-growing town and you start to get a sense of the difference in risk.   If anything, the initial risk-weighted capital regime (Basle I) probably overstated the riskiness of a typical housing loan and understated the riskiness of many corporate loans (and sovereign exposures for that matter).  In the shift to Basle II, many countries appear to allow banks to reduce risk weights for housing exposures too far.  New Zealand (the Reserve Bank) was much more cautious (even than, say, APRA in Australia).  As I’ve noted previously, the IMF has accepted that New Zealand’s housing risk weights are among the highest used anywhere –  other countries have been coming towards us.   There are reasonable arguments as to whether risk weights can ever be assigned in a fully satisfactory way –  hence the support in many circles for simple leverage ratios, as a buttress to the capital regime –  but there is no reason to think that all types of credit exposures should be treated identically.  Bankers wouldn’t –  with their own shareholders’ money at stake.

Second, there have been plenty of systemic banking crises around the world over the decades.  But as the Norwegian central bank, the Norges Bank, pointed out in a nice survey a few years back, which has been cited by our own Reserve Bank,

Normally, banking losses during crises appear to be driven by losses on commercial loans. Loans for building and construction projects and (particularly) commercial property loans have historically been vulnerable. Losses on household loans appear to be a less significant factor,

This was true, for example, in the Scandinavian crises of the early 1990s –  savage recessions in which (in Finland) house prices fell by 50 per cent and banking systems around the region got into severe difficulties –  and in Ireland in the most recent recession.  And each of those crises occurred in fixed exchange rate countries, in which the authorities had (in effect) abandoned the ability to use monetary policy to buffer severe adverse events.

Are there exceptions?  Well, the US in the most recent crisis certainly looks like one on the face of it.  Housing loans were at the epicenter of the crisis, and the US has a floating exchange rate.  But as I’ve pointed out previously, drawing on excellent book Hidden in Plain Sight, much of what went on in the United States was the direct result of the heavy direct government involvement in the US housing finance market, and the legislative and regulatory pressure placed on private and quasi-government lenders to lower their lending standards on housing exposures. Government-directed credit is often a recipe for some pretty bad outcomes.  Advanced countries where the government did not have a substantial role in the allocation of credit (especially housing credit) and where domestic monetary policy was set to domestic economic conditions –  rather than, say, pegged to German conditions –  did not have banking systems which experienced large losses on their domestic loan books, and especially not their domestic housing loan books.  I’m not aware of any exceptions in recent decades.   I looked at the post=2007 crises here.

Individuals who have taken out large amounts of debt just before housing (or other asset) markets turn can find themselves in a very difficult financial position.  If the borrower has a good income, it might just be an overhang of debt that limits mobility.  In principle, banks can foreclose on mortgages with negative equity, but they very rarely do so as long as the loan is being serviced.  And nasty housing market shakeouts often take place in the context of severe recessions –  in part because building activity is one of the most cyclical aspects of the economy and building activity tends to dry up when house prices fall sharply.  But the case just has not been convincingly made that the New Zealand economy and financial system are seriously exposed as a result of current house prices per se, or of the current level of household debt.  As a reminder (a) that level of debt (relative to disposable income or GDP) is little changed over the last eight years, after a sharp increase in the previous fifteen years, and (b) that level of debt did not cause evident problems when New Zealand last experienced a pretty serious recession in 2008/09.   And relative to the situation on the eve of the 2008/09, New Zealand households now have a much higher level of financial assets (again relative to income or GDP) than they had then.     The risks now may be more localized and concentrated in Auckland than they were in 2007, but there is little to suggest that they pose more of an independent threat to the whole economy or the financial system.  On all published metrics –  whether or capital or liquidity – the banking system is in better health today than it was in 2007 –  and the same goes for the Australian parent banks.  When you dig into the details of the Reserve Bank’s FSR, that is what the data say, but it isn’t what you hear from the Governor.

I’ve been concerned for some time that the Governor has an inappropriate focus on the US experience.  He lived in the United States for more than a decade, including during the 2008/09 crisis, and although his role at the World Bank was focused on emerging markets, he got to participate in some of the international meetings that were epiphenomena around the crisis –  ie lots of headlines, but of little actual relevance to dealing with the various national crises.  Inevitably, that sort of experience influences a person’s perspectives.   But the Governor has never given us any reason to believe that the New Zealand situation now is remotely comparable to the US situation in the run-up to the financial crisis.

Despite all the research resource at its disposal, the Reserve Bank has never published any analysis or research looking at the countries which did, and did not, have domestic financial crises (and especially ones sourced in the housing mortgage books).    What marked out the US and Ireland, for example, from New Zealand, Australia, Canada, the United Kingdom, Norway or Sweden?  Each had very high house prices going into the global recession of 2008/09, each had had very rapid credit growth, most were seriously affected by the recession itself, and yet some had serious domestic loan losses and domestic financial crises, and most didn’t.    Almost certainly, the difference was not simply that the US and Ireland were selected for crises by some celestial random number generator, which indifferently spared the other countries and their banking systems.    As he rushes from one ill-considered distortionary intervention to another, overlapping one control upon another, exempting some borrowers and some institutions but not others, and impairing the efficiency of the financial system, surely the Governor owes us at least this modicum of explanation and analysis?  And that is even before we start asking questions about why the Governor (and his staff) should be thought better able to decide on the appropriate allocation of credit than private institutions whose managers have built careers on making lending decisions, and whose shareholders have considerable amounts of their own money at stake.  Last I looked, the Reserve Bank –  and the Governor –  has nothing at stake in the matter, and they have demonstrated no track record of expertise in making credit allocation decisions. In that respect, of course, they are little different than their peers in other countries. The level of hubris on the one hand, and lack of deep thinking, research and analysis on the other, is quite breathtaking.

And yet our politicians let them get away with it.  They leave so much power vested in a single unelected individual –  selected by another pool of unelected individuals  – whose term is rapidly running out, and who won’t be around to be accountable for the consequences of his intervention.   Then again, perhaps he will.  A typically well-sourced Wellington political newsletter last week claimed that the Governor is well-regarded in the Beehive and might well be reappointed.  It seems unlikely –  and I’d be surprised if our scrutiny-averse Governor even sought another term – but the line must have come from someone, presumably someone reasonably senior.

But, on a quite different topic, now I’m going to stick up for the Reserve Bank.  Bashing government agency spending on all sorts of things makes good headlines.  Bad policies deserve lots of critical scrutiny, and bad polices typically cost taxpayers a lot of money, whether directly or indirectly.  But frankly I was unpersuaded by the Taxpayers’ Union’s latest effort, highlighted in the Sunday Star-Times yesterday, around government agencies’ spending on Sky subscriptions.  Among core government agencies, the Reserve Bank was one of the larger spenders, with a total outlay of around $12000 in the last year.  The Taxpayers’ Union specifically called attention to the Bank.

But why?   The Reserve Bank has a variety of functions, some of which (notably the financial markets crisis management functions) which might warrant a Sky subscription even for professional purposes.  But even if the rest of them are scattered around lunch and breakout rooms in the rest of the building, so what?  Any organization seeks to create a climate that encourages high levels of staff engagement, and the recruitment and retention of good staff.  Some people are just motivated by cash salary –  always the overwhelming bulk of costs for central government policy and operational agencies –  but many are motivated by a richer complex of considerations, including on-site staff facilities –  which might include the quality of the cafeteria, fruit bowls, coffee machines, the Christmas Party, Friday night drinks, medical benefit schemes, access to newspapers, or even access to Sky.  In the private corporate sector there is a range of different approaches –  some no doubt work best for some types of workers, and some for others.  Sometimes these things are actually cheap at the price –  there is more motivational benefit than there is cost to the organization, which suggests everyone is better off.   Access to Sky was never one of the things the Bank offered that particularly appealed to me –  then again, the bonds built over a morning coffee, or gathered round a TV late on a rare afternoon when New Zealand was on edge of winning a cricket test in Australia, were probably good for the Bank, and for staff attitudes to the Bank.

I’m all for serious scrutiny of government agencies.  But focus on the big picture. Look at the quality of the policy advice and research being offered up. Look at the overall costs of organisations and functions, including overall average remuneration levels –  and perhaps even focus on the details when it comes to what senior managers spend on themselves.   But leave managers some flexibility to  attract, manage, and reward good staff  –  within those overall constraints –  in ways that don’t leave them constantly fearing “will this be a Stuff headline”.    We’ll all be a little less well off –  citizens who need a good quality public sector, with a limited number of able staff –  if we don’t.
 

Brexit thoughts from the Antipodes

My wife suggested a post on the contrast between British entry to the EU (or EEC as it was then) and the looming possibility of British exit.  She is young enough that British entry was a featured topic in New Zealand history when she did School Certificate history in the 1980s (for me, it was closer to being current affairs).  By contrast New Zealand media coverage of the British referendum is largely devoid of any particular New Zealand dimensions.  On a day when the British papers are highlighting a new poll suggesting that the Brexit cause could win, it seems like a good day for a few thoughts.

A lot has changed in the years since the early 1960s when New Zealand first faced the possibility of Britain entering the EEC, and the threat that posed to New Zealand’s major markets for dairy and lamb exports.  So important was the issue that, apparently, at New Zealand economists’ conferences in the 1960s a toast was often drunk to Charles de Gaulle, for his two vetoes of UK entry.

The make-up of our population has changed over that time, but in some ways less than one might think. In the 1961 Census, 9 per cent of the population had been born in the United Kingdom, and in the 2013 Census, 6 per cent had been.  And in most years, the United Kingdom is still the source country for the largest group of those given residence permits to live in New Zealand.  The UK still seems to be the favoured destination for New Zealanders looking for an OE, at least one beyond Australia.  Sporting ties, and rivalries, seem as strong as ever.   But if state high schools still sing “Jerusalem” and cathedral choirs still sing Stanford and Parry, the emotional ties are much less strong than they were.   In the early 1960s, it was less than 20 years since the end of World War Two, and less than that since the conflicts in Korea and Malaya where New Zealand and British troops had fought side by side.

But it is probably the economic ties that have changed most.  One of the after-effects of the war  –  and the huge overhang of debt the UK had taken on – was the Sterling Area, of which New Zealand was a part.  With a fixed exchange rate to sterling –  unchanged for almost 20 years – and our foreign exchange rate reserves held in sterling, overall sterling area access to US dollars affected each country in the area. Private international debt markets were much less developed than they had been in the past, or are now.  And New Zealand government offshore borrowing had been undertaken in the UK for more than 100 years –  it wasn’t until the very end of the 1950s that the first, expensive, New Zealand government loan was raised in the US.  Britain had been keen on New Zealand joining the IMF and World Bank –  we didn’t until 1961 –  partly because it would facilitate access to dollars for New Zealand’s capital needs.

And, most of all, the United Kingdom was a major export market –  as late as 1967, 44 per cent total exports went to the United Kingdom.  In the 1960s, almost all our dairy and lamb/mutton exports went to the United Kingdom.  As the New Zealand Ambassador to the US put it, in a prominent lecture he gave in New York in 1963, “the problem which we faced….was the threatened removal of the one remaining important free market for primary produce at a time when the highly industrialised countries of Europe are intensifying the trend to self-sufficiency in these products”.   There were, at the time, no credible alternative markets for some of the largest chunks of our exports.  And if Continental leaders were willing to consider UK entry to the EEC, they certainly didn’t see continuing New Zealand easy access to UK markets as part of the deal,  Indeed, one of the attractions of UK entry to them was detaching Britain from the Commonwealth and traditional suppliers of agricultural products (Australia as well).

Possible British entry was a huge issue for politicians and economic advisers in New Zealand in the 1960s and early 1970s, but it wasn’t a trivial issue in the British debate either.  Some of that was about past ties of blood, shared military sacrifice, shared family bonds and so on.  But some of it was economic too: New Zealand lamb and butter –  known as coming from New Zealand – had an established and significant place in the British retail market.  It would have been difficult –  perhaps impossible –  for Britain to have joined the EEC –  for British public opinion to have allowed it –  without “acceptable” arrangements for New Zealand and Australia.

At the time, material living standards in New Zealand were still higher than those in the United Kingdom –  ours were still among the best in the world.  The prospect of UK entry, with all that risked implying for markets for New Zealand produce, was a very dark cloud over those living standards.  (In that same lecture, our Ambassador to US, presumably citing received official opinion saw import substitution by building up local manufacturing, combined with rapid population growth –  natural increase and immigration –  as part of the solution).

The situation is nothing like symmetrical today.  The United Kingdom is still our sixth largest trading partner, but lagging a long way behind Australia, China, the United States and the euro-area.  If London remains one of the most important financial centres in the world, open capital accounts mean that the UK is not a particularly important source of financial capital at the margin –  and, of course, our government doesn’t borrow abroad, and our exchange rate floats.    There might be opportunities for New Zealand individuals and firms if the UK actually leaves the EU  –  our lamb exports to Europe (including the UK) are still restricted, and there are some hopes that revised immigration policies might treat New Zealanders the same as, say, other Europeans.  But these are probably second or third order issues for the New Zealand economy as a whole.   Some of those strongly campaigning for Brexit would favour a much more market-oriented approach to trade and regulatory policy, and anything that lifted medium-term productivity prospects would be good for the world (including us).   Whether there would be much improvement in the quality of policy is perhaps debatable –  other Anglo countries, not caught up in the web of Brussels, have not exactly been at the forefront of market-oriented liberalization in the last decade or so.

If Brexit isn’t a great economic opportunity for New Zealand, what about the risks on the other side?  The great and good of the economic establishment –  in Britain and internationally –  have been weighing into the debate to urge British voters to vote “Remain”.   Even President Obama has been recruited to the Prime Minister’s cause –  as if the views of a foreign leader should influence British voters views about the future of their own country.  Hundreds of economists have been writing to the papers urging the voters to vote to stay in the EU.  It is a curious spectacle.  One might have supposed that agencies such as the IMF and the OECD would have little credibility with anyone these days, and nor is it clear that they have (or even should have) British voters’ best interests at heart when they offer their advice.

The economic debate seems to turn on two, separate, issues.  The first is about the transition, and the second about the medium-term.  Actually, the two quickly converge.

We’ve already seen markets rattled each time polls suggest a heightened probability of Brexit.  It will, almost certainly, get much worse in the next few weeks if the latest polls are picking up something real.  And if Britain votes to leave, the days after that result is declared could be very very messy indeed.  Apart from anything else, the path ahead –  even for Britain –  is quite unclear, starting with who will be leading the British government to negotiate the exit terms.

The world economy and financial system are hardly in fine robust health.  And the policy buffers if things go wrong are few and very limited –  in monetary policy alone, almost everyone is already starting with interest rates around zero.  Britain itself just isn’t that important –  nukes, a Security Council seats, and London as a financial centre notwithstanding. Then again, it is only a year or so since the Scottish referendum was unnerving markets, and Greek crises have repeatedly wrought havoc for the last few years.  Why?  Because what starts in one place probably won’t stop there.   No one was really comfortable that the wounds to the euro could be cauterized if Greece left. What of the EU itself?

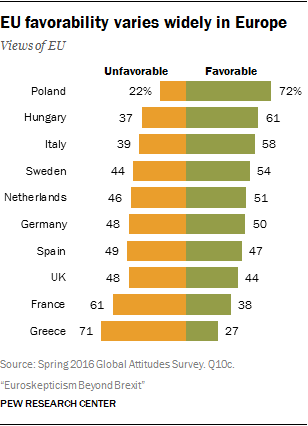
It isn’t as if euro-skepticism is a uniquely British phenomenon.  I thought this Pew Research chart from a few days ago was fairly telling

eu favourability

Public opinion in France is less favourable to the EU than that in the UK, and the UK numbers are little different than those in Spain, Germany and the Netherlands.

Which is why a lot of the economists’ contributions to the UK debate seem rather moot.  They come up with estimates –  really not much better than back of the envelope ones, despite all the apparent sophistication  –  suggesting a potential loss of income to the average Briton if the UK leaves.  But that all assumes that the rest of the EU holds together largely as it is.  And that doesn’t seem very likely at all.  In fact, as with the cause of Scottish independence, a defeat in a single referendum seems unlikely to make the exit issue go away even in the UK.  As with the euro itself: break-up fears wax and wane, but it will be a very very long-term (most likely never) until that risk disappears altogether.

So really the economic establishment –  in the UK and globally –  is urging British voters to vote “Remain” to hold the whole EU project together.  They can’t actually say that –  that would suggest a fragility they just can’t publicly acknowledge –  so they have to pretend that it is all about the British voters’ own best interests.  This week it reached ludicrous extremes with David Cameron suggested that people who voted “Exit” weren’t being patriotic and didn’t believe in their country.

But very few British voters really want any part of an “ever-closer union”.  Actually, few voters in most of the rest of Europe do either.  And yet everyone recognizes that  the euro in particular can’t credibly hold together without further progress in that direction.  Probably most voters are quite keen on free trade in goods –  and to a lesser extent in services – among European countries, but they don’t want their laws made by unelected officials in Brussels, or even by majorities of ministers from other countries.  And they don’t want their laws interpreted, and application decided, by foreign judges.  It is quite a bit about what being a nation state is.  Many aren’t too keen on a lot of immigration either –  no matter how often the elites assert that benefits flow from it.  That seems like the sort of choice citizens of each country should get to make.  And to be able to toss out the people who make laws and regulations they disagree with.

I’m not a Brit –  all my ancestors were, but they left in 1850 and shortly thereafter –  but of all the countries in the world other than New Zealand, Britain is  probably the one I care most about.  Were I a British voter, I’d vote for Exit.  Not because Britons would necessarily be better off economically –  they could be, with the right policies, but one doesn’t decide the future of one’s country based solely on narrow economic considerations.   Had it been otherwise, perhaps New Zealand in the 1960s could have done a Newfoundland, and given up our independence to become part of the UK (in case anyone is wondering, I’ve not found any who suggested doing that).

Voting to leave the EU would be, to some extent, a step into the unknown.  But big important choices often are – whether to go to war, to marry or to break-up a marriage, to split a country, or an empire.  People in Ireland were probably worse off (economically) for decades from leaving the United Kingdom, but who is to say their choice was wrong or illegitimate. One must be prepared to count the cost of those choices.   But if British voters want their country to be as independent –  but still, inevitably interdependent –  as New Zealand, or Australia, or Canada, or the United States, then Exit seems like the way to vote.  It might be a rocky ride, even for the rest of us –  perhaps it might even be the unwelcome way in which Graeme Wheeler gets the TWI down –  but it is a perfectly reasonable choice.  And one voters in other countries are likely also to make before long.   The EU as we see it today looks a lot like a project that has badly over-reached.


A question for The Treasury

One thing I like about the Reserve Bank is that it has largely stayed clear of Twitter.  They use it –  you can find them here – but there was a deliberate decision made a few years ago to use it only to highlight new Reserve Bank releases; links to articles, research papers, press releases etc.  I’ve always been sceptical of a medium for expressing ideas in 140 characters or fewer.

The Treasury is a bit more adventurous in their use of Twitter (here), offering editorial perspectives at times, and enthusiastically retweeting things from other people and organisations  (here and abroad) who either endorse something Treasury has done or said, or that Treasury agrees with or endorses.

This Treasury retweet of something from a British academic caught my eye the other day.


Jun 1

Distance matters (still): Trade volume with UK vs distance of trading partner from the UK.  

It is quite a nice chart from The Economist that illustrates a now fairly well-known point.  Firms and people do much more trade, all else equal, with firms and people in countries close to them that with those in countries far away. I don’t think this particular version of the chart is wholly compelling: it uses the total value of trade between countries, but population numbers matter as well, and it might have been better to illustrate the point using per capita trade values instead.  Doing so in this chart would move both Ireland and New Zealand a long way up relative to the other –  mostly much larger –  countries that are highlighted.  But the key point holds: distance matters, a lot.  Not just in terms of who one trades with, but in terms of how much total foreign trade is done at all.  For small countries even more than for large countries, the ability to successfully sell more and better stuff to the rest of the world is a vital part of improving a country’s long-term economic fortunes.

In retweeting it, presumably official Treasury was keen to remind us that distance matters to New Zealand too.    There is no way Australia, for example, would be the largest trading partner for New Zealand firms if, for example, these islands were set in the Bay of Biscay.

Treasury has made a useful contribution over the years in reminding us of this point.  They developed the useful line 15 of so years ago that drawing a circle with a 1000 km radius around Wellington would encompass 4.5 million people and lots and lots of seagulls. while a comparable circle around Vienna or Seoul would encompass hundreds of millions of people.  Sadly, seagulls aren’t a terribly promising market.

Treasury also included this chart in their Holding On and Letting Go document, which formed part of their 2014 Post-election Briefing to the Minister of Finance

Figure 8: New Zealand’s geographic challenge
Selected countries distance from world markets and populationFigure 8: New Zealand's geographic challenge   . Note: The x axis is scaled so that each marker is ten times the magnitude of the previous one.
Source:  World Bank: World Development Indicators, ITC: Trade Map, CEPII

Among OECD and major emerging economies, New Zealand is more distant from markets than any other country.  Chile and Australia are almost as distant.  Chile is a much poorer country, and Australia –  while wealthier –  is very fortunate in the scale of its usable natural resources, but when one looks at the productivity data it is no longer in the top tier of countries.

Treasury also produced an interesting piece of formal empirical research a couple of years ago  using cross-country data to look at the various barriers to foreign trade that New Zealand faces.  In the modelling they report, distance shows up as a highly statistically significant factor influencing (negatively) the volume of foreign trade a country does.

Distance  –  and trade – isn’t mostly about land, it is about people.  Our islands are really remote, but much of what counts is the people living here, who have to find ways of making and selling stuff abroad, especially if we are to have any chance of offering top tier incomes and material living standards to those people.

And so it puzzles me that Treasury never seems to consider population size –  and especially the role of immigration policy in changing population size over time – when they discuss the implications of distance.  4.5 million or so of us face the (quite substantial) penalty of distance.  What leads Treasury to think that exposing ever more people to that “tax” –  not as a result of New Zealanders’ private fertility choices, but as a direct result of government policy –  makes sense.  As I’ve pointed before, in none of Treasury’s writing on immigration policy in recent years has there been any sense of evidence that a large scale (notionally skills -focused) immigration policy has been doing anything useful to lift the overall productivity performance of New Zealand, and the income prospects of New Zealanders.  If anything, we’ve continued to lose ground relative to other advanced countries.

For some time it has surprised me that Holding On and Letting Go had scarcely any mention of immigration policy, and most of the (few) references to immigration were simply to the cyclical pressures, rather than the medium-term issues, even though (for better or worse) it is one of the larger government policy interventions in the New Zealand economy.

Treasury argues that “geography isn’t destiny”, and there is clearly an element of truth in that.  But I don’t think they have yet taken seriously enough the nature of the geographic constraint.  Yes, New Zealand did have top tier incomes for decades, but it did so by exporting natural resource based products deploying/supporting a very small population.  There are no more natural resources here than there were 100 years ago,  the overwhelming bulk of our exports are still natural resource based (not just the obvious farm products, but fish, wine, gold, oil, the electricity that produces aluminium, and tourism) and yet we now have four times as many people as we had in 1916.  Some countries make the transition from natural resources.  When Captain Cook got to New Zealand, Britain’s exports were about 95 per cent based on Britain’s own natural resources.  These days, very little of her exports are.  We have shown very little sign of being able to make that transition.

That isn’t because we don’t have smart, able, innovative people, or good institutions, it seems to be largely because places this remote don’t successfully support many non-natural resource based businesses.  There aren’t any other examples of places that successfully do –  the other even more remote islands are too insignificant to even get on Treasury’s chart.   Internationally-oriented non natural resource based businesses might start here, but mostly the business will be worth more if, in time, it comes to be based somewhere a lot nearer markets.  In some cases, proprietors will like to live here, and will sacrifice growth to keep the business here –  but it is a sacrifice, and in that sacrifice is a measure of the limitations of this place  as a (remunerative) home for too many people.  As one person who runs a small global business here recently put it to me, face to face contact still matters a lot, and if air travel is a bit cheaper than it was 50 years ago, it is no less physically draining or time-consuming.

So my question for Treasury is something along the lines of, why not take seriously (a) the lack of hard evidence that New Zealanders have had economic benefits from immigration, combined with (b) your own recognition that distance matters a lot, and (c) the fact that New Zealand remains a heavily natural resource based economy, with few signs that that is really changing, with no more natural resources being made (and increasing environmental concerns/constraints),  and then think harder about whether a government policy to drive up New Zealand’s population –  even as New Zealanders have kept on leaving –  really makes much economic sense at all.  Treasury has recently asked some good questions about the skill mix of our actual migrants, but they need to think harder about whether there are really top tier income-earning opportunities here for very many people, even if we could somewhat improve the average skills level of those who come.

Distance and location really do seem to matter, a lot.  Policymaking hasn’t really taken that seriously.

Still unconvincing

We expect inflation to strengthen reflecting the accommodative stance of monetary policy, increases in fuel and other commodity prices, an expected depreciation in the New Zealand dollar and some increase in capacity pressures.

So said Graeme Wheeler in his MPS press release this morning.  I thought it sounded like a familiar line, so I went back and had a look.  This seems to have been the Governor’s 30th OCR decision.  Back in his very first OCR announcement in October 2012 he said this

While annual CPI inflation has fallen to 0.8 percent, the Bank continues to expect inflation to head back towards the middle of the target range.

And in all those 29 statements since then –  with perhaps just one exception –  he has been saying much the same thing: inflation will increase.  And actual inflation –  headline, and the range of core measures – just keeps on being below target.

At the Bank’s press conference, Bernard Hickey asked if the Bank could be regarded as having done its job, given that even on its own forecasts (persistently too optimistic) there would have been six years of inflation below the target midpoint by the end of 2017, when the Bank again expects headline inflation to be back to 2 per cent (the Bank doesn’t publish forecasts of the core inflation measures, but I doubt the picture would be any different if they did –  it has also been four or five years since the various core measures were clustered around 2 per cent).  There were a range of possible plausible answers to that question, but I wasn’t prepared for the one Assistant Governor John McDermott actually gave: he said “your timeframe is very short”.  Six years……when monetary policy generally works over perhaps a two year horizon, and when the Governor’s term –  in a system built on personal accountability –  is only five years.

Yes, it wasn’t a very good day at the Reserve Bank today.    Inflation is apparently expected to increase partly because the exchange rate is expected to fall.  At 8:59am, the exchange rate was already above what the Bank was assuming in the MPS projections,  and a few minutes later it was another per cent higher, and it rose a bit more in the course of the press conference.  I’m not sure why the Governor expects the exchange rate to fall back if his rosy domestic economic story is correct.  Perhaps he expects a lot more tightening in the US.  But, again, he has been expecting that almost since he took office in 2012.

Some of the other bits in that statement as to why he expects inflation to rise were a bit puzzling too.  The Governor apparently thinks “accommodative monetary policy” will do the trick, but in real terms the OCR is probably a bit higher than it has been for much of his term (certainly than in the year or so before the unwarranted tightenings), and the TWI this afternoon is only slightly lower than the average level for the Governor’s term to date.  Set aside for now the question of whether conditions are actually “stimulatory” or “accommodative” in absolute terms, but if they are more accommodative now than over the last four years, the difference isn’t large.  Core inflation didn’t pick up over those four years, and it isn’t obvious why it is going to do so now.

The Governor also apparently expects “some increase in capacity pressures”.  One would hope so, given that on the Bank’s own estimates we have had eight consecutive years of a negative output gap.  But it isn’t clear why the Bank expects capacity pressures to increase from here.  They are forecasting quite an increase in residential building, but we’ve already had four or five years of increasing residential investment activity, through two very large shocks to demand for residential investment –  the Canterbury earthquakes, and the large unexpected surge in immigration.  All of that, on top of buoyant commodity prices earlier in the period, wasn’t enough to turn the output gap positive or get the unemployment rate back to more normal levels, or lift inflation back to target.  It isn’t obvious why things should change now –  especially as, like other forecasters, the Bank expects the net migration inflow to fall away quite sharply.

The Governor could be right.  Macroeconomic forecasting is, in many ways, a mug’s game.  But he has been wrong for several years now, as his predecessor was in his last couple of years.  It isn’t obvious that he has a compelling story to tell as to why inflation pressures are finally about to pick up. But if he has such a story it isn’t in the Monetary Policy Statement.

Meanwhile, there is a great deal of complacency. I heard the Governor talk of significant real wage increases, strong tourism, strong immigration, significant building activity, and so on.  All without any sense that per capita income growth has remained disappointingly weak.  Neither the Governor in his comments nor the text of the MPS itself even mention an unemployment rate that lingers at 5.7 per cent, years after the end of the recession.  If anything, the Bank appears to believe that excess capacity in the labour market is already exhausted (see Figure 4.8).

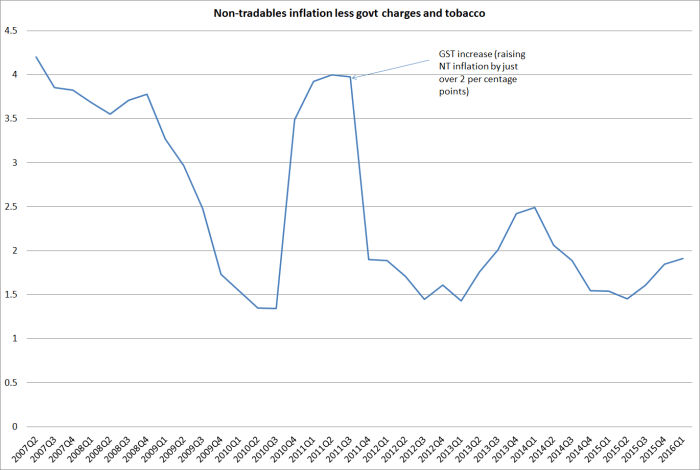
The Governor also made great play of non-tradables inflation.  He is quite right that, over time, non-tradables inflation (or at least the core of it, excluding government taxes and charges) is what monetary policy can really influence.  Even exchange rate effects –  which the Governor weirdly tried to play down –  over the medium-term work by influencing overall pressure on domestic resources and thus non-tradables inflation.  But non-tradables inflation typically runs quite a bit higher than tradables inflation, even in a stable exchange rate environment.  That is partly about the labour intensive nature of many of the services included in non-tradables inflation (hair cuts are the classic example, where there is limited scope for productivity gains).  With an inflation target centred on 2 per cent, the common view among economists inside the Bank used to be that one might expect non-tradables inflation to average perhaps a bit above 2.5 per cent, while tradables inflation might average a bit below 1.5 per cent per annum.  Together, they would be consistent with medium-term CPI inflation (ex taxes etc) of around 2 per cent.

But here is what non-tradables inflation looks like in recent years.  This series excludes government charges (eg the cut in ACC motor vehicles levies) and tobacco taxes (which have been increasing sharply each year).  It doesn’t take out the effect of the 2010 GST effect, but it is easy enough to visually correct for that – it accounts for about 2 percentage points of the inflation rate over 2010/11.

nt ex govt charges and tobacco

There is a bit of variability in the series, but it has been years since this measure of core non-tradables inflation got even briefly as high as 2.5 per cent, let alone fluctuating at or above that level.  And this is the series that should have borne the brunt of the Christchurch rebuild pressures –  which probably explained the increase in this measure of inflation in 2013/14.  Non-tradables inflation is what the Bank can influence. It really needs to be quite a bit higher to be consistent with the target specified in the PTA –  and on current Bank policy, there is no particular reason to think it is going to happen.

I outlined again yesterday my take on how the Governor operates: he is really bothered about the housing market, and really doesn’t want to cut the OCR.  But he can’t afford to see core inflation drift much lower –  he can get away with it holding around current levels (somewhere, in the MPS words, in a 0.9 to 1.6 per cent range) –  so will cut if data surprises really force him to, but not otherwise.  Today was a classic example of that model in action.  In the run-up to the March MPS it was, he said, the expectations survey data that really rattled him.  There has been nothing comparable since and so, mediocre economic performance and weak inflation notwithstanding, there was no OCR adjustment.

Instead, today was all about housing, and financial stability.  Perhaps we were supposed to have forgotten that the FSR was released only a few weeks ago and in his press release on that occasion the Governor began by extolling the resilience of the New Zealand financial system.  Often enough the Governor has been reluctant to comment on financial stability issues in monetary policy press conferences, and it is only three months since I praised him for his response on house prices at the March MPS press conference

And when asked about the impact of a lower OCR on house prices, he succinctly observed “well, that’s just something we’ll have to watch”.  By conscious choice, house prices are not part of the inflation target, either in New Zealand or in most (if not all) inflation targeting countries.  It is one, important, relative price, influenced heavily by a range of other policy considerations.  And if bank supervisors should pay a lot of attention to house prices, and associated credit risks, it is a different matter for monetary policymakers.

All that was long gone today.  It was, in effect, all about house prices and the possible threat to financial stability.  I don’t recall hearing, or reading, anything about stress tests (they’ve been pretty positive), or capital requirements (they seem to have been quite – rightly –  onerous by international standards), or even about the Bank’s benchmarking exercise to better understand how individual banks are modelling similar risks.  High house prices can be a source of risk if they are financed with poor quality lending, backed with inadequate capital.  But there was none of that analysis today.  Instead, there was a regulator champing at the bit to impose even more controls, touting the LVR restrictions to date as “very successful”.  Apparently more LVR controls could be only weeks away –  although of course they will have to consult on any new controls, with a mind open to considering alternative perspectives and evidence –  while loan to income restrictions seem to be a bit further down the track (they are doing analytical work on them, rather than detailed instrument design, or so it seemed from the Governor’s comments).  The Governor really seems to have it in for people buying residential properties for rental purposes, and yet can never quite tell us why.  He reminded us again today that some 40 per cent of property turnover involves such purchasers, but never ever addresses the simple point that in a badly-distorted system where the home ownership rate is dropping towards 60 per cent, the remaining homes have to be owned by someone.

The Governor and Assistant Governor were at great pains to emphasise that monetary policy is required to have regard to “financial stability”.  The relevant phrase isn’t new –  it has been in the Act since 1989 –  but it isn’t quite what the Governor said it is either.  Section 10 of the Act requires that

“In formulating and implementing monetary policy the Bank shall have regard to the efficiency and soundness of the financial system”.

Efficiency is listed first, both there and in the Policy Targets Agreement.  And yet, puzzlingly, I didn’t hear anything today –  or in the FSR press conference a few weeks ago –  about the efficiency of the financial system.  New controls, ever more detailed controls, overlapping LVR and DTI controls, all imposed on some classes of lenders and not on others, some classes of borrowers and not others, are usually considered ways of seriously undermining the efficiency of the financial system.  But the Governor seems not to care.

Perhaps more importantly, in a discussion about monetary policy, neither financial soundness nor financial system efficiency –  nor the avoidance of “unnecessary instability in output, interest rates and the exchange rate” –  are equal objectives with the inflation target.  Price stability is the Bank’s primary statutory objective, and the inflation target centred on 2 per cent in the practical expression of that.  It doesn’t mean headline CPI inflation is, or should be, bang on 2 per cent each and every quarter.  But six years –  with no assurance that even six years will be an end of it –  below target really is too much.  It was, after all, the Governor who added explicit mention of the midpoint to the PTA.

The Governor also found himself on the backfoot over communications, coming on the back of the recent BNZ analysis and yesterday’s Dominion-Post article.  In some obviously-prepared lines, the Governor went to great lengths to argue that there was simply no problem.  For a start, he and his colleagues agreed, people simply hadn’t read his February speech carefully enough  (set aside for a moment that point that if people misread your carefully prepared communication, it probably says something about that communication itself).  Oh, and we shouldn’t be surprised that there had been quite a few surprises in monetary policy lately, because the OCR was actually changing.  He seemed to ignore the fact that, as I noted yesterday, in 2014 the OCR had moved quite a lot and there were no major communications problems.  It got worse when he then argued that if one looked at 2006 to 2010 there were similar surprises –  as if he thought we’d forget that 2008/09 saw one of the biggest global financial crises ever, and huge  –  unprecedented  – OCR changes.  It simply wasn’t a very convincing performance.  The Governor’s communications haven’t been good enough recently.

A journalist asked him about the sharp reduction in the number of on-the-record speeches. I hadn’t really noticed this, but when I checked it was certainly true.  In his early years, the Governor made much of how the Bank was going to do more on-the-record speeches. In 2013 there were 17 and in 2014 there were 18.  Last year there were only eight –  a fairly normal sort of level in pre-Wheeler years – and this year so far there have been only four, only one of which was given by the Governor himself.  The Governor could offer no particular reason for this, but then fell back on a rather petulant anecdote, citing one business journalist who the Bank had asked for comment on the Governor’s speeches.  This journalist had apparently described them as “too complicated and with too many ideas”.  The Governor’s plaintive response was “I hope they get read”.  It was a slightly sad performance.  Unfortunately, it is true that neither the Governor’s speeches nor those of his colleagues really match the standards of those of their peers at the RBA, the Bank of England, the Bank of Canada, or the Fed.  We should expect better –  considered reflections, expressed clearly.  Part of accountability often involves such speeches, especially when –  as with this Governor –  he is apparently so reluctant to give interviews.  Embattled, the Governor appears to have withdrawn to his fortress.

Oddly, John McDermott offered the thought that while the number of speeches had dropped, there had been a “massive increase” in the number of other publications: “we don’t just communicate through speeches”.  I was a bit taken aback by this claim  and went to the website to check.  There does seem to have been a small increase in the number of Analytical Notes (author’s own research, including the standard disclaimer that it doesn’t speak for the Bank) and Bulletin articles (although there the increase seems to relate mostly to financial markets and the regulatory functions).  But there has been a big increase –  perhaps “massive” is not too strong a word –  in the number of Discussion Papers.  This year, so far (five months in), there have been eight published, compared to a typical annual total of six each year in recent years.  But…again, Discussion Papers are authors’ own research, complete with the standard disclaimer. In most cases, DPs are intended as the basis for submissions to academic journals by the Bank’s research staff.  Sometimes they have interesting material, but often –  abstract and introduction aside – they are fairly incomprehensible to someone who is not a specialist in the particular area.  They don’t attract much attention outside academe, and have never –  to my knowledge –  been used as part of official policy communications.   If senior policymaker speeches have a role, publications like DPs aren’t a substitute for them.

All in all, neither the MPS itself nor the press conference were the Reserve Bank anywhere near its best.  They will probably get away with it because the domestic banks seem mostly unbothered about the persistent undershoot of the inflation target.  But they really shouldn’t.  The Board, the Minister and Treasury should be asking hard questions –  both about the substance of policy and its presentation.

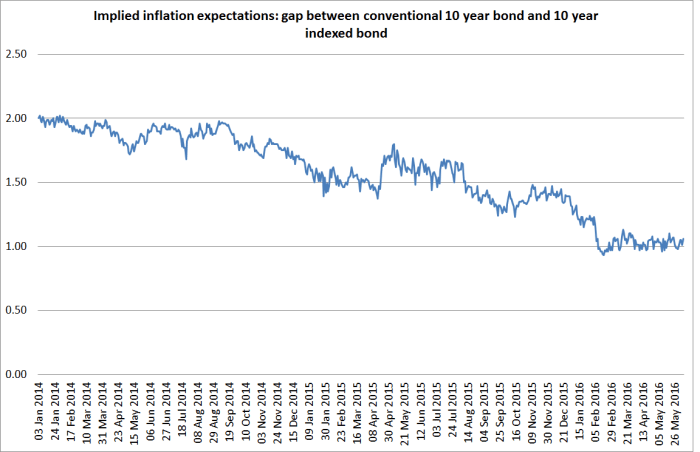
Finally, the Reserve Bank’s “modelling” of long-term inflation expectations got elevated as far as the press release today.  We are assured that these expectations are “well-anchored at 2 per cent” (not even “around” or “near” but “at”).  For these purposes, the Bank uses a couple of surveys of a handful of economists.  It isn’t clear what useful information the results have for current policy, since respondents will reasonably assume that some other Governor, and some other chief economist, will be setting monetary policy before too long.  But it also gives no weight at all to the market-based measure of implicit inflation expectations we do have.

iib breakevens to june 16

125 points of OCR cuts has still not been enough to convince people actually buying and selling government bonds to raise their implied 10 year expectations above 1 per cent.

People just don’t believe –  whether on this measure or in the other surveys – that inflation is going to settle back at 2 per cent any time soon.  They’ve been right to be skeptical.   That should trouble the Bank, and those paid to monitor it.    Expectations surveys aren’t an independent influence on inflation –  often they are a reflection of past actual outcomes –  but the way the Governor was talking today it sounded as though it might take another inflation expectations shock, or perhaps a GDP surprise, to bring about another cut.  The next expectations survey data won’t be available until after the next MPS.


Three months on…

It is three months since, on the morning of the release of the last Monetary Policy Statement, a fortuitous set of circumstances brought to light a leak of the Reserve Bank’s OCR decision.  It hadn’t required any particular devious methods or technologies, and the suggestion –  including from the Reserve Bank’s own lawyer –  has been that it wasn’t the first time it had happened.  Whether that was so or not, the Reserve Bank’s systems were loose enough that it was only a matter of time before, accidentally or deliberately, a leak happened.  And ethics were loose enough at MediaWorks that the leak was apparently seen as acceptable conduct, despite the rules of the lock-up.  It took weeks for MediaWorks to own up, and even now there has been no proper accounting from them as to just what went on.

In an email yesterday about today’s Monetary Policy Statement, someone in the markets noted to me

Still waiting to read your full apology from RBNZ, I live in hope!!

It might be nice, but the words and (in)actions of Graeme Wheeler, and his associates Geoff Bascand, Mike Hannah, and Rod Carr, really speak for themselves.  How did we end up in a situation where these sorts of people govern our central bank?

But I’m still more disturbed about the secrecy with which the Reserve Bank has sought to cloak the whole affair –  telling us just as much as they want us to know.  Answers to a series of fairly straightforward OIA requests, about events that happened two to three months ago, have been kicked out to 1 July –  and such is the Reserve Bank’s track record on the OIA that I’m not optimistic we will get much even then.  Whatever the case for secrecy on some policy matters, a leak inquiry  –  especially one that confirmed an actual leak and prompted major system changes – seems like one of those things where the public should be able to expect a full and open accounting from a taxpayer funded public agency.

Instead, we have them stalling, seemingly averse to transparency and scrutiny.  Among the outstanding matters:

  • We haven’t seen the terms of reference for the leak inquiry
  • We haven’t seen the full Deloitte leak inquiry report, only a short-form public version.
  • We haven’t heard why no penalty was initially imposed on MediaWorks, only for the Governor to later change his mind and indefinitely ban them from Reserve Bank press conferences.
  • We haven’t heard why the Governor chose in his press statement to emphasise the cooperation of MediaWorks when even the short-form report makes clear that it took weeks for that company to own up, and then only when it had been approached by the inquiry team.
  • We have seen no acceptance from the Reserve Bank that its own systems had failed to keep pace with technological change, which left them open to a leak (the consequences of which could have been much more serious than they were).
  • We don’t know whether the Bank has made any serious efforts to find out whether MediaWorks staff had leaked previously, and if they did make the effort to seriously pursue the matter, what the answers were.
  • We don’t know how much involvement the Bank’s Board –  supposed to operate at arms-length from management to hold the Governor to account – had in the handling of the leak, and 14 April press statement.  The documents that have been released suggest, which shed a partial light on the matter, suggest that the answer was “too much”.
  • We haven’t seen the papers the Reserve Bank considered in reviewing the options regarding the future of lock-ups, press conferences etc.

I’m not sure what the Bank has to hide.  The answer may well be “not that much at all”.  If so, the obstructiveness and resistance to an open accounting for their handling of a serious breach is perhaps more just a reflection of an ingrained resistance to see themselves as a public body with all that means.  In particular, that they are subject to the Official Information Act as much as to any other law, and are a body from whom the public should reasonably expect a full and open accounting.  Mistakes happen, errors are made, system flaws come to light.  That is what happens with human beings and human institutions.  Embarrassing as they sometimes are, accidents  and errors will happen.  But how an institution – and a powerful individual – recognizes, accepts responsibility for, and responds to such mis-steps can tell us a lot.

As journalists and MPs gather today to scrutinize the Governor, perhaps they might like to reflect on some of this.


Some matters the Monetary Policy Statement could address

Tomorrow sees the release of the latest Reserve Bank Monetary Policy Statement.  My “rule” for making sense of the Governor’s monetary policy choices at present is that he really doesn’t want to cut the OCR –  and hasn’t for the last year –  as much because of the housing market as anything, and cuts only if reality mugs him, in the form of some key data that he just can’t escape the implications of.   I haven’t seen that sort of data in the last month or two.  Given the terms of the Policy Targets Agreement, it should have been an easy call to cut the OCR again, but it probably hasn’t been.

There is a nice, fairly trenchant, column from Hamish Rutherford in the Dominion-Post this morning on the Governor’s communications “challenges”.  I’m very sympathetic to the line of argument Rutherford is running (including his use of some BNZ analysis of monetary policy surprises).  My only caveat is that, in my view, getting policy roughly right is better than being predictable and wrong.  There were no major monetary policy surprises or communications problems in 2014.  But the repeated increases in the OCR were simply bad policy.  Grudging as it may have been, and badly communicated as it undoubtedly was, the OCR has at least been moved in the right direction for the last year.

In this post, I wanted to highlight some issues that it would be good to see the Reserve Bank change its stance on in its statement tomorrow.   If I really expected they would do so, I probably wouldn’t bother with the post, but perhaps there will be a surprise in store.  Many of them have to do with countering that persistent sense, pervading Bank documents, that the economy is doing just fine.  The Reserve Bank has an inflation target, not an economic performance one, but the argument that all is fine in the economic garden has been used repeatedly to justify keeping the OCR as high as it has been.  As a reminder, even today, in real terms the OCR now is still higher than it was when the ill-judged 2014 tightenings began.

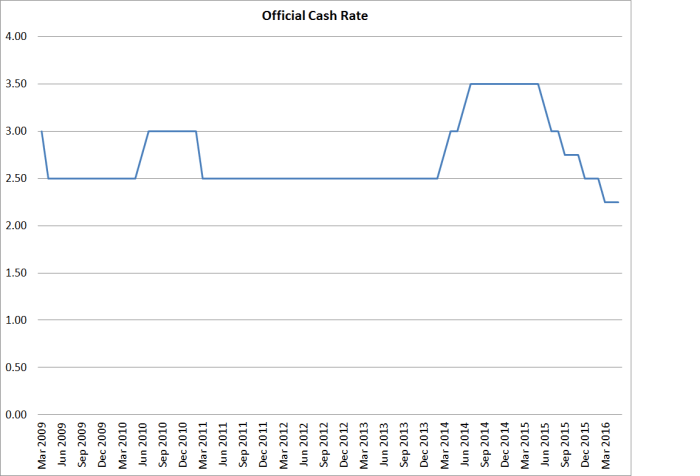
The first is the constantly repeated claim that monetary policy in New Zealand and in other countries is highly “stimulatory”.  It appears in almost every Reserve Bank policy statement or speech, and appears to be based on nothing more than the undoubted fact that interest rates (real and nominal) are currently low by longer-term historical standards.  That doesn’t make them stimulatory.  It has now been more than seven years since the rate cuts during the 2008/09 recession came to an end.  For most of the time since then the OCR has been at 2.5 per cent.  Today it is at 2.25 per cent.

ocr

Adjust for the fall in inflation expectations (around 60 basis points over 7 years on the Bank’s two-year ahead measure), and if anything real interest rates are a bit higher than they’ve typically been since 2009.

The Reserve Bank appears to still believe that a normal (or ‘neutral’) short-term interest rate might be around 4.5 per cent.  But there is nothing substantial to back that view.  The fact that inflation has been persistently below target for several years, in a weak recovery with persistently high unemployment, argues against there being anything meaningful to a claim that 4.5 per cent is a “neutral” interest rate –  a benchmark against which to measure whether monetary policy is “highly stimulatory” or not.  Better, perhaps, to look out the window, and check the current data.  That isn’t always a safe strategy, but it is better than clinging to old estimates of unobservable structural features of the economy.  Having moved to a flat track in its interest rate projections, the Bank appears to be backing away from putting much practical weight on the high estimates of a neutral –  or normal –  interest rate.  But the rhetoric still seems to matter to the Governor, and his reluctance to cut the OCR seems, in part, influenced by his sense that interest rates are already “too low”.  He has –  or at least has produced –  nothing to support that sense –  whether for New Zealand, or for most other advanced other countries.  Better to put to one side for now any estimates of neutral interest rates, lose the rhetoric, and respond to the observable data as they are.

The second point I would like to see signs of the Reserve Bank taking seriously is the persistently high unemployment rate.  At 5.7 per cent it has barely changed in the last year.  I noticed that the OECD in its new forecasts seems to treat 5.8 per cent as the natural rate of unemployment (or NAIRU) for New Zealand.  Few others do, and both the Treasury and the Reserve Bank have tended to work on the basis that our regulatory provisions (welfare system, labor market restrictions etc) are such that the unemployment rate should typically be able to settle nearer 4.5 per cent without creating any inflation problems.    Someone forwarded me the other day a market economist’s preview of this MPS, noting  with some surprise that the unemployment rate wasn’t mentioned at all.  I sympathized with the person who sent it, but pointed out that it was the Reserve Bank the market economists were trying to make sense of, and the Reserve Bank gives hardly any attention to this key indicator of excess capacity in the labour market.   Reluctance to cut the OCR might make more sense if the unemployment rate were already at or below the NAIRU.  As things stand for the last few years, there is an inefficiently large number of people already unemployed, and the Governor’s reluctance to cut just condemns many of them to stay unemployed longer than necessary.  The Governor should at least recognize that trade-off, and explain the basis for his judgements.

The third point it would be good to see the Reserve Bank explicitly addressing is the mistakes it has made in monetary policy over the last few years.  Depending on the precise measure one uses, inflation has been below the target midpoint –  a reference point explicitly added to the PTA in 2012 – for many years now.  Some of that might not have been easily foreseeable.  Some of it might even have been desirable in terms of the PTA (if the one-off price shocks were all one-sided, which they weren’t).  Humans  –  and human institutions –  make mistakes, and one test of a person or institution is their willingness to recognize, respond to, and learn from their mistakes.  Since the Governor is unwilling even to acknowledge that there were any mistakes, it is difficult to be confident that he or the institution has learned the appropriate lessons and adapted their behavior.

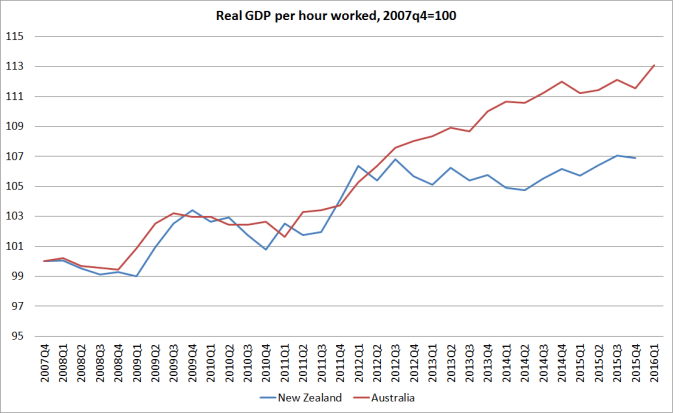
The fourth point it would be good to see the Reserve Bank acknowledge is how poor New Zealand’s productivity and per capita real GDP performance has been.  For example, here is real GDP per hour worked for New Zealand and Australia since the end of last boom.

real gdp phw june 16

Maybe data revisions will eventually close the gap, but that is the data as it stands now.

And here is per capita real GDP growth rates.

real gdp pc aapc

A pretty dismal recovery phase, by comparison with past cycles.

My point is not that monetary policy can or should target medium-term productivity growth or real GDP growth, but simply to illustrate the climate in which the Governor has been making his monetary policy calls, holding the OCR consistently higher than the inflation target required.  He likes to convey a sense –  akin to the tone of the government’s own “glee club” –  that everything is fine here but actually it is pretty disappointing.  Perhaps holding interest rates higher than was really necessary might make a little sense if the per capita GDP growth or productivity growth had been really strong –  leaning a little against the wind –  but they’ve been persistently weak.  Again, the Governor should explain the basis for his trade-offs, not pretend they don’t exist.  We’d have had a better cyclical performance if the OCR had not been kept so high.

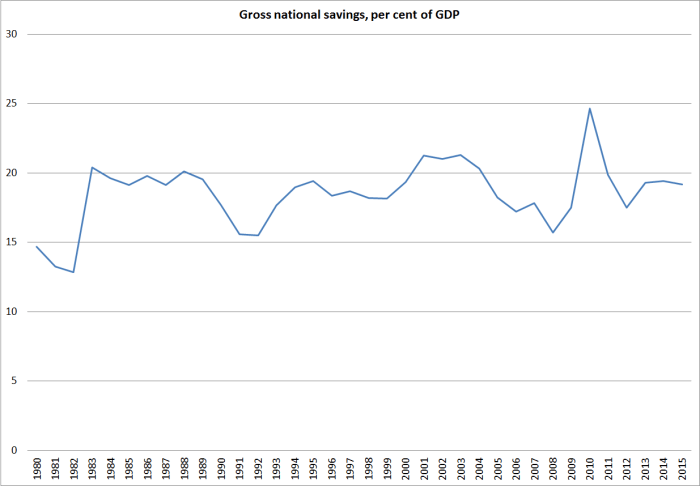
I could go on.  The Governor could usefully highlight that, although he is uncomfortable –  as everyone should be –  with current house prices, there is nothing in the turnover or mortgage approvals data (per capita) to suggest an excessively active market (high turnover is often associated with excessive optimism, and unjustifiably loose credit conditions).    And there is nothing in the consumption or savings data to suggest that high or rising house prices have spilled over into unwarranted additional consumption, putting upward pressure on inflation more generally.  I showed the chart of private consumption to GDP in a post yesterday –  stable over almoat 30 years, despite really large increases in house prices and credit.  This chart shows the national savings rate, since 1980.  There is a little year to year variability, but again no trend over 35 years now.

national savings

House prices are a national scandal, but there is no reason to think they should be treated as a monetary policy problem.

I do think the OCR should be lower –  perhaps 50 or 75 basis points lower than it is now.  In time, the Reserve Bank is likely to recognize that.  But my point here is really that when he makes his choices –  and they are personal choices, not those of a Committee –  the Governor should, and should be seen to, engage with world as it is, not as he might wish that it would be.  In that world, the unemployment rate lingers high, productivity and income growth have been persistently weak, inflation has been persistently below target, wage inflation is weak, house price inflation isn’t splling into generalized inflation pressures, and historical reference points around normal or neutral interest rates seem increasingly unhelpful.  Perhaps there is a good case for keeping the OCR at current levels, but a good case can’t simply pretend everything is rosy in the garden or that –  finally –  everything is just about to come right.

(And all that without even mentioning the exchange rate which is not only high by historical standards –  again raising doubts about those “stimulatory” claims for monetary policy –  but this morning is at almost exactly the same level it was at a year ago.  The fall in the exchange rate from the 2014 highs was supposed to help get inflation back to target.  It was a half-plausible story when the fall first happened.  It is less even than that now.)


$492500000000

That’s the Herald’s headline for its new “Nation of debt” series, where they state “New Zealand now owes almost half a trillion in debt”.

Whatever “New Zealand” and “owes” might mean.

The New Zealand government has some debt –  $109 billion of it, in gross terms, according the Herald’s numbers, spread between central and local government.  Of course, these very same entities have financial assets as well.  The financial assets aren’t as large as the financial liabilities, but by most reckonings the New Zealand public sector isn’t particularly indebted.

Another way of reckoning ‘New Zealand’s debt might be the amount New Zealand firms, households and governments owe to foreigners.  That isn’t $500bn, but –  according to Statistics New Zealand – $247 billion (gross).  Again there are some assets on the other side.  And actually the net amount of capital New Zealand resident entities have raised from abroad is largely unchanged, as a share of GDP, for 25 years.  It is quite high by international standards, but the ratio isn’t going anywhere.

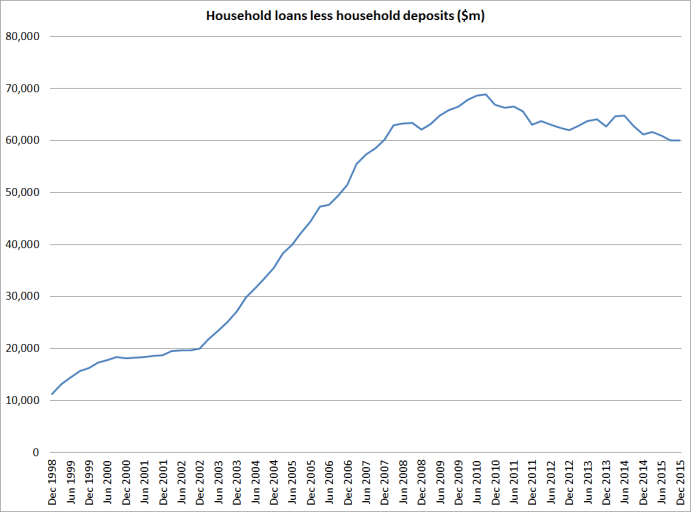
But the Herald chooses to focus simply on the gross debt of New Zealand entities, and pays no attention to what might be going on elsewhere in the balance sheet.  Since they end up focusing on households, lets do that.  The Herald focuses on $232.9 billion of gross household debt, but pays no attention to what has been going on with household deposits.  Here is the chart, using the Reserve Bank’s household statistics, of the gap between household debt and household deposits.

household debt to deposits

It rose very rapidly in the boom years of the 2000s, but has gone nowhere at all for seven or eight years now.   GDP has gone up a lot in that time, so that the ratio of this gap (between loans and deposits) to GDP is materially lower than it was back in 2007/08.    This isn’t some novel point –  the Reserve Bank has been mentioning it in FSRs for years now.

Even ignoring deposits, household debt to GDP itself has gone nowhere for eight years, after a huge increase in the previous 15 years.

household debt to gdp

Probably these ratios will increase somewhat over the next few years.  HIgh house prices, and a housing stock that turns over only quite slowly,  does that.  Here is a chart I ran a while ago illustrating how debt to income ratios keep rising for quite some time –  all else equal –  even if there is just a one-off increase in house prices.

In the chart below I’ve done a very simple exercise. I’ve assumed that at the start of the exercise, housing debt is 50 per cent of income, house prices and incomes are flat, and people repay mortgages evenly over 25 years. Only a minority of houses is traded each year, but each year the new purchasers take on new debt just enough to balance the repayments across the entire mortgage book.

And then a shock happens – call it tighter land use regulation – the impact of which is instantly recognized, and house prices double as a result. Following that shock, house purchasers also double the amount of debt they take on with each purchase, while the (now rising) stock of debt continues to be repaid in equal installments over 25 years.

In this scenario remember, house prices rose only in year 1. There is no subsequent increase in house prices or incomes. But this is what happens to the debt to income ratio:

debt to income scenario

None of this is reason to be indifferent to the scandal of house prices, especially those in Auckland.  But high house prices –  that result mainly from the interaction of population pressures and the thicket of land use restrictions which rig the market against the young – tend to increase the amount the young need to borrow from, in effect, the old to get into a first house.  It is quite risky for the borrowing cohort, but on the other side are much higher financial assets held by the older cohort, who sold the young the houses.  “New Zealand” isn’t more indebted –  one significant cohort of New Zealanders have much more debt, and others have much more financial assets.  And that outcome is mostly down to choices made by successive governments.

The Herald is also keen to run the line that people are treating their houses like ATMs –  drawing down on the additional equity to boost consumption.  No doubt some are –  and for many it will be quite rational to do so.  If you are 60 now, living in Auckland, and thinking of moving to Morrinsville or Kawerua to retire, you might as well take advantage of the rigged housing market now and spend some of your equity.  On the other hand, people trying to get on the housing ladder are having to save ever more to get started in the market (through some combination of market constraints and regulatory restrictions).  But whatever the case at the individual level, here is a chart I’ve run a couple of times recently, showing household consumption as a share of GDP.

household C to GDP

If you didn’t already know there had been a massive increase in house prices, and gross household debt, over these decades, there is nothing in overall consumption behavior to suggest a problem (or even an issue).  High house prices don’t make New Zealanders as a whole better off, they simply involve redistributing wealth from one cohort to another.  If they don’t make New Zealanders as a whole better off, we wouldn’t expect to have seen a surge in consumption.  And we don’t.

I’d hate to be one of the young taking on mortgages of the staggering size that are all too common today.  Even if house prices never come down much –  quite plausible if the land supply mess is never properly fixed –  they face a heavy servicing burden for decades.  If house prices do fall a lot, those people risk carrying an overhang of debt that could make it all but impossible to move.  And some risk of serious distress if the borrower were to be out of a job for very long.

But it isn’t “New Zealand” that owes this money.  It is one lot of New Zealanders who owe it to another lot of New Zealanders, in a market rigged by governments.  Fortunately –  and I didn’t see this in the Herald story –  even our Reserve Bank (constantly uneasy about debt and housing) has repeatedly run severe stress tests and found that the banking system is robust enough to cope with even some nasty adverse shocks.  The same, of course, won’t necessarily be able to be said for all the borrowers if something very bad does happen.


Thinking about changing immigration policy

I was going to write about the Reserve Bank’s forthcoming Monetary Policy Statement, but discussion around immigration policy continues in the media, so I thought the topic might be worth one more post.

There are all sorts of different numbers tossed around when immigration and net migration are debated.  Different numbers are relevant for different purposes, and things aren’t greatly helped by the fact that MBIE does not release regular monthly numbers on visa approvals, and so the month to month discussion is often dominated by SNZ’s permanent and long-term (PLT) migration numbers.

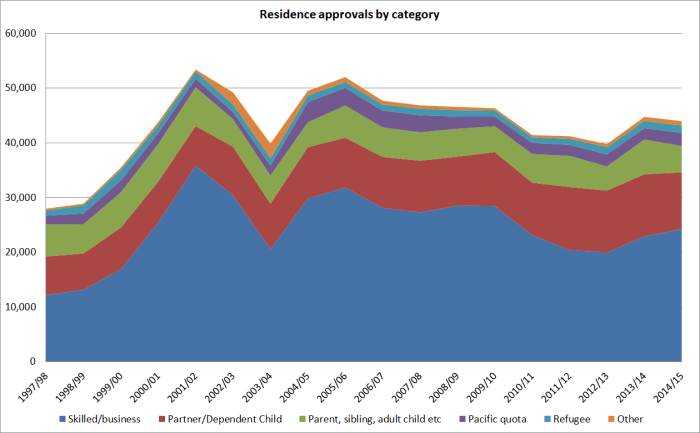
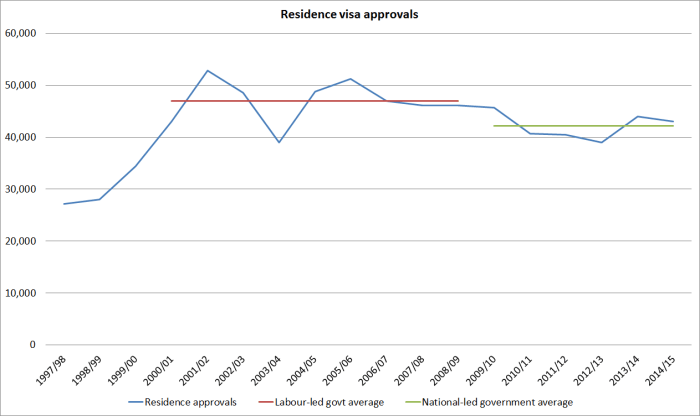
The centerpiece of our medium-term immigration policy is the residence approvals target: 45000 to 50000 people per annum.  That target hasn’t been changed for a long time –  it was the previous government’s target and the current government’s.  It is a large number by international standards: as I noted yesterday, in per capita terms it is around three times the number of green cards the US issues each year.  Actual approvals fluctuate a little from year to year –  I showed the chart in yesterday’s post –  but not very much, and the rules and points are tweaked a bit over time to keep near the target.  Debates about the medium-term implications of immigration, whether for population or economic performance, should really concentrate on the appropriate target level (and composition) of residence approvals.   It is important to appreciate that these days the bulk of people getting a residence approval are already in New Zealand (around 70 per cent) –  having arrived on, for example, a student or (temporary) work visa.  In most cases, granting a residence approval changes the legal status of the individual, and does not involve a new border crossing.

But, as I noted, the PLT numbers dominate the headlines.  PLT numbers (which importantly include New Zealand citizens –  not a matter of immigration policy) are only estimates.  We know exactly how many people come across our border (in and out) each month, but the split between permanent and long-term on the one hand, and short-term on the other, relies entirely on the self-reported intentions of those filling in the arrivals and departure cards.  Plans change.  As I’ve highlighted previously, Statistics New Zealand themselves have done useful work showing that at times the reported PLT numbers have been quite substantially different from the actual numbers who have come or gone for more than 12 months (I discussed this work here .  It is a great shame that SNZ is not adequately funded to produce these refined estimates on a regular basis.

Using the PLT data, one can look at either total arrivals or the net flow.

Here is total (self-reported) PLT arrivals by visa type for the last decade or so (the period SNZ provides the data for).

plt arrivals

Among other things, this chart illustrates my point above about residence visas.  About 43000 residence approvals were granted in the last year, but when people crossed the border to enter New Zealand only around 14000 arrived in the country already holding residence visas.  In granting residence approvals, policy now puts a high weight on people already having a job and being established in New Zealand, so most people who get residence approvals come first on student or work visas.  Even over this decade, one can see the rising share of these temporary visas.  Of course, not all these people stay permanently (or would want to).

And it is also worth highlighting the “not applicable” category, which captures New Zealand and Australian citizens who don’t need a visa to come and live here.  Over these 11 years, that number has fluctuated between 28000 and 36000 per annum –  not huge variation.  There is much more variation in the departures of New Zealand citizens: over the same period that total has fluctuated between 34000 and 62000 per annum.

Total PLT arrivals probably could probably be managed, more or less, with a policy target.  But it wouldn’t be very sensible to do so.  If our universities really do offer a great tertiary education there is no obvious reason why we’d want to put a policy cap on the numbers coming.  It is just another export industry.  The policy focus should be on the number, and composition, of the people (non New Zealanders) we allow to live here permanently.

What about net PLT flows?  They fluctuate enormously.  Here is the chart of annual flows since 1921.

net plt flow

Bear in mind (a) that the population is much bigger now than it was in earlier decades, and (b) that SNZ work suggesting that self-reported PLT flows don’t always accurate represent true permanent and long-term inflows. Importantly, using that analysis, the 2002/03 boom at peak was larger, as a share of population, than the current net inflow.

The average PLT inflow over the last 25 years has been just under 15000 –  a large outflow of New Zealand citizens, and a much larger inflow of non New Zealand citizens.  Perhaps this is the sort of number Winston Peters has in mind when talking about a target inflow of 7000 to 15000?

The net PLT flow cannot be managed by policy at least over short to medium-term horizons.  Cutting the residence approvals target, as I have proposed, would markedly reduced the average net inflow over time, but the cycles in net PLT would probably be about as large as ever –  just cycling around a lower mean.    Much of the variation is the change in the number of New Zealanders leaving (see above).  As I noted yesterday, when politicians talk of short-term caps or (as I heard Andrew Little call for this morning) “more agile” management of the system, it isn’t likely to be a recipe for more stability in PLT flows, but a risk of creating more (pro-cyclical) instability.   Forecasters of the net PLT flow 12 to 18 months ahead have a shocking track record.

Export education services have been flavour of the month in this debate for a while now, and I heard Steven Joyce on the radio this morning talking about how any serious cutback to immigration could put tens of thousands of jobs at risk in the export education sector.

To the extent that people are coming to study in New Zealand for the quality of educational products New Zealand firms and institutions have to offer, the Minister’s comments are almost entirely wrong.  People choose to study at Harvard or Stanford or Oxford because they are top-notch universities.

But that doesn’t look like the New Zealand story.  Here is a chart of student visas by the type of institution the student is studying at.  Unfortunately MBIE provides this data only back to 2005/06.

student vsias by type

All the growth in recent years has been in the polytech and private training establishment sectors.  I’m sure there are some excellent institutions in that sector, offering really high quality educational services rivalling the best in the world.  But one might also suspect that the stories of people using study here mostly as a way of being better positioned to get a residence visa, financed by the recent change of policy allowing students and partners to undertake a lot of paid work while they are here, has more than an element of truth to it.  If so, it isn’t that our export education industry is hugely competitive and successful, it is just another case of “export incentives” at work.  We dish out cash to the film industry, and in this industry a leg up on the residence approvals process is the subsidy.  Subsidised export industries certainly get a benefit themselves, and perhaps that benefits the people working for them.  They rarely benefit New Zealand in the long haul.  We should have learned that lessons decades ago.

Again, if our education sector was attracting real top-notch people, and encouraging them to apply for residence, there might be a net gain for New Zealand (lifting the average quality of the people we decide to let stay).  But as Treasury has noted, we aren’t doing that well at attracting really highly-skilled people.  The recent Fry and Glass book reported that we are doing less well on that score than either Australia or Canada.  And, as a reminder, these were the top five occupations for the skilled migrants last year.

Chef
Registered Nurse (Aged Care)
Retail Manager (General)
Cafe or Restaurant Manager
ICT Customer Support Officer

Those five occupations alone made up 25 per cent of the skilled migration approvals.  And skilled migrant approvals made up only around 60 per cent of the total residence approvals –  others, presumably, were not even reaching that standard.

If we were to look at changing our target level of residence approvals there are some significant questions to address.

One is how fast to make any change.  I’ve argued for pulling the target down from 45000 to 50000 per annum to 10000 to 15000 per annum, but haven’t taken a strong view on a transition path.  The housing market stresses, and long-term productivity underperformance, are sufficiently serious that there is probably a reasonably case for making the change in one step.  I wouldn’t favour a very gradual adjustment –  say, pulling the target down 5000 a year –  partly because it would be too hard to distinguish the effects of the policy change from all the other stuff going on. A middle ground might be to, say, halve the residence approvals target for five years, with a full review of the costs and benefits of that approach to be undertaken at the end of the period.

The other key question is what the composition of a lower approvals target might be.

Here is a chart showing the breakdown of residence approvals, using MBIE data.

res approvals by category.png

It would be very easy to simply squeeze out skilled migrants (and their spouses and children).  Personally, I think that if we are serious about immigration serving an economic role we would need to think hard about some of the other categories.  For example, in the most recent year, around 10 per cent of residence approvals went to parents (presumably generally quite elderly) of people now living here, with a few hundred additional approvals for adult children and siblings.  There is little or no prospect of economic gain to New Zealand from this migration –  and no obvious humanitarian case either –  and a pretty good chance that (unlike most skilled migration) the net fiscal cost of these migrants will be quite substantial.

We also approved residence for 1500 people under two Pacific Island access categories.  These are presumably people who would not have qualified as skilled migrants.  Perhaps one can accommodate those sorts of numbers within a 45000 to 50000 annual target, for historical or foreign policy reasons.  Much harder questions would have to be asked if we brought our overall immigration numbers more into line with international practice.

I don’t have a particular view on appropriate refugee numbers.  If anything, at present, there is a push to increase that quota at present.  That is a legitimate choice for a country to make, but most probably to do so would further reduce the chances of the immigration programme making a meaningful economic contribution to New Zealanders.  Then again,  I read the evidence as suggesting that immigration mostly benefits the migrant, and that countries are fooling themselves if they treat large scale immigration as (as MBIE does) some sort of “economic lever” to lift medium term domestic economic performance.

There is a lot of talk about how disruptive a cut in the immigration (residence approvals) target could be. No doubt that is true for firms and sectors that are focused on meeting the needs of a rapidly rising population – be it builders or whatever (furniture and carpet shops). But a lot of that argument is built on the fallacy the immigration eases overall labour shortages. If anything, it exacerbates them: the short-term demand effects of immigration outweigh the supply effects.

Let’s say, as a deliberately extreme example, that my preferred policy – cutting the residence approvals target to 10000 to 15000 per annum was adopted tomorrow. What might we see over the following few years?

I noted yesterday that we would see house and urban land prices a lot lower, especially in places that have experienced considerable population pressure in recent years.

We’d also see a lot less building activity – across all types of construction. We’ve seen this before – when net migration was very low in the late 1970s and early 1980s the construction share of GDP was much lower than it had been before or since. Quite possibly, the PTE component of the export education industry would take a hit.

But all of these pressures would be recognised in the Reserve Bank’s economic forecasts, and monetary policy would adjust to take account of the weaker demand pressures. In fact, markets would be likely to adjust even before the Bank, so long as the policy change was well-signalled and treated as credible. Real interest rates would fall, and so would the real exchange rate. Our exchange rate stays high only because New Zealand pretty consistently offers a yield premium over those on offer in other currencies. We’d see a classic case of resource-switching. The cost of capital to firms developing businesses here would be lower, and the lower real exchange rate would be particularly attractive to firms looking at opening, or expanding, in the tradables sector. Recall, that per capita sector production has not increased for 15 years. This policy change would help reverse that shocking record. It seems likely that regions outside Auckland – in many cases, much more export focused, would get a particularly substantial boost.

What about the labour market? As I’ve already noted, high levels of immigration don’t ease overall labour market pressures, they exacerbate them in the short term. So, all else equal, a lower rate of residence approvals (not simply offset with more work visas approvals) would ease labour market pressures to some extent (offset, of course, by the easier monetary policy). Perhaps some sectors might still find it difficult to get the right people. That is what the price mechanism is supposed to deal with: higher wage rates for particular skills or sectors will, over time, draw people into those occupations. There is a price at which New Zealanders will be aged care workers or dairy hands. For firms in the non-tradables sectors, that higher price might be difficult to absorb. In a sense that is part of the point: reorienting the economy towards the tradables sectors puts pressure back on the non-tradables sectors. For firms in the tradables sectors, the lower exchange rate provides a margin that can accommodate any wage pressures that might develop in individual sectors. But I’d be surprised if those pressures were large or systematic: after all, many of the people who have been employed in sectors responding to the rapidly rising population have to find some other place to work.

Over five years, I’d expect we’d start to see material gains for New Zealanders as a whole. More affordable house prices, a larger share of the economy selling to the rest of the world, reduced pressure on unskilled New Zealanders, and so on. Successful economies typically succeed by finding ways of selling more and better stuff to the rest of the world. We’ve failed on that count (in per capita terms) for decades, but we can turn it around. I’d expect that five years after such a policy was adopted we’d have started to see our productivity performance markedly improving relative to those in other advanced countries. If global productivity performance was still weak, ours might still not be all that we’d like, but we’d almost certainly be doing less badly than our peers. The gaps between productivity levels in New Zealand and those abroad are so large that it will take decades to reverse them. But as we do, we might even find ourselves in the position the Irish finally found themselves in last decade – the huge diaspora finally started to come home.


Immigration: some follow-up points

Yesterday’s Q&A discussions on immigration seem to have attracted quite a bit of coverage.

Of course, most of that focused on the comments made by Winston Peters, and I don’t have anything much to say about those except to note two things.

First, I was interested to hear him talk of targeting 7000 to 15000 annual migrants, which was quite similar to my suggested target for residence approvals of perhaps 10000 to 15000 per annum.  The United States issues around 1 million green cards a year, and as the US had about 70 times our population that is about the same rate of per capita immigration as would be implied by my 10000 to 15000 annual range.  It isn’t a level that amounts to shutting the door.

Second, Peters has twice before been a senior minister and has never made the rate of permanent immigration a central issue in negotiations to form a government. Perhaps this time will be different.

Of my comments, most of the coverage has been around the suggestion that if the residence approvals target was cut as I suggested, house prices might be 25 per cent lower in a couple of years.  It wasn’t intended as a precise estimate, more an indication that population growth (and especially unexpected changes) make a material difference to house prices in markets where the supply response to impaired by the thicket of land use and building regulations.  However, it is quite a plausible estimate, consistent with some past empirical research on the link between population change and New Zealand house prices.

A decade ago, Coleman and Landon-Lane, in work done at the Reserve Bank, estimated that a 1 per cent shock to the population would shift house prices by 10 per cent, and more recently Chris McDonald’s Reserve Bank work produced not-dissimilar   estimates (especially for non New Zealand migrants).   Adopting my proposal to cut the residence target by 35000 per annum would, all else equal, lower the population by 1.5 per cent in the first two years.  But, more importantly, it would materially lower the expected future population, and asset markets (such as the urban land market) work on the basis of expectations.  Over a decade, again all else equal, the population would be around 7.5 per cent lower on my proposed policy than on current policy.  All else equal, urban land prices would be much lower.  Of course, all else is never equal, and with less population pressure some of the pressure to liberalise housing supply would dissipate.  But the direction of the effect on house prices is pretty clear, and the magnitude would almost certainly be quite large.

Perhaps one thing that disappointed me a little about yesterday’s programme was that discussion tended to focus on the immediate cyclical pressures, and especially those on Auckland house prices.  I guess those issues are most immediately salient, especially in Auckland, and perhaps most easily accessible to a lay audience.  My own arguments have tried to focus (a) not on the cycles in net migration, much of which are about New Zealanders coming and going, but on the trend target level of residence approvals, and (b) on the impact of New Zealand’s disappointing overall economic performance (ie the continued trend decline, over many decades, in our relative productivity).  We could fix up the land supply market –  and should –  and many of those questions and issues would, almost certainly, remain outstanding.  That said, when the advocates of the current policy can show so little evidence suggesting real economic gains to New Zealanders (as a whole) from our really large scale immigration policy (repeat, policy – the target level of residence approvals) then the appalling house price situation cries out for winding back the level of migration approvals, as one way of mitigating the adverse effects of the land use restrictions.    One could envisage an alternative world in which the real economic benefits of large scale immigration were large, clear, and demonstrable, and yet the housing market was still severely dysfunctional.  In that world, there would be some nasty potential tradeoffs if reform of land supply couldn’t be achieved.  But we aren’t in that world.  Here, it looks as though winding back migration approvals might well improve productivity prospects and improve housing affordability.   There would, and will, always be cycles in net measured migration, but the policy component is relatively easy to adjust, and to maintain at a different target level (lower or higher) than we’ve had for the past 15 years.

I was pleasantly surprised at the moderate and reasoned approach the Q&A panel took to the immigration segment.  They recognized that there are some real issues that need rational and thoughtful debate.  Nonetheless, they all still seemed in the thrall of the idea that “skill shortages mean we need migration, just perhaps a “better quality” of migrant”.   There are really just two points that need to be made in response.  The first is that empirical research suggests –  and historical casual empiricism does too –  that an influx of migrants adds more to demand rather than to supply in the short-term.  People who live in a modern economy need lots of real physical capital, and it doesn’t build itself.  So although an individual migrant might ease an individual employer’s problem, in aggregate high immigration simply further exacerbates any existing excess demand for labour (skilled or not).  Economists have recognized that for decades.  It doesn’t, of itself, make immigration a bad thing –  long term gains might still make it worthwhile –  but immigration isn’t a way of dealing with systematic skill shortages.    By contrast, a flexible domestic labour market is quite a good way: changing wage rates should signal difficulties in attracting people to particular roles/regions.  It doesn’t work overnight, and it doesn’t work in aggregate if the economy is overheating, but it works when given the chance.

The panellists also seemed taken with the idea that more should be done to get more of the migrants who do come to go to regions other than Auckland.  That seems, at least in part, to reflect a sense that something is wrong about things in Auckland (whether short term or long term) and perhaps a sense that a more successful New Zealand is likely to be one less strongly skewed away from the regions. But it risks leading to even more wrongheaded policies.  We’ve already seen that last year, when the government amended the rules to give additional bonus points to people with job offers in the regions.  Unfortunately that has the effect of lowering the average quality of the migrants who get in.  The residence approvals target is largely fixed, and the changes in the scheme rewards those who can get to particular locations, not either (a) the most highly-skilled migrants, or (b) the most rewarding and productive New Zealand jobs.  Auckland’s economic performance has been quite disappointing, suggesting it isn’t a natural place to funnel ever more people into.  But that doesn’t suggest that the solution is to funnel more people to other places instead.  It suggests focusing on the whole economy –  in particular, getting the real exchange rate sustainably down –  and letting a rather smaller number of total permanent migrants locate where the jobs and rewards are best.  In that sort of world, Auckland’s population might be materially smaller than it would be on current policy, but the population of the regions might not be much larger.  But the share of the regions in overall economic activity would be larger than it is now.  Better to cut the overall residence approvals target, and focus in on a modest number of really highly-skilled people.  The regions aren’t short of people, but Auckland seems to be awash in them (relative to the high-returning opportunities that seem to exist in Auckland).

As a final observation on the Q&A discussion, I was interested in Andrew Little’s response to questions about immigration.  He continues to toy with the idea of some sort of short-term cap on migration. I don’t think that is particularly sensible or meaningful.  No one can accurately forecast short-term fluctuations in net migration (ie the combination of New Zealanders and foreigners) and if those fluctuations can’t be forecast, one can’t run meaningful short-term caps. In the nature of things, and well-intentioned as they might be, they would simply risk exacerbating the short-term cycles in net migration: pull back approvals when net migration was at a cyclical peak, and by the time those changes took effect, often enough the natural cycle would have turned down anyway.  And vice versa when net migration is at a trough.  We are much better to run a stable and predictable programme of residence approvals, and live with the natural variation that results mostly from New Zealanders coming and going.    In my view, the target level of approvals should be lowered quite substantially, but wherever it is set it shouldn’t be messed around with –  up or down –  in response to short-term cyclical pressures.

But my concern about Little’s comments was more about the underlying message.  Twice in the space of thirty seconds, he repeated the line that “New Zealand has always been a country dependent on bringing in skills from abroad”, stressing that he would never want to change that.  It is simply a mistaken model of growth.  The prosperity of any country depends primarily on some combination of the natural resources it has and, most importantly, on the skills and talents of its own people, and the institutions (political and economic) that those people nurture.    That was true of the United Kingdom or Holland centuries ago, it was true of the United States century or more ago, it was true of twentieth century New Zealand, and it is true of every advanced successful country today.  Of course, every country draws on ideas and technologies developed in other countries. In some cases,. immigration may even have helped the recipient country a bit –  but any such gains look to be quite small – but prosperity depends mostly on a country’s own people and own institutions.  The line Little is running is certainly consistent with the implicit stance of the New Zealand elite, across the main parties, but there is little or no empirical foundation for it.  Indeed, it risks sounding like a cargo-cult mentality –  waiting for just the right people from over the water to come and bring us prosperity.  Things simply don’t work like that.  It is a shame that our political leaders aren’t willing to put more faith in the skills, talents, and energies of our own people and firms, rather than (so it seems) wanting to “trade us in” for some better group of people.  Countries don’t get successful by bringing in better people: rather, successful countries can afford to bring in more people, if they choose.

In this morning’s Herald, the other key prominent academic in the liberally-funded (by MBIE) CaDDANZ project, Professor Paul Spoonley of Massey, has an op-ed championing the current immigration policy.  It probably warrants a post of its own, but his bottom line seemed to be “keep the faith”.

Spoonley starts with this:

The International Labour Organisation estimates a 1 per cent increase in population expands GDP by between 1.25 and 1.50 per cent.

I’m not sure the source of this estimate, but it is a huge effect.  Stop and think about what it means for New Zealand, if it were true over the medium-term.  We’ve had one of the fastest population growth rates in the OECD in recent decades, and yet one of the worst productivity growth performances.  So perhaps the really rapid migration-fuelled population growth has been really really good for us, and everyone else has gone really really badly, to explain our overall disappointing performance. But where is evidence –  the telling statistics that suggest that that is really what has gone on? Professor Spoonley knows about the disappointing New Zealand economic performance, so it is a shame that he didn’t try to relate his general claim to the specific experience of New Zealand.

Spoonley then argues

Auckland gains from the effects of agglomeration. Population growth and immigration is associated with economic growth and diversity. For example, Auckland and Canterbury between them accounted for almost all the new jobs growth in New Zealand last year.

Immigration is key to this as skilled immigrants add to the human talent pool that is available to employers. They also establish new businesses and contribute to demand, including for education. Regions and cities that are not attracting immigrants are losing out on this current windfall.

It is fine theory. It just bears no relationship to  the experience of New Zealand, and Auckland in particular, in recent decades.

I’ve shown this chart before

ngdp akld ronz

No one disputes – Spoonley doesn’t –  that Auckland’s population growth is largely migrant-driven.  And yet Auckland’s per capita GDP has been trending down relative to the rest of the country’s over 15 years.  And the margin of Auckland’s GDP over that of the rest of New Zealand was already low relative to what we see in most other advanced economies.

Perhaps Professor Spoonley and the other New Zealand pro-immigration advocates (many of them taxpayer funded) are right about the benefits to New Zealanders of this really large scale intervention.  But even if so, surely we deserve much more evidence of those benefits than we get when leading academics simply assert over again that, whatever the short-term stresses, the Think Big programme is really working out just fine?

And to end a long post, just a simple chart.  It shows residence approvals for each year since 1997/98.

residence approvals

The data are only available annually, but they are hard data on the number of people MBIE has given residence visas to.  This isn’t SNZ arrivals and departures data, it is the policy core of the immigration programme –  aiming at 45000 to 50000 approvals per annum.  One of my commenters keeps trying to distract from this issue by citing PLT data. Those data are often interesting and useful (and in other ways quite limited) for various other analytical purposes, but if we want to think about the implications of the annual flow of residence approvals this is where the focus should be.  Annual approvals under this programme are not very cyclical, and haven’t varied much across the last two governments.  They are simply very high by international standard (per capita) –  three times the US level.  And on the (lack of) evidence to date of economic benefit to New Zealanders, the annual target should be wound back quite considerably.


Immigration, diversity etc: benefits?

On Wednesday the Treasury, in conjuction with GEN (the Government Economics Network) hosted Professor Jacques Poot, from Waikato University, for a guest lecture under the title “Economics of Cultural Diversity: Recent Findings”.

Poot has been researching, and writing about, the economics of immigration and demographic change for decades.  He was one of the co-authors of the influential 1988 Victoria University modelling exercise, which played a part in shifting the consensus of New Zealand economists away from a fairly longstanding and widely-shared scepticism as to whether large scale immigration to New Zealand was generating sustained economic benefits for New Zealanders. (I summarized some of that past scepticism here.)

These days Poot is Professor of Population Economics at Waikato. In that capacity, he leads a joint Waikato-Massey project, which is receiving large amounts of public funding through MBIE –  the key public sector champion of current immigration policy.  The title of the project reveals the presuppositions of the researchers: CaDDANZ, or Capturing the Diversity Dividend of Aotearoa New Zealand.   The focus isn’t on identifying whether there is a dividend, or whether instead it might possibly be a tax, but simply on how “to maximise benefits associated with an increasingly diverse population”.  Poot is a careful, thoughtful, and respected scholar, but his presuppositions are pretty clear.

I went along to hear him for all those reasons.  I’m skeptical that there are such dividends, especially in the New Zealand context, but there is no point beating a straw man argument.  I was interested to hear the case as articulated by one of the leading New Zealand academics in the area, who has published extensively abroad as well.  I wrote here recently about a recent paper by AUT professor Bart Frijns (and co-authors) which found that  cultural diversity –  measured by the nationality of company directors – seemed to have adversely affected (or at best had no effect) the overall financial performance of listed UK companies.

It is worth bearing in mind that thinking about cultural diversity is not the same as thinking about immigration per se.  In my own analysis, I’ve written skeptically about the impact of the large scale immigration programmes New Zealand has run since, at least, World War Two.  In the early period, we had large scale immigration but not much change in measures of cultural or ethnic diversity –  most of the migrants were from the United Kingdom, with a leavening of Dutch immigrants (Poot himself is an immigrant from the Netherlands).   Poot’s lecture was on cultural or ethnic diversity.  On aggregate measures he presented, that started to increase in New Zealand from the 1960s (with Pacific Island immigration) and has increased fairly steadily in more recent decades.  The UK remains the largest single source country for immigrants to New Zealand, but the overall contribution of decades of immigration programmes is that New Zealand is one of the more culturally and ethnically diverse countries in the world.  He quoted an aggregate index and summarized the current score as meaning that there is now more than a 50 per cent chance that if you encounter another person in the street that person will be of a different ethnicity to you.

As he noted, measurement isn’t necessarily easy.  What do we mean by “cultural” diversity, and how should it be best proxied?   After all, New Zealand had a considerable degree of ethnic diversity even decades ago (Maori and European New Zealanders) and to some extent there are real cultural differences between those groups (although differences within those ethnic groups may be at least as large on some other dimensions of culture –  eg religion.  Similarly, there is now a very large New Zealand born Pacific population.  Poot showed some nice charts for Auckland localities, and for New Zealand regions, on how much difference it makes whether one looks at diversity measured by birthplace or by ethnicity.  Areas around East Cape, or South Auckland, come up as highly diverse ethnically but are more homogeneous as regards birthplace.  The North Shore by contrast shows a lot of birthplace diversity but much less ethnic diversity.

But, in fact, most of Poot’s presentation was an attempt to summarise the international literature, with no attempt to apply it specifically to New Zealand.   After outlining various possible positive and negative effects that have been hypothesised, he attempted to summarise the literature on the impact of cultural diversity on various aspects of economic performance.

In the end, he couldn’t claim much for the effects of increased cultural diversity.  As he noted, studies in the area are plagued with reverse causality problems.  It is easy enough to highlight correlations in which more innovative regions are more culturally diverse, but which way does the predominant causation run?  Innovative regions will be more likely to attract newcomers, from home and abroad.  Poot’s reading of the literature is that immigration and diversity “shocks” affect innovation and productivity, but rather weakly.  The quantitative gains are typically small, and difficult to identify, and are much outweighed by other factors (at a firm or national level).  He appeared to have added a slide to his presentation in response to the Bart Frijns et al paper, but wasn’t quite sure what to make of the results.  Poot regarded it as a very good paper, and offered no obvious criticisms of the approach or methodology, except the passing observation that perhaps the UK was different.

There were some interesting questions, to which Poot didn’t really have particularly developed answers.  One economist asked about the relative economic importance of gender diversity and cultural diversity, while another –  something of a bastion of liberal thought –  asked whether we needed to think less about cultural diversity per se than about the differences in the productivity performances of different cultures, citing (eg) Weber.

How should we apply this to New Zealand?  Poot didn’t attempt to in this presentation, but as noted we have considerable ethnic, cultural, and birthplace diversity, and that diversity has increased materially in the last few decades.  And yet our overall economic performance, including on measures such as productivity, innovation, and foreign trade, have been among the worst in the OECD.   One never knows the counterfactual, but New Zealand doesn’t look like a great place to start from if one is keen to illustrate the economic benefits of cultural diversity.  There is a literature suggesting that increased ethnic diversity boosts foreign trade –  although Poot was keen not to oversell this – but then New Zealand is one of the handful of countries to have had no increase in its foreign trade share of GDP in the last 30 years or more.  Perhaps a heavily natural resource based economy is a little different?

Ian Harrison has noted some problems with some of the literature in this area in this note.

By coincidence, I got home from the Poot lecture to find a request from TVNZ to be interviewed on immigration issues for their Q&A show tomorrow.  Apparently, they have also interviewed Professor Poot for the programme.  In my recorded comments, I noted the difficulty of having a good debate about these issues in New Zealand, and noted that when I first began developing my thoughts about how our immigration policy might have affected New Zealand’s specific economic performance, there had been a lot of embarrassed silence among my then colleagues at The Treasury,  with suggestions that I risked sounding like Winston Peters, and –  in the case of one particular manager –  outrage that the issue should even be discussed at Treasury.  But Treasury’s guest lecture series remains a valuable contribution to discussion of policy issues, and I appreciated the opportunity to hear Professor Poot speak.