That’s the Herald’s headline for its new “Nation of debt” series, where they state “New Zealand now owes almost half a trillion in debt”.
Whatever “New Zealand” and “owes” might mean.
The New Zealand government has some debt – $109 billion of it, in gross terms, according the Herald’s numbers, spread between central and local government. Of course, these very same entities have financial assets as well. The financial assets aren’t as large as the financial liabilities, but by most reckonings the New Zealand public sector isn’t particularly indebted.
Another way of reckoning ‘New Zealand’s debt might be the amount New Zealand firms, households and governments owe to foreigners. That isn’t $500bn, but – according to Statistics New Zealand – $247 billion (gross). Again there are some assets on the other side. And actually the net amount of capital New Zealand resident entities have raised from abroad is largely unchanged, as a share of GDP, for 25 years. It is quite high by international standards, but the ratio isn’t going anywhere.
But the Herald chooses to focus simply on the gross debt of New Zealand entities, and pays no attention to what might be going on elsewhere in the balance sheet. Since they end up focusing on households, lets do that. The Herald focuses on $232.9 billion of gross household debt, but pays no attention to what has been going on with household deposits. Here is the chart, using the Reserve Bank’s household statistics, of the gap between household debt and household deposits.
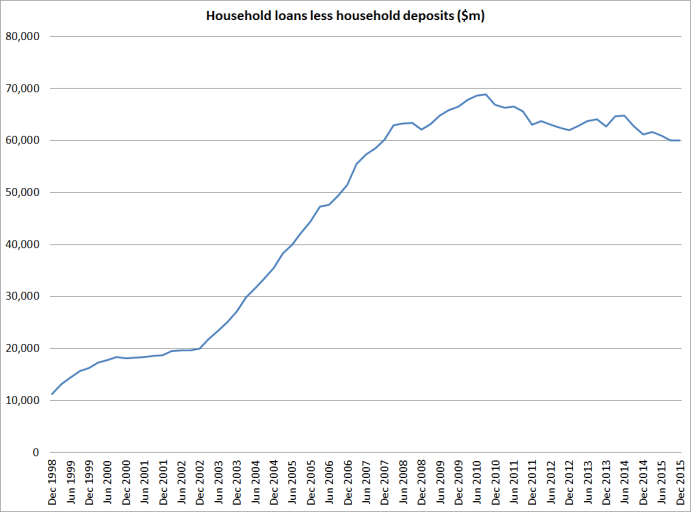
It rose very rapidly in the boom years of the 2000s, but has gone nowhere at all for seven or eight years now. GDP has gone up a lot in that time, so that the ratio of this gap (between loans and deposits) to GDP is materially lower than it was back in 2007/08. This isn’t some novel point – the Reserve Bank has been mentioning it in FSRs for years now.
Even ignoring deposits, household debt to GDP itself has gone nowhere for eight years, after a huge increase in the previous 15 years.

Probably these ratios will increase somewhat over the next few years. HIgh house prices, and a housing stock that turns over only quite slowly, does that. Here is a chart I ran a while ago illustrating how debt to income ratios keep rising for quite some time – all else equal – even if there is just a one-off increase in house prices.
In the chart below I’ve done a very simple exercise. I’ve assumed that at the start of the exercise, housing debt is 50 per cent of income, house prices and incomes are flat, and people repay mortgages evenly over 25 years. Only a minority of houses is traded each year, but each year the new purchasers take on new debt just enough to balance the repayments across the entire mortgage book.
And then a shock happens – call it tighter land use regulation – the impact of which is instantly recognized, and house prices double as a result. Following that shock, house purchasers also double the amount of debt they take on with each purchase, while the (now rising) stock of debt continues to be repaid in equal installments over 25 years.
In this scenario remember, house prices rose only in year 1. There is no subsequent increase in house prices or incomes. But this is what happens to the debt to income ratio:

None of this is reason to be indifferent to the scandal of house prices, especially those in Auckland. But high house prices – that result mainly from the interaction of population pressures and the thicket of land use restrictions which rig the market against the young – tend to increase the amount the young need to borrow from, in effect, the old to get into a first house. It is quite risky for the borrowing cohort, but on the other side are much higher financial assets held by the older cohort, who sold the young the houses. “New Zealand” isn’t more indebted – one significant cohort of New Zealanders have much more debt, and others have much more financial assets. And that outcome is mostly down to choices made by successive governments.
The Herald is also keen to run the line that people are treating their houses like ATMs – drawing down on the additional equity to boost consumption. No doubt some are – and for many it will be quite rational to do so. If you are 60 now, living in Auckland, and thinking of moving to Morrinsville or Kawerua to retire, you might as well take advantage of the rigged housing market now and spend some of your equity. On the other hand, people trying to get on the housing ladder are having to save ever more to get started in the market (through some combination of market constraints and regulatory restrictions). But whatever the case at the individual level, here is a chart I’ve run a couple of times recently, showing household consumption as a share of GDP.

If you didn’t already know there had been a massive increase in house prices, and gross household debt, over these decades, there is nothing in overall consumption behavior to suggest a problem (or even an issue). High house prices don’t make New Zealanders as a whole better off, they simply involve redistributing wealth from one cohort to another. If they don’t make New Zealanders as a whole better off, we wouldn’t expect to have seen a surge in consumption. And we don’t.
I’d hate to be one of the young taking on mortgages of the staggering size that are all too common today. Even if house prices never come down much – quite plausible if the land supply mess is never properly fixed – they face a heavy servicing burden for decades. If house prices do fall a lot, those people risk carrying an overhang of debt that could make it all but impossible to move. And some risk of serious distress if the borrower were to be out of a job for very long.
But it isn’t “New Zealand” that owes this money. It is one lot of New Zealanders who owe it to another lot of New Zealanders, in a market rigged by governments. Fortunately – and I didn’t see this in the Herald story – even our Reserve Bank (constantly uneasy about debt and housing) has repeatedly run severe stress tests and found that the banking system is robust enough to cope with even some nasty adverse shocks. The same, of course, won’t necessarily be able to be said for all the borrowers if something very bad does happen.

Really useful data series here (1987 – );
http://www.interest.co.nz/charts/economy/balance-payments
LikeLike
Good old Herald… half arsed analysis again.. declaring, or trying to declare a crisis where none exists… the media always focus on the gross debt as it is it a fiendish curse without considering the asset side of the ledge or the market dynamics…
It really is quite disappointing… some hapless fool will no go on the telly to moan about a problem that doesn’t exist and demand that ‘something must be done’…
Sigh….
LikeLike
this…
http://johnhcochrane.blogspot.co.nz/2016/06/wsj-growth-oped-full-version.html#more
LikeLike
Michael you say that overpriced property is an equity issue -one cohort benefits from the higher prices while another cohort loses. Now I get that argument and agree that on inequality grounds alone housing affordability should be addressed.
But is overpriced property also an efficiency issue too? Is there a deadweight loss effect?
The standard argument housing affordability people use is -that if restrictions to build up and out are too tight then the relatively few property owners with development opportunities speculate that there is a capital gains opportunity from forgoing development opportunities due to expectations of higher capital gains from doing nothing.
Is this forgone property development activity a missed economic opportunity?
Does it for instance distort businesses and households location decisions -leading to inefficient outcomes?
LikeLike
It probably does – and I’m certainly not defending the thicket of controls – but I am a little uneasy about putting too much weight on that story in a NZ context, given that Auckland has had very rapid population growth anyway (nothwithstanding the restrictions) and such feeble per capita income growth. Perhaps the inefficiency is mainly with Auckland – rather between Auckland and the rest of the country – and that would be an interesting issue to explore further.
LikeLike
This morning, Transit NZ talked about a long haul heavy duty battery for trains which is already a working prototype in Spain. One charge takes you all the way to Pukekohe and back with a few stops in between. They believe it is a viable alternative to electric cables and would lower the cost to implement considerably. Looks like technology may lower our infrastructure spending to spread from the top of Auckland Region, Leigh up north to Pukekohe down south and may allow for higher density in those towns, a sea of houses.
LikeLike
Travel distance is 129km from Leigh to Pukekohe compared to Houston from the Woodlands to Texas City is only 118km.
LikeLike
Note also the land mass of Auckland region is 5000skm compared to Houston region of 10,000skm. It is not about land availability. It is about heights.our core high rise is too small. The solution is 18 level high rise in Mt Eden, Epsom, Mt Roskill, Remuera, Mt Albert, One Tree Hill. Easy problem solved.
LikeLike
If you take out Investment property debt of $60 billion, the NZ household debt drops from $232 billion to $172 billion. At December 2015, NZ household savings is $157 billion. NZ households therefore have a net debt of $15 billion.
Therefore raising interest rates or dropping interest rates gradually have minimal impact on inflation or consumer spending. Interest rates do affect businesses directly rather than consumers. Raise interest rates too fast and builders and developers drop like flies as they are almost 100% debt reliant to complete projects. Raising interest rates would see supply shrink dramatically and house prices rising until the general economy starts to fail. We saw that trend very clearly when Allan Bollard started his aggresive interest rate rises to 9%.
LikeLike
I do not agree with the notion that house prices are neutral on net because it is just one generation losing and another one gaining. I think there are many mechanisms by which the higher prices are harmful, and even if this is only an effect of the strength of 2 or 3 percent per year, this compounds to quite a big loss in the long term. I predict that the stable-house-price cities of the USA will have to be recognized at some stage, as having opened up a lead on most of the rest of the world.
I am interested that there is no evidence of a “consumption spending boost” overall from the rising house prices, probably because for every gainer of equity who is spending it, there are “recent years” first home buyers with far lower discretionary income that might have been the case.
Over the generations, of course, as in the UK, everyone ultimately ends up with far too high a lifetime mortgage servicing burden (or rent burden). Then there are households “not formed at all”, and new homes “not built at all”.
John Stewart (2002) estimates that the rate of replacement of housing in the UK has reached 2000 years – while most first world countries are below 100 years. That is a LOT of actual wealth creation in construction, to be foregoing.
There is an argument that the proportion of incomes swallowed by mortgage payment or rents, is merely being “spent” on something other than normal consumption items, and is still being spent in turn by those receiving the money, so “money in circulation” is still the same. I say the right way to conceptualize this, is that “wealth” is actually “stuff” (valued goods and valued services, i.e. not economic rent), not dollars. Total “stuff” is total wealth. If you look at the circular flow of money as running in two alternative channels – 1) is payments for “stuff” and 2) is zero-sum transfers – I say it is self-evident that the bigger the channel for zero-sum transfers, the smaller the channel for “stuff” and therefore the amount of stuff being produced (and creating real incomes) will be less. The dollars in circulation will be competing for less stuff, as well as the fact that some share of the stuff will be captured by non-deserving rentier-sector people.
If you look at the flow of money as a closed circle, it obviously does matter how much of it is being paid for zero-sum economic rents – it is wrong to look only at a snap-shot at one moment, leading us to believe that “any dollar spent now is the same worth to the economy in the long term”.
The trend that Piketty finds, in “return to capital” versus return to everyone else, is mostly a matter of economic rent, particularly in urban land. It is a pity that Piketty shows minimal concern about this, preferring to just tax any “income from capital” regardless of whether it is return on productive capital or non-productive.
The state of any nation’s socio-economy will also be influenced by whether the nation is a good generator of primary income, and how. NZ does it by exporting high volume, low value products of non-urban land. Germany and Japan do it by exporting value-added manufactures. The UK does it by “exporting financial services”. In each case, the overall effect on social justice, housing, and infrastructure cost burden, will be quite different, and differing urban policies (and rents in urban land) will change things yet again.
LikeLike
Thanks for those comments Phil.
In that post, I wasn’t intending to deal with the question of whether land supply/use restrictions are costly to the country as a whole – i’m sure they are – just with the narrow question of the debt. The debt is mostly intergenerational – no less pernicious for that, but not a case of “NZ” owing someone half a trillion dollars.
Entirely agree with you about Piketty.
LikeLike
Kathryn Ryan, poorly researched comments on Radio NZ 101.4 this morning was also rather reckless with the description the NZ Households had half a trillion in household debt. Such blatant inaccuracy to get headlines. Dominik Stephens Stevens of Westpac chose not to correct her error and just played along to this incredible hype also guilty of perpetuating a lie for headlines grabbing attention. What I could not believe this was was then again backed up some poorly researched comments by a economics professor.
I am not sure why our economists and our academics in the economics profession continue to mislead the general public????
LikeLike
Or I am starting to get this rather clear picture that economists including Dominik Stephens of Westpac have got no idea how to read a Financial Balance Sheet including the readily availabe NZ household balance sheet provided on the RBNZ website.
http://www.rbnz.govt.nz/statistics/c22
LikeLike