I was going to write about the Reserve Bank’s forthcoming Monetary Policy Statement, but discussion around immigration policy continues in the media, so I thought the topic might be worth one more post.
There are all sorts of different numbers tossed around when immigration and net migration are debated. Different numbers are relevant for different purposes, and things aren’t greatly helped by the fact that MBIE does not release regular monthly numbers on visa approvals, and so the month to month discussion is often dominated by SNZ’s permanent and long-term (PLT) migration numbers.
The centerpiece of our medium-term immigration policy is the residence approvals target: 45000 to 50000 people per annum. That target hasn’t been changed for a long time – it was the previous government’s target and the current government’s. It is a large number by international standards: as I noted yesterday, in per capita terms it is around three times the number of green cards the US issues each year. Actual approvals fluctuate a little from year to year – I showed the chart in yesterday’s post – but not very much, and the rules and points are tweaked a bit over time to keep near the target. Debates about the medium-term implications of immigration, whether for population or economic performance, should really concentrate on the appropriate target level (and composition) of residence approvals. It is important to appreciate that these days the bulk of people getting a residence approval are already in New Zealand (around 70 per cent) – having arrived on, for example, a student or (temporary) work visa. In most cases, granting a residence approval changes the legal status of the individual, and does not involve a new border crossing.
But, as I noted, the PLT numbers dominate the headlines. PLT numbers (which importantly include New Zealand citizens – not a matter of immigration policy) are only estimates. We know exactly how many people come across our border (in and out) each month, but the split between permanent and long-term on the one hand, and short-term on the other, relies entirely on the self-reported intentions of those filling in the arrivals and departure cards. Plans change. As I’ve highlighted previously, Statistics New Zealand themselves have done useful work showing that at times the reported PLT numbers have been quite substantially different from the actual numbers who have come or gone for more than 12 months (I discussed this work here . It is a great shame that SNZ is not adequately funded to produce these refined estimates on a regular basis.
Using the PLT data, one can look at either total arrivals or the net flow.
Here is total (self-reported) PLT arrivals by visa type for the last decade or so (the period SNZ provides the data for).

Among other things, this chart illustrates my point above about residence visas. About 43000 residence approvals were granted in the last year, but when people crossed the border to enter New Zealand only around 14000 arrived in the country already holding residence visas. In granting residence approvals, policy now puts a high weight on people already having a job and being established in New Zealand, so most people who get residence approvals come first on student or work visas. Even over this decade, one can see the rising share of these temporary visas. Of course, not all these people stay permanently (or would want to).
And it is also worth highlighting the “not applicable” category, which captures New Zealand and Australian citizens who don’t need a visa to come and live here. Over these 11 years, that number has fluctuated between 28000 and 36000 per annum – not huge variation. There is much more variation in the departures of New Zealand citizens: over the same period that total has fluctuated between 34000 and 62000 per annum.
Total PLT arrivals probably could probably be managed, more or less, with a policy target. But it wouldn’t be very sensible to do so. If our universities really do offer a great tertiary education there is no obvious reason why we’d want to put a policy cap on the numbers coming. It is just another export industry. The policy focus should be on the number, and composition, of the people (non New Zealanders) we allow to live here permanently.
What about net PLT flows? They fluctuate enormously. Here is the chart of annual flows since 1921.

Bear in mind (a) that the population is much bigger now than it was in earlier decades, and (b) that SNZ work suggesting that self-reported PLT flows don’t always accurate represent true permanent and long-term inflows. Importantly, using that analysis, the 2002/03 boom at peak was larger, as a share of population, than the current net inflow.
The average PLT inflow over the last 25 years has been just under 15000 – a large outflow of New Zealand citizens, and a much larger inflow of non New Zealand citizens. Perhaps this is the sort of number Winston Peters has in mind when talking about a target inflow of 7000 to 15000?
The net PLT flow cannot be managed by policy at least over short to medium-term horizons. Cutting the residence approvals target, as I have proposed, would markedly reduced the average net inflow over time, but the cycles in net PLT would probably be about as large as ever – just cycling around a lower mean. Much of the variation is the change in the number of New Zealanders leaving (see above). As I noted yesterday, when politicians talk of short-term caps or (as I heard Andrew Little call for this morning) “more agile” management of the system, it isn’t likely to be a recipe for more stability in PLT flows, but a risk of creating more (pro-cyclical) instability. Forecasters of the net PLT flow 12 to 18 months ahead have a shocking track record.
Export education services have been flavour of the month in this debate for a while now, and I heard Steven Joyce on the radio this morning talking about how any serious cutback to immigration could put tens of thousands of jobs at risk in the export education sector.
To the extent that people are coming to study in New Zealand for the quality of educational products New Zealand firms and institutions have to offer, the Minister’s comments are almost entirely wrong. People choose to study at Harvard or Stanford or Oxford because they are top-notch universities.
But that doesn’t look like the New Zealand story. Here is a chart of student visas by the type of institution the student is studying at. Unfortunately MBIE provides this data only back to 2005/06.

All the growth in recent years has been in the polytech and private training establishment sectors. I’m sure there are some excellent institutions in that sector, offering really high quality educational services rivalling the best in the world. But one might also suspect that the stories of people using study here mostly as a way of being better positioned to get a residence visa, financed by the recent change of policy allowing students and partners to undertake a lot of paid work while they are here, has more than an element of truth to it. If so, it isn’t that our export education industry is hugely competitive and successful, it is just another case of “export incentives” at work. We dish out cash to the film industry, and in this industry a leg up on the residence approvals process is the subsidy. Subsidised export industries certainly get a benefit themselves, and perhaps that benefits the people working for them. They rarely benefit New Zealand in the long haul. We should have learned that lessons decades ago.
Again, if our education sector was attracting real top-notch people, and encouraging them to apply for residence, there might be a net gain for New Zealand (lifting the average quality of the people we decide to let stay). But as Treasury has noted, we aren’t doing that well at attracting really highly-skilled people. The recent Fry and Glass book reported that we are doing less well on that score than either Australia or Canada. And, as a reminder, these were the top five occupations for the skilled migrants last year.
| Chef |
| Registered Nurse (Aged Care) |
| Retail Manager (General) |
| Cafe or Restaurant Manager |
| ICT Customer Support Officer |
Those five occupations alone made up 25 per cent of the skilled migration approvals. And skilled migrant approvals made up only around 60 per cent of the total residence approvals – others, presumably, were not even reaching that standard.
If we were to look at changing our target level of residence approvals there are some significant questions to address.
One is how fast to make any change. I’ve argued for pulling the target down from 45000 to 50000 per annum to 10000 to 15000 per annum, but haven’t taken a strong view on a transition path. The housing market stresses, and long-term productivity underperformance, are sufficiently serious that there is probably a reasonably case for making the change in one step. I wouldn’t favour a very gradual adjustment – say, pulling the target down 5000 a year – partly because it would be too hard to distinguish the effects of the policy change from all the other stuff going on. A middle ground might be to, say, halve the residence approvals target for five years, with a full review of the costs and benefits of that approach to be undertaken at the end of the period.
The other key question is what the composition of a lower approvals target might be.
Here is a chart showing the breakdown of residence approvals, using MBIE data.
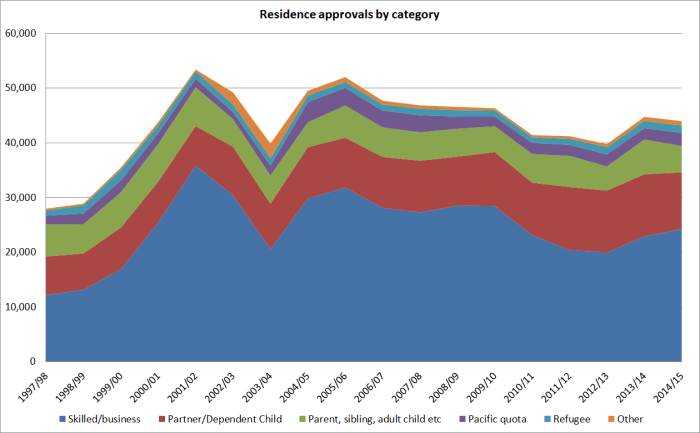
It would be very easy to simply squeeze out skilled migrants (and their spouses and children). Personally, I think that if we are serious about immigration serving an economic role we would need to think hard about some of the other categories. For example, in the most recent year, around 10 per cent of residence approvals went to parents (presumably generally quite elderly) of people now living here, with a few hundred additional approvals for adult children and siblings. There is little or no prospect of economic gain to New Zealand from this migration – and no obvious humanitarian case either – and a pretty good chance that (unlike most skilled migration) the net fiscal cost of these migrants will be quite substantial.
We also approved residence for 1500 people under two Pacific Island access categories. These are presumably people who would not have qualified as skilled migrants. Perhaps one can accommodate those sorts of numbers within a 45000 to 50000 annual target, for historical or foreign policy reasons. Much harder questions would have to be asked if we brought our overall immigration numbers more into line with international practice.
I don’t have a particular view on appropriate refugee numbers. If anything, at present, there is a push to increase that quota at present. That is a legitimate choice for a country to make, but most probably to do so would further reduce the chances of the immigration programme making a meaningful economic contribution to New Zealanders. Then again, I read the evidence as suggesting that immigration mostly benefits the migrant, and that countries are fooling themselves if they treat large scale immigration as (as MBIE does) some sort of “economic lever” to lift medium term domestic economic performance.
There is a lot of talk about how disruptive a cut in the immigration (residence approvals) target could be. No doubt that is true for firms and sectors that are focused on meeting the needs of a rapidly rising population – be it builders or whatever (furniture and carpet shops). But a lot of that argument is built on the fallacy the immigration eases overall labour shortages. If anything, it exacerbates them: the short-term demand effects of immigration outweigh the supply effects.
Let’s say, as a deliberately extreme example, that my preferred policy – cutting the residence approvals target to 10000 to 15000 per annum was adopted tomorrow. What might we see over the following few years?
I noted yesterday that we would see house and urban land prices a lot lower, especially in places that have experienced considerable population pressure in recent years.
We’d also see a lot less building activity – across all types of construction. We’ve seen this before – when net migration was very low in the late 1970s and early 1980s the construction share of GDP was much lower than it had been before or since. Quite possibly, the PTE component of the export education industry would take a hit.
But all of these pressures would be recognised in the Reserve Bank’s economic forecasts, and monetary policy would adjust to take account of the weaker demand pressures. In fact, markets would be likely to adjust even before the Bank, so long as the policy change was well-signalled and treated as credible. Real interest rates would fall, and so would the real exchange rate. Our exchange rate stays high only because New Zealand pretty consistently offers a yield premium over those on offer in other currencies. We’d see a classic case of resource-switching. The cost of capital to firms developing businesses here would be lower, and the lower real exchange rate would be particularly attractive to firms looking at opening, or expanding, in the tradables sector. Recall, that per capita sector production has not increased for 15 years. This policy change would help reverse that shocking record. It seems likely that regions outside Auckland – in many cases, much more export focused, would get a particularly substantial boost.
What about the labour market? As I’ve already noted, high levels of immigration don’t ease overall labour market pressures, they exacerbate them in the short term. So, all else equal, a lower rate of residence approvals (not simply offset with more work visas approvals) would ease labour market pressures to some extent (offset, of course, by the easier monetary policy). Perhaps some sectors might still find it difficult to get the right people. That is what the price mechanism is supposed to deal with: higher wage rates for particular skills or sectors will, over time, draw people into those occupations. There is a price at which New Zealanders will be aged care workers or dairy hands. For firms in the non-tradables sectors, that higher price might be difficult to absorb. In a sense that is part of the point: reorienting the economy towards the tradables sectors puts pressure back on the non-tradables sectors. For firms in the tradables sectors, the lower exchange rate provides a margin that can accommodate any wage pressures that might develop in individual sectors. But I’d be surprised if those pressures were large or systematic: after all, many of the people who have been employed in sectors responding to the rapidly rising population have to find some other place to work.
Over five years, I’d expect we’d start to see material gains for New Zealanders as a whole. More affordable house prices, a larger share of the economy selling to the rest of the world, reduced pressure on unskilled New Zealanders, and so on. Successful economies typically succeed by finding ways of selling more and better stuff to the rest of the world. We’ve failed on that count (in per capita terms) for decades, but we can turn it around. I’d expect that five years after such a policy was adopted we’d have started to see our productivity performance markedly improving relative to those in other advanced countries. If global productivity performance was still weak, ours might still not be all that we’d like, but we’d almost certainly be doing less badly than our peers. The gaps between productivity levels in New Zealand and those abroad are so large that it will take decades to reverse them. But as we do, we might even find ourselves in the position the Irish finally found themselves in last decade – the huge diaspora finally started to come home.