Not very good at all.
Of course, that isn’t necessarily a particular criticism of the Reserve Bank. Forecasting is hard – especially, as the old line goes, when it is about the future. But economic forecasters find the past a challenge too. Yesterday, we finally got the first estimate of GDP data for a quarter that happened, on average, four months ago (ie mid February to mid June). Even for forecasts done not long before the official data are released the forecasts errors are often non-trivial (the Bank’s forecasters used to try to convince us that even errors of 0.5 percentage points for quarterly GDP forecasts shouldn’t be particularly bothersome). I don’t have much confidence in economic forecasting, and I mostly try to stay clear of it in my comments on this blog.
You might wonder why, if forecasting is so challenging, central banks devote so much effort to it. It is not as if there are no alternatives, or as if monetary policy has always been run this way. A Taylor rule – using just current estimates of a neutral interest rate, an output gap, and the distance between current inflation and the target – is one quite plausible alternative as a starting point for policy deliberations.
It is easier to understand why other institutions do economic forecasts. There is a demand for them from people (corporates, local authorities) who need numbers to populate the cells of planning spreadsheets. Even central governments, planning expenditure over several years ahead, need such numbers – but for them, as for other users, trends matter more than cycles. For central banks, it is cycles that really matter.
Forecasts also get media coverage – as horoscopes helped sell newspapers in years gone by – and part of a bank economist’s role is media coverage, and visibility for the respective banks’ brands. For some other forecasters, the visibility of forecasts might, at the margin, help sell other consulting services.
Whatever the reasons behind their respective operations, there are now plenty of outfits doing economic forecasts for key New Zealand variables. And yesterday the Reserve Bank published an issue of the Bulletin devoted to a statistical analysis of how the Reserve Bank’s forecasts have done over recent years relative to a large group of these other forecasters. They’ve done these exercises from time to time, but this one in particular seems to be part of the Reserve Bank’s defensive operation to cover for its monetary policy misjudgments in recent years. Although there is nothing complex about the analysis, and although the Reserve Bank has a large team of numerate researchers and analysts, the analysis (and article) was contracted out to NZIER. As it happened, the NZIER researcher – Kirdan Lees – had, in fact, been one of the managers in the Bank’s Economics Department, fully involved in the scrutiny of the forecasts, in the early years of the period the exercise reviews (2009 to 2015).
It is good that official agencies do these exercises. They help shed some light on questions that those who approve agency budgets, and assess their performance, might reasonably ask. The new Reserve Bank exercise helpfully uses the same approach adopted in a 2009 analysis of the previous few years of Bank forecasting performance, but benefits from a larger sample of forecasters. The Treasury just last month published a new review of its own macro and tax forecasting performance.
Having said that, it is as well to take each exercise with a considerable pinch of salt. Most of these studies look at quite short periods. The Bank’s previous exercise looked at forecasts done over 2003 to 2008. This one looks at forecasts done from 2009 to 2015. For two-year ahead forecasts – and it is the medium-term the Reserve Bank ostensibly focuses on in setting policy – that means no more than three non-overlapping forecasts for each observation (eg a March 2009 forecast for March 2011, a March 2011 forecast for March 2013, and a March 2013 forecast for 2015). There just isn’t enough data to meaningfully tell the various forecasters apart in a statistical sense (as the author recognizes in explicitly choosing not report measures of the statistical significance of differences across forecasters). Good performance – or bad performance – in a particular period might just be a result of luck. The recent Treasury exercise used a longer-run of data (in some cases all the way back to 1991) and it might have been interesting for the Bank researchers to have at least(also) looked at the full period performance since 2003.
It is also important to recognize that the way the exercise is done is systematically set up to favour the Reserve Bank (the Treasury exercise has the same problem, a point which their write up explicitly notes). The Reserve Bank collects forecasts from a variety of other official and private forecasters two to three weeks before the Bank’s own forecasts as finalized. That collection of external forecasts is one input in the Bank’s own forecasting and scrutiny process. We would sit around the MPC table, scrutinizing the draft projections our own forecasters had come up with, and use the external forecasters’ numbers as a basis for questions of our own. Often enough, people (me included) were quite dismissive of the external forecasters, but we were keen to understand the logic where the forecasts of the more respected external forecasters differed materially from our own draft forecasts. It was one part of running a process designed to assure the Bank’s Board (for example) that we had thought about alternative possibilities and to test the robustness of our own numbers.
But what that inevitably means is that in comparing these external forecasts with the Reserve Bank ones, not only does the Reserve Bank have several weeks more data than the external forecasters have, but the Reserve Bank can condition its forecasts on any useful information in the external forecasts (individually or in aggregate). For some variables, that two to three weeks can make quite a difference – eg the exchange rate can move a lot, oil and dairy prices can move quite a bit, and some (typically second tier) domestic data will have emerged that the external forecasters just didn’t have. For the June MPS forecasts, the Bank often has Budget information private external forecasters wouldn’t have had. How large that advantage is is an empirical question (which can’t readily be answered), but the direction of the advantage is clear. The Reserve Bank should typically do a bit better than most external forecasters – not hugely so, as much about the future is inherently unknowable, but better.
Oh, and the Reserve Bank spends massively more on macro forecasting and analysis than any other agency monitoring/forecasting the New Zealand economy: a typical large domestic economics team is perhaps five people in total and several of the forecasters on the list are one-person operations. The Reserve Bank used to have perhaps eight people in its forecasting team, another half dozen doing modelling (mostly oriented to forecasting concerns), more doing research, and more monitoring international economies. And key senior managers (from the Governor on down) are heavily involved in reviewing/challenging/confirming the forecasts, along with a couple of external advisers. These (mostly very smart) people don’t just do forecasting, but a sceptical Treasury analyst, considering the Reserve Bank’s funding agreement submissions, might reasonably ask about how large the marginal gains in forecasting accuracy and policy quality are from all the additional resource the Bank devotes to the operation.
How did the Bank do? The usual method for looking at forecast accuracy is to calculate the Root Mean Squared Error, a measure which looks at the size of absolute errors (ie upside and downside errors don’t offset each others) and which particularly penalizes large errors.
The Bank reports the results of their comparison for four variables (GDP growth, 90 day bill rate, CPI inflation, and the TWI) and for both one and two years ahead. They also show the results for each other forecaster – anonymized – and the results if on each occasion the Bank published a forecast they simply used the median forecast for each variable from the most recent grouping of external forecasts. That means we can look at 16 RMSE comparisons. Here is my summary table.
| Reserve Bank forecasting performance | |||||
| Better than the median forecaster | Better than the median forecast | ||||
| GDP | 1 yr ahead | Yes | Yes | ||
| 2 yrs ahead | No | No | |||
| 90 day bill | 1 yr ahead | Yes | Yes | ||
| 2 yrs ahead | No | No | |||
| CPI | 1 yr ahead | Yes | Yes | ||
| 2 yrs ahead | Yes | Yes | |||
| TWI | 1 yr ahead | No | No | ||
| 2 yrs ahead | No | No | |||
Of the sixteen observations, the Reserve Bank does better than the median eight times, and worse than the median eight times. That is a little bit better than it sounds – it has long been recognized that using a median forecast will typically produce a better forecast than using any individual forecast. In the charts in the article, adopting a rule of just using the median forecast on each occasion produces results that would typically put someone running that rule in the best third of the forecasters examined here.
But recall that:
- the Reserve Bank has information advantages over the external forecasters
- the Reserve Bank devotes a lot more resources to forecasting
- the Reserve Bank actually (in effect) sets the 90 day rate (in announcing an OCR as part of its forecasts)
- the variable that the Reserve Bank has consistently beaten the median (forecast and forecaster) on is CPI inflation, a variable which has undershot the target now for four years.
- the Bank does relatively worse on the two year ahead forecasts than the one year ahead forecasts, even though monetary policy is ostensibly set on a medium-term (18 mth to two year ahead) view. Information advantages are likely to be materially less for two year ahead forecasts than for year ahead ones.
The Bank’s article has its own summary measure of forecast errors (aggregating across the four measures – details are in the article).
Here is the chart for one year ahead forecasts
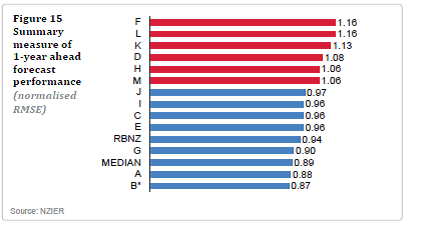
The median forecaster is between forecasters J and I, with an RMSE of .965. The Reserve Bank’s RMSE of .94 is neither economically nor statistically significantly different from that median forecaster’s (and those of a bunch of others clustered near)
And here for two year ahead forecasts
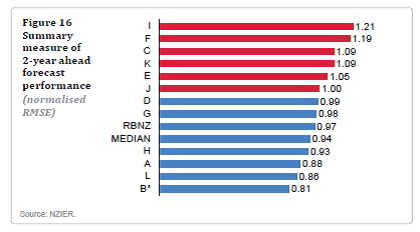 The median forecaster is between forecasters J and D. Again, the Reserve Bank looks no better (or worse) than the group of forecasters clustered near the median forecaster.
In doing the analysis, Kirdan Lees did the interesting exercise of looking at how using the median forecast on each case would have performed. But another exercise one could think of doing is to compare how these forecasters (including the RB) did relative to simply using the most recent actual information, and assuming that what we see today is what will be (the best forecast f0r) the outcome one and two years ahead. For forecasting the exchange rate, it is widely accepted that it is very difficult to beat this “random walk” approach.
I did a quick exercise to see how the random walk would have done over 2009 to 2015 for the CPI and the OCR (not the same as the 90 day rate, but very close). For year ahead inflation forecasts, forecasters certainly did better. At the two year horizon, the Reserve Bank did a little better than the random walk over this sample period, but most of the other forecasters didn’t. Given the small sample, over this period, there might have no useful information in the laboriously produced medium-term inflation forecasts at all.
What about the OCR? Looking a year ahead, the Reserve Bank’s 90 day bill forecasts had the same RMSE as simply forecasting the OCR using a random walk – and the Reserve Bank sets the OCR, using its own reaction function. Quite a few forecasters did worse than the random walk, but then they had less information than the Bank. On two year ahead forecasts, only one forecaster was as good (on this measure over this time) as the random walk OCR forecast. The Reserve Bank was among those who were far worse.
Perhaps it would also be interesting to look at some other comparisons. For example, to see whether forecast errors at the Bank are different from one Governor to the other (probably not, but gubernatorial overlay is a well-recognized and, in principle, quite legitimate part of the RB forecasts). One could look at (implicit) forecasts from predictions markets (rather thin, and now undermined by regulatory interference) and for 90 day bills one could compare the Reserve Bank’s forecasts with implicit market prices. But those weren’t the point of this particular exercise.
What would I take from all this? Not overly much. In the Reserve Bank’s press release they were rather inclined to oversell the Bank’s performance – noting neither the Bank’s information advantages, nor the lack of statistical (or economic) significance in most of the results. Forecasting is a mug’s game and it shouldn’t be any surprise that no one much can do it consistently well. It might be better to stop pretending otherwise.
I suspect that the Reserve Bank is – on average – about as good, or bad, as the other forecasters focusing on New Zealand. At one level, perhaps we shouldn’t expect more. Then again, they (a) spend huge amounts of public money on generating and publishing forecasts, and (b) are charged – and have agreed to accept – a mandate that involves their ability to adjust the OCR to deliver on an inflation target. I haven’t looked at the bias results in this post (all the results are in the article) but there were huge biases in the inflation forecasts over this period. The Reserve Bank’s were a bit less than most – and that had certainly been my impression when I was still at the Bank – but it is hardly an impressive performance. As Bernard Hickey noted in questions at the recent MPS press conference, on their own – not overly good – forecasts, they are on track for six years below target.
As I noted earlier, these exercises need to be done from time to time. But I’m not sure they really shed much light on the policy judgements and misjudgements over the last few years (or indeed in the period covered by the earlier article). There is some defensive cover in being in among the pack in (small sample) forecasting comparisons – in that it is better than the alternative of being shown to be consistently most wrong – but it doesn’t really justify what has gone on. A lot of smart people, led by the Governor and his chief economist, got it consistently wrong, made overly bold calls at key junctures, then proved continually averse to scrutiny or to even acknowledging errors and misjudgements (to which all humans are prone), and continue to rely today on overly bold assumptions about things being just about to come right.
