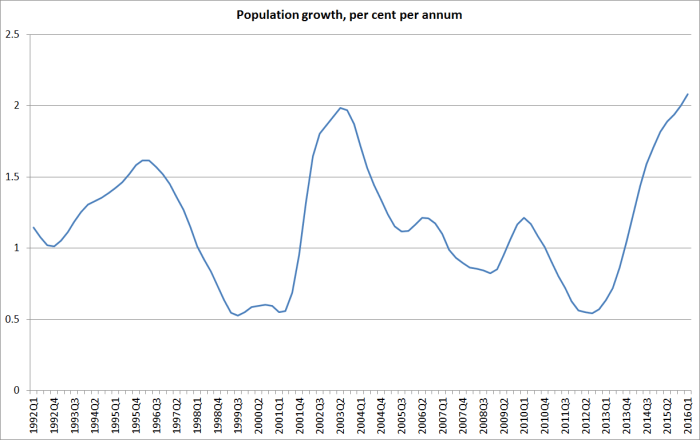
As everyone knows, our current population growth rate is extraordinarily high at present. We only have an official census every five years or so, but SNZ produces quarterly population estimates using births and deaths data and information on migration flows. Here is the estimated annual growth rate of New Zealand’s population for the full period since the official estimates begin in 1991.
By international standards, New Zealand’s population growth rate is highly variable. Most of the short-term variability in the series is not about discretionary New Zealand policy choices. The (large) target for the number of residence approvals has been the same for 15 years or more, and most of the shorter-term variability is a reflection of fluctuations in the net number of New Zealanders leaving – in turn, much influenced by perceived prospects in Australia. Incomes are higher there, but that isn’t much use if one can’t get and keep a job, given that most New Zealand migrants to Australia are not eligible for most elements of the Australian welfare safety net. But New Zealand policy choices do make some difference – for example, allowing foreign students to work while they are here, appears to have materially increased the number of those living here.
As I illustrated yesterday, productivity growth in New Zealand in recent years has been almost non-existent. To restate the obvious, it isn’t some fundamental reassessment of New Zealand’s fortunes and productivity prospects that seems to be boosting our population.
But some of the other trends in the data are interesting too. For example, here is a chart of per capita growth in real consumption. I’ve shown two lines – one for private consumption, and one for total consumption (ie including government consumption).

Private consumption growth per capita – the red line – was averaging around 4 per cent annum over 2002 to 2005, the last huge population surge. Those growth rates hadn’t been much lower in the mid 1990s. In the last year, private consumption per capita has grown by only 0.6 per cent. And remember that when the population is growing fast, one might reasonably expected recorded consumption to be growing even faster – after all, those new people all need tables and chairs, washing machines, fridges and other consumer durables (that might actually be used over many years, but are measured as consumption at the point of purchase).
And for all the talk of “wealth effects” from rising house prices – even though higher house prices only redistribute wealth, they don’t make New Zealanders as a whole better off – there isn’t much sign of it here. I’ve run previously the chart of (nominal) consumption as a share of GDP, which has been largely stable for 30 years, despite the repeated surges upwards in the level of house prices.
What about investment? Over a long period of time, New Zealand has tended to devote a surprisingly small share of its GDP to investment, even though our population growth rate has been well above average, and larger populations need a larger stock of capital. Among the IMF “advanced economies”, the median country devoted 23.6 per cent of GDP to investment over the period 1980 to 2015. By contrast, New Zealand devoted 22.7 per cent of GDP to investment – even though our population increased by around 50 per cent over that period, and the median advanced country’s population increased by around 30 per cent. When the population surges, a country typically needs to see quite a lot more investment taking place if growth in per capita living standards is to keep pace with that in countries with slower growing populations.

Right at the moment, total investment as a share of GDP in New Zealand is a bit larger than in the typical advanced economy. But in the last year, our population has increased by 2 per cent, and the median advanced economy has had population growth of around 0.5 per cent. And our investment numbers are boosted by the Christchurch rebuild and repair process, replacing capacity destroyed by a natural disaster. To maintain the ratios of capital to output typical of a modern successful economy (around 3:1), in the face of such large population growth differentials, one might have hoped to see investment as a share of GDP here perhaps 4 percentage points higher than in other advanced economies. The actual margin is less than 2 percentage points, and even that margin includes the substantial rebuild spending.
What about our own national accounts data?

Here is non-housing investment spending as a share of GDP. Even though population growth is now exceeding even that in the early 2000s, the non-housing investment share of GDP has recovered very little since the recession. When we finally get the annual capital stock data, we are likely to see very growth in the non-housing per capita capital stock at all. When even entirely orthodox bodies such as the Productivity Commission produce modelling results in which immigration comes at a modest cost to the recipient country, while the sending country gains a little – and that was the modelling (of the trans-Tasman flow) that the Australian and New Zealand Productivity Commissions jointly reported a couple of years ago – the mechanism in the model is typically through a sluggish adjustment of the capital stock. Ours just has not kept up with the rapid growth in our population. Some of that is probably about government infrastructure, but mostly it will be because firms have not found sufficiently attractive investment opportunities.
And much of that must be about the unattractiveness/uneconomic nature of expanding exports rapidly from New Zealand. Here is the chart of exports to GDP.

I wouldn’t focus too much on the 2000 spike – it was the outcome of a rare combination of events in which our commodity prices were quite high, and our exchange rate was very low – the latter as much about events in the US as here. But with very few exceptions, countries – and especially small countries – don’t prosper – and catch up with the best in the world – if their firms can’t find ways to profitably sell more, better, and more valuable stuff in competition with international producers. Despite our booming (subsidized) export education sector, and our booming tourism sector, exports as a share of GDP last quarter were largely unchanged from a level first reached 25 years earlier. Yes, there is some variability in the series, but the peaks haven’t been getting any higher for a long time now. And this is the series that government policy is supposedly set to get to around 40 per cent…….
The outcomes shouldn’t really be very surprising. The highest real interest rates in the OECD, a real exchange rate that has never sustainably adjusted to reflect our economic decline, and the perils of a location that make it difficult anyway to build internationally competitive firms relying on anything other than location-specific natural resources. And yet our policymakers for some reason think that even more people is part of solving the problem. If anything, it looks to have been make things worse – making it harder to overcome our natural disadvantages. Our per capita capital stock adjusts at best sluggishly, and the per capita stock of natural capital just keeps falling (ie no more natural resources are being made).
Just to illustrate quite how unusual what is going on with our population is, in international terms, here is a chart I ran a few weeks ago showing annual population growth rates back to the 1950s, for New Zealand, the world (ie mostly the emerging/developing/poorer bits), and what the UN terms the “more developed regions”.

Population growth rates have been tailing off for decades, in advanced countries and in the world as whole. But this year, New Zealand’s population growth rate (see very first chart) will be similar to those we saw in the 1950s. Our productivity performance was already tailing off then, but at least we still had among the highest material living standards anywhere. Quite why our politicians and their advisers think that such rapid population growth – policy-induced population growth – relative to the rest of the advanced world makes sense now, when our people are already so much poorer than most of those in the rest of the advanced world – is one of the questions we really deserve a serious and considered answer to.
