When Australia’s unemployment drops, more people will go there again

I had things more interesting (at least to me) to write about today, but I heard the Minister of Finance on Morning Report talking up the alleged strength of the New Zealand economy, noting that we were now – in some way or another –  doing what south-east Queensland had done previously, becoming all that we always wanted to be, and so New Zealanders weren’t fleeing the country any more.  He was careful not to suggest that the diaspora is coming home –  they simply aren’t, and haven’t at any time in the 40 years since the large trend net outflow began.    As if it is somehow relevant to current New Zealand immigration policy debates – and recall that immigration policy is about non-citizens – he and others keep telling us “but they could”.    It can happen.  It did to some extent in Ireland, but it happened there after they structurally transformed their economy and successfully lifted their productivity performance.  There is no sign of such a successful transformation here, whether under this government or the long run of its predecessors.

I’ve run this cartoon before
richardson

As I noted, since this was first run in early 1991

…. we’ve had Bill Birch, Winston Peters, Bill English, Michael Cullen, and Bill English again, and although we’ve had plenty of cyclical ups and downs, never at any time have we looked like successfully or sustainably reversing our relative economic decline.

And now we can add Steven Joyce to the list.

But what about those net migration flows to Australia that the Minister was talking about?

net PLT to Aus

Going back 1978/79, I’ve shown three different measures of net outflow here:

  • New Zealand citizens only
  • New Zealand and Australian citizens (the group not requiring specific approval to move trans-Tasman)
  • all citizenships

Mostly the patterns are all but identical, and dominated by fluctuations in the movement of New Zealand citizens.  That makes sense: New Zealanders are free to move, and New Zealand has been materially poorer than  Australia throughout this almost 40 year period.     And over that period, there is no very obvious change in the trend –  just large average outflows, but very large cyclical fluctuations in those net outflows.

It is interesting that right at the end of the chart there is some divergence.  Over the last year, for the first time in 40 years, there has been a net inflow of around 2000 non New Zealand/non-Australian citizens from Australia.  I’m not quite sure why that is, but it is broadly consistent with the theme of this post.  Given a choice between going to Australia or staying in New Zealand, not many people tend to go when the Australian labour market is weak.     Over the last 12 months, a net 4206 New Zealanders left for Australia, but that is a lot lower than the average of around 25000 in a typical year.

In that chart above there have been five episodes when the net flow to Australia (on any of the measures shrunk a lot for a period).  The peaks were around:

  • 1982/83
  • 1991
  • 2002/03
  • 2009/10
  • the present.

And here is a chart of Australia’s unemployment rate.

Aus U

It  shouldn’t be any great surprise that all those temporary reductions in the net outflow to Australia coincided with periods of increased unemployment in Australia.  If anything, the Australian unemployment rate looks more important as an explanatory factor than, say, the difference between the New Zealand and Australian unemployment rates.   In 1991, for example, both countries had very high unemployment  –  and at present both countries have unemployment rates well above pre-recession levels.

The greater importance of the Australian unemployment rate shouldn’t be a surprise.  New Zealanders don’t need to have a firm job offer, or advance approval, to move to Australia.  They can do so “on spec”, looking for work once they arrive.   But a typical person will be much less likely to take that risk if the search process in Australia is going to be long and arduous and might fail altogether.  And the risks have increased over the years, as Australian first tightened access to welfare for New Zealanders living in Australia, and then as people become more aware of the rather limited entitlements New Zealanders have there, even if they have been in Australia for some years.

It isn’t a mechanical relationship of course.  And the Australian unemployment rate now –  at around 6 per cent –  is a lot lower than it was in those 1983 and 1991 peaks.  But since the wage gaps between New Zealand and Australia haven’t narrowed at all, and the productivity gaps have continued to widen,  it seems only prudent to assume that as and when the Australian labour market improves, the net outflow to Australia will resume in something like full historical numbers.

In the repeated burble from the government about the alleged strength of the New Zealand economy, it is often overlooked that while our unemployment rate is not high in absolute terms it is still well above what we experienced pre-recession, and more so than is the case for most other advanced countries that have control of their own monetary policy.   And Australia is in much the same position,

U rates in floaters

And even most of these countries largely ran out of conventional monetary policy room.  Neither New Zealand or Australia did.   Neither labour market is that strong.  Against that backdrop it shouldn’t really be surprising that the outflow to Australia has temporarily slowed.   It doesn’t reflect any credit (or discredit for that matter) on our government.  It looks like mostly a cyclical issue in Australia.  An easier stance of policy by the Reserve Bank of Australia  –  which would have been warranted with inflation persistently below target – would probably have seen rather stronger outflows even over the last couple of years.

UPDATE:  Just to reinforce the point about Australian unemployment, here is an ABS chart from a few months ago highlighting how their underemployment measure has not fallen even as the official unemployment rate has.

Graph 1, Unemployment and Underemployment rate, November 1980 to November 2016
Graph: Graph 1, Unemployment and Underemployment rate, November 1980 to November 2016


Bits and pieces

As regular readers will know I have been uneasy about whether the Minister of Finance’s recent appointment of Grant Spencer as acting Governor of the Reserve Bank (while pragmatic) is in fact lawful.    I dealt with the issue first on the day the appointment was announced, and again when the Bank’s Board, the Treasury, and the Minister of Finance released material in response to my OIA request.

What made me most uneasy is that there was no suggestion in any of the papers –  whether the Board’s recommendation to the Minister, the Minister’s Cabinet paper, or in any of the various Treasury papers –  that officials, the Board, or the Minister had even considered seriously the lawfulness of such an appointment.  There is no summary of any legal advice in any of the papers, and no reference to the issue.  This is so even though the Act quite clearly makes the Policy Targets Agreement (PTA) the centrepiece of the balance between autonomy and accountability, and yet it makes no reference to the possibility of a PTA in a case where an acting Governor is appointed after a Governor’s term, and that Governor’s PTA, expires.   As an expression of good intent, the Minister of Finance and the incoming acting Governor have indicated that they expect policy will continue to be conducted according to the current PTA, but……(a) the whole point of the acting appointment is that Grant Spencer will take office a few days after the election (so the current Minister of Finance may be irrelevant) and (b) none of this is legally binding, even though the monetary policy provisions of the Act are built around quite detailed, and legally binding, rules.

All three agencies/people noted that they had withheld legal advice (from the Reserve Bank’s in-house lawyer and from Crown Law).  That wasn’t a surprise.   Protection of legal professional privilege is a grounds on which material can be withheld under the OIA.  But it is not an absolute grounds, and any possibility of withholding such material on that ground must first consider whether the public interest is such that the material should be released.  Recall that the whole point of the OIA is to allow more effective public scrutinty, accountability, and participation in public affairs.

I was initially inclined to let the matter lie.   But on further reflection, and having a look at some of the material the Ombudsman has put out in recent years (and a report of an even more recent decision), in which it has been ruled that either legal advice, or a summary of it, should be released, I have decided to lodge an appeal with the Ombudsman in this case.     It isn’t a case where, for example, the legal advice is contingent on facts known only to the parties commissioning the advice.  The relevant facts are all in the public domain already.  All that is being protected is the assessment of the interpretation of legislation on which powerful government entities are acting/advising.  If their interpretation of the acting Governor provisions is robust –  and it may well be –  then the Act is less robust –  in ensuring that the monetary policy decisionmaker is at arms-length from the Minister (not eg subject to six monthly rollovers), and yet is at all times subject to a legally binding accountability framework –  than had previously been thought.     There is a clear public interest in us being aware of any analysis the government, the Board, and the Treasury are relying on in making an appointment of this sort.  They act on those interpretations, and in so doing create “facts on the ground”.

I suppose it will take some considerable time for the Ombudsman’s office to get to this request –  perhaps even after the acting Governor’s term has ended –  but with the possibility of reviews to the Reserve Bank Act governance provisions in the next couple of years, it would still be valuable for this advice and intepretation (in full or in summary) to be put in the public domain. This is, after all, about the appointment and accountability provisions for the most powerful unelected public office in New Zealand.

On another matter altogther, I noted the other day that one of my readers, and periodic commenter, Blair Pritchard had published his own set of policy proposals for New Zealand.   Blair sets out seven policy goals and 15 policy proposals under the heading What’s a platform Kiwi Millenials could all get behind?    There is lots to like in his agenda –  and he graciously refers readers to some of my ideas/analysis –  although I’m sure most people, even non-millenials,  will also find things to strongly disagree with (for me, cycleways and compulsory savings –  although I’m also sceptical of nominal GDP targeting).      But I’d commend it to readers as a serious attempt to think about what steps might make a real and positive difference in tackling the challenges facing New Zealand.  And I really must get round to a post on a Nordic approach to taxing capital income –  one of the topics that has been on my list for two years now, and never quite made it to the top.   Cutting company taxes is the headline-grabbing option, and it would make quite a difference to potential foreign investors, but for New Zealanders pondering establishing and expanding businesses here, the company tax rate is much less important than the final rate of taxation on capital income which, in an imputation system, is determined by the personal income tax scale.   The Nordic approach quite openly sets out to tax capital income more lightly than labour income.   It isn’t a politically popular direction at present, but is the direction we should be heading, if we want to give ourselves the best chance of closing those persistent productivity chasms.


Tradables sectors in New Zealand and Australia

I have to spend the morning on the gruesome business of trying to make progress in unpicking 20 years of mismanagement of the Reserve Bank pension fund, dating back in some cases almost 30 years.  So this morning’s post will be short.

First, the latest update of my quarterly chart of real per capita tradables and non-tradables GDP.  Regular readers will recall that this is a rather rough proxy –  first developed by the IMF when they were highlighting New Zealand imbalances more than a decade ago.   For these purposes, the tradables sector is the primary and manufacturing components of production GDP, plus the exports of services from expenditure GDP.   The rest of GDP is treated as non-tradables.  Both series are indexed to 100 in the first quarter of 1991, which is when the official quarterly population series begins.

T and NT components NZ to Dec qtr 16

It isn’t a pretty picture.  There has been no growth in real per capita tradables sector GDP (on this proxy) for 17 years.   The peak in the series was in 2004, and if anything it has been trending down since then.  A year or two ago, it looked as though some sort of rebound was underway –  all those tourists and foreign students –  but even some of that growth has been reversed in the last few quarters.  Successful economies –  ones that catch up with the leaders, which record strong productivity growth –  tend to be those with relatively fast-growing exports, and strongly-performing tradables sectors.   A reasonable interpretation of what has gone on is that whatever factors led to the exchange rate being so persistently high –  since around 2003/04 –  will have accounted for the weak tradables sector performance.

Once upon a time, while I was at Treasury, we had someone do similar charts for a wide range of OECD countries.  I’ve only done one for Australia.  Here is what it looks like –  same definition,  based to the same date as the New Zealand one, and on the same scale.

Aus T and NT to Dec 16

Australia didn’t see much growth in real per capita tradables sector output over the 2000s.   In a way, that wasn’t surprising.  They had a huge terms of trade boom, which gave them more income to spend, without needing to produce any more tradables to sell abroad.  And they also had a massive business investment boom –  increasing future production capacity in the minerals sector –  which will have squeezed out tradables sector production during the investment phase.   But over the last five years, growth in real per capita tradables GDP has resumed again – even growing a bit faster than the non-tradables sector.   Perhaps (but only perhaps) there is some connection with the divergent labour productivity performance in the two economies in recent years.

real gdp phw dec 16 release

And for anyone wondering if the performance in the 1990s, when tradables and non-tradables production more or less kept pace, was unusual, in Australia (but not in New Zealand) there is the data to do the tradables/non-tradables GDP chart all the way back to the mid 1970s.  Here it is.

aus t and nt to 74

The sort of pattern we’ve seen –  17 years of no per capita growth in the tradables sector –  doesn’t look like the sort of feature one expects in a successful economy, poised to catch up with the rest of world, reversing decades of relative decline.  Sadly, of course, New Zealand hasn’t been such an economy.  On current policies, there is little reason to expect anything very different in the foreseeable future.

The New Zealand Initiative’s manifesto

I mentioned yesterday that the New Zealand Initiative had released its Manifesto 2017: What the next New Zealand government should do.   When I sat down and read it I came away with mixed feelings.   There are quite of lot of specifics I agree with, which shouldn’t be a surprise: the Initiative is variously described as pro-business, neo-liberal (both, for different reasons, unhelpful descriptions –  they are generally pro-market rather than pro-business) or just plain “right wing”.  And I was summed up a few weeks ago by one journalist as being on the ‘dryish right of the spectrum’, which sounded roughly correct.   We have our (large) differences over New Zealand immigration policy, and I’m a conservative while they often tend towards a libertarian view of the world, but there is often a lot of overlap in the sorts of policies we would favour.   In fact in some areas I think they are far too trusting of central and local government.

I said I had mixed feelings.  That is mostly because of the elephant in the room which in the Manifesto they almost entirely ignore –  our long-term economic underperformance.  The author  –  Initiative director Oliver Hartwich –  is a recent migrant, clearly enraptured by New Zealand.   That’s nice, but it rather ignores the things – the underperformance –  that has led to such a large exodus of New Zealanders over the last 40 years or so.   The relentlessly upbeat tone often comes across as almost delusional –  which isn’t a good start to what he claims is “more than a collection of randomly assembled policies –  it is an intellectual guide for imminent challenges”.

But what do they propose –  drawing on many of the studies they have put out over their first five years of operation?   As another (interesting – left wing) commentary on the Manifesto noted it is all “divided handily into six different sections and 28 different proposals”.

The first set are about housing

• abolish all rural-urban boundaries;
• abolish all height and density controls;
• strengthen property rights by introducing a presumption in
favour of development into the Resource Management Act;
• incentivise councils for development by letting them capture
the GST component of new buildings; and
• introduce MUDs but ideally give them a more appealing name
(maybe Community Development Districts).

I’m sympathetic to the broad direction of what they propose, but

  • I don’t agree with abolishing all height and density controls on existing urban land (as distinct from newly developed land).    Were it not for council rules, private landowners would in many cases have negotiated such restrictions themselves (as we see in the covenants in many new subdivisions) –  waiving or trading them as and when mutually beneficial opportunities arose.   My preference would be to devolve  most existing restrictions to groups of existing landowners, and allow them to transact among themselves to permit (or not) greater height and density.
  • I’m very sceptical of the Initiative’s support for disbursing GST revenue to local authorities.  It seems like an opportunistic response to current pressures, which would quite dramatically overturn the sort of fiscal arrangements we’ve had since 1876 (and the end of provincial governments).    Local authorites have their own revenue base –  one generally favoured by economists as, in principle, less distortionary than most –  and I’m not aware of provisions preventing differential rates.

The second set of recommendations is around education

• create an attractive career structure for teachers;
• provide tailored professional development for teachers;
• monitor teacher performance and introduce performance based
appraisals;
• evaluate systematically the impact of interventions on
school performance; and
• expand school clusters as a means of sharing best practice.

I haven’t read all their material on education, so perhaps I’ve missed something.   The general direction seems fine, but this is one of those areas where they seem to be too ready to trust governments to get things right.    I imagine that in the Business Roundtable days there would have been a lot more talk about genuine school choice –  not just a few charter schools for targeted groups at the bottom, but much more genuine choice (public vs private, religious vs secular, non-profit vs for-profit etc) of provider for all parents, including greater choice about what is taught  I probably shouldn’t be surprised, but as I’ve listened to my children over the years I’ve been surprised at just how much ‘indoctrination’ –  of conventional left-wing/’progressive’ causes –  goes on in our state schools; some of it conscious, much of it no doubt unconscious.   The Initiative seems more focused on making the state behemoth work better –  not necessarily a poor goal in its own limited way –  rather than backing what I’d have thought would be a belief in markets, civil society etc.

Then they move on to foreign direct investment (where Bryce Wilkinson did some really useful work over several reports).  Here they recommend

• Abolish the Overseas Investment Act. There should be no
FDI regime.
• Subject all investors, domestic and foreign, to the same rules.
• Protect New Zealanders’ property rights, including the
freedom to sell to whoever they wish. In cases of public
interest, appropriate compensation must be made.

I’d mostly agree with them, with four caveats:

  • having gone to great lengths over the years to put in place good governance arrangements for our own SOEs, and in many cases to privatise them, I’m much less relaxed than the Initiative seems to be about allowing foreign SOEs –  particular those from countries with, shall we say, weak governance traditions –  to take on substantial roles in New Zealand.  We might not suffer the poor returns to capital, but we still face potential efficiency losses.  I have a strong prior that genuine private sector entities investing here will, on average, be mutually beneficial.  One can’t extend the same presumption to organs of foreign states.
  • in certain extreme circumstances – but they are extreme and rare – I’d be uneasy about allowing concentrated foreign ownership of New Zealand land.  Had the Soviet Union during the Cold War wanted to buy up, say, most of Northland, it would have been dangerous and reckless to agree.  It is fine to counter with “but the land is still New Zealand, subject to New Zealand law”.  But one has to have the capacity to enforce that law.  Geopolitical threats are, at times, real.   My own halfway house would be to abolish controls on any investments from OECD member countries, and add to that list on a case-by-case basis.
  • while I largely agree with the Initiative on FDI, I suspect it is a less important issue (in terms of potential economic gains) than they do.  Why?  Because the restrictions seem to bear most heavily on land purchases (not the sort of high-tech industries often touted as the way of the future –  or even banks or oil explorers), and we already put so many other restrictions on land use (eg restrictions on GE products) that I’m sceptical that there is currently much in the economic case for liberalising foreign land purchases.
  • I’m not totally averse to restrictions on non-resident foreigners purchasing residential properties in New Zealand –  at least as some sort of third best, if governments can’t/won’t fix up land supply issues or the (aggravating) population pressures.

The next section is about better regulation (or better law).  They propose

• No new law or regulation shall be introduced without a
cost-benefit assessment that demonstrates real gains for the
public and costs fairly shared.
• Regulatory reform cannot be delegated to a junior minister
but needs real commitment from the prime minister down.
• The regulatory culture should shift from one of ticking
boxes and managing risk to encouraging greater flexibility
and innovation.

and they repeat a line from a previous report

Over-reliance on primary legislation: New Zealand’s overreliance
on primary legislation is unusual by international
standards. Other countries use more secondary and
tertiary legislation to amend outdated rules. Most
regulatory changes in New Zealand require amendments
only Parliament can make.

In general, I’m sympathetic to the direction they propose, but

  • I’m all for good cost-benefit assessments, but am less convinced of the argument that it should have to be demonstrated that “costs are fairly shared”.  After all, it is rare legislation (primary or otherwise) that affects most people equally, and part of politics is differences in views of what is “fair”,
  • Is anyone in favour of “tick boxes” approaches?  I doubt it, although actual regulation often drifts towards that sort of outcome.  Flexibility and innovation are laudable goals, but so is predictability and certainty when citizens are dealing with the state,
  • I strongly disagree with them when they want to reduce reliance on primary legislation. For too much law-making power is already delegated by Parliament to ministers and official agencies.  It is a technocrat’s dream, but a citizen’s nightmare.

They then move on to social policy

• Social policy is not a silo and should be regarded as a whole-of-
government task.
• Fixing New Zealand’s housing affordability crisis is crucial
to addressing both income-related poverty measures and
inequality concerns.
• To provide all New Zealanders with good life opportunities,
special attention needs to be paid to education. More
targeted support for students from lower deciles should take
precedence over untargeted programmes such as interest-free
student loans.
• Taxes and regulations should not choke off employers’
incentive to create jobs for the available skills or deprive
those with those skills of the incentive to work.
• The government’s plan to trial new ways of delivering social
services such as social bonds is laudable.

My thoughts?

  • I’m rather sceptical –  but open to persuasion –  on the merits of “social bonds”.
  • I’m more than sceptical of the big-government first bullet.   The logic sounds compelling at first blush –  and if fiscal savings were the only focus it might be persuasive –  but it is a path that undermines privacy and autonomy, delivering more and more information to an overweening state.
  • It is striking how the Initiative –  like the government, and no doubt the Opposition –  are reluctant to ever go near the role public policies have played in corroding cultures and giving rise to the welfare-dependency and other social problems joined-up government is now supposed to be trusted to deal with.

And then they turn to local government

• Local communities should share the benefits that accrue
to central government from extractive industries and
growth. Local government should receive financial benefits
for creating economic growth (and suffer a loss when it
does not).
• Central and local government need to better define their
responsibilities to preclude cost-shifting and blame games,
and enhance accountability.
• Special economic zones would increase flexibility and
regional variability of economic policy.

Here I largely disagree with them (and probably side more with the former Business Roundtable, which favoured restricting more tightly the activities of local government).

  • the second bullet is vacuous.  It is what politics is.
  • I documented my scepticism about their special economic zones idea in a post in 2015.
  • For all their talk of how many local authorities France or Germany have, it is worth remembering that this country has a total population not much different from that of a typical US state.  Do we really think we have the policy capability for dozens of different economic policies?  And what do we make of the demonstrated capability of local bodies?  I know the Wellington City Council is one of the members of the Initiative, so perhaps they have to be polite, but it is a local body that hankers after uneconomic runway extensions, expensive convention centres and film museums, extraordinarily expensive town hall refurbishments, all while then going to cap in hand to government to sort out the water supply risks in an earthquake (a fairly basic function I’d have thought) I simply don’t understand why the Initiative wants to give more scope to local bodies.  Perhaps it worked in Germany, but there is little sign it does here.
  • I was also a bit flabbergasted when the Initiative seemed to lament local council reliance of property taxes.  Local body rates aren’t a pure land tax, but they are probably further towards the non-distortionary end of the spectrum than most other possible taxes.

Their final section is about economic growth.  There is plenty to agree with them on there.

Imagine if we could achieve an annual productivity
growth of 2% per year from now until 2060 instead of, say,
1.5%. Half a percent may not sound much. But through the
power of compound growth, it makes a substantial difference
to economic output.

By 2060, GDP per capita would be 22% higher (or about
$22,000 per person in today’s dollars) if we achieved 2%
productivity growth instead of 1.5%.    ……

Creating a dynamic, growing economy is essential if we do
not want to end up like some European countries that have not
generated enough growth over the past decades, and are now
paying a heavy social and economic price for it.

All good stuff, but…….there is not a single policy recommendation in this section of the Manifesto. Not one.

I suppose their defence will be that the earlier report they were drawing from was about making the case for economic growth, as against those who doubt it is something worth focusing on.   But this is a policy manifesto, you are an (economics-based) think tank, and you have nothing specific to offer on diagnosing the causes of New Zealand’s disappointing long-term economic performance, and nothing on remedying it.    It seems quite a large gap in the manifesto.    No doubt, the Initiative would argue –  and fairly –  that some of their other proposals would lift productivity and per capita GDP, but I doubt any serious observer would think that list –  even if all the items on it were adopted –  would be more than modestly helpful in reversing our decline.  After all, we did much more ambitious reforms –  in the same general spirit –  in the 1980s and early 1990s and they didn’t.  (And for those about to comment  “so what would you do”, I dealt with a list of things I’d favour in a post last year.)

Various omissions from the Manifesto struck me.  Having just launched a major report on immigration, it was surprising to see almost nothing on that topic, not even on ways to improve the current system.  Writing about the Manifesto at Spinoff, Simon Wilson noted

Still, I’ll give them this: they don’t believe cutting taxes is the cure for all ills and they don’t bang that old privatisation drum much either. For neoliberals, both those things are revolutionary. Credit where it’s due.

In fact, as far I could see there was nothing about lowering taxes at all, even though our company tax rate is towards the upper end of those in OECD countries.  I guess the Initiative hasn’t done a report about the tax system –  perhaps it will be a topic if there is a change of government, given that the Opposition parties propose a tax working group.  Perhaps too there are no votes in arguing for lower company tax rates –  in an overheated climate of angst about multinationals and tax –  but, as the Initiative note, the role of a think tank shouldn’t be to be popular.

And now to revert to my earlier comments about the tone of the scene-setting introductory chapter.  It is relentlessly upbeat.  Apparently

New Zealand is not just doing well but doing spectacularly well on many measures.

And

Instead of taking this performance for granted, we need to celebrate it.

Ending on tones that could have been taken from Land of Hope and Glory

Land of Hope and Glory, Mother of the Free,
How shall we extol thee, who are born of thee?
Wider still and wider shall thy bounds be set;
God, who made thee mighty, make thee mightier yet,
God, who made thee mighty, make thee mightier yet.

Or, as the Initiative puts it

the Initiative takes great pride and satisfaction in helping make our great country greater still.

Of course there is a lot to like about New Zealand.  Most countries in the world have far lower material living standards, however one wants to assess them.

But what the Initiative seems to want its readers to forget – and perhaps it is just because many of their staff are so new to New Zealand that that history hasn’t yet made much impression –  is that not long ago,  New Zealand wasn’t just better than most countries, it was a better place to live than almost all of them.  Norway was somewhere well down the scale, as were France and Germany, let alone Singapore and Japan.  One can’t put too much weight on single estimates for single years, but 100 years ago we vied only with the US, Australia and perhaps the UK and Switzerland for top ranking.  My grandparents were just starting out in the workforce then.  Even in early 1950s –  when my parents were starting out –  we were still in the top handful, helped a bit by escaping the direct ravages of war.      And now?     Now, whether you look at GDP per capita or GDP per hour worked, or dig down and look at NNI (net national income) measures, we don’t score well.  Of the OECD countries, we are perhaps 23rd, and showing no signs of improving.  In the league tables, and depending on your precise measure, we vie with places like Slovenia and Slovakia (still regions of communist countries when we were doing our liberalising reforms in the 1980s) and Greece, Israel, Korea and Spain.   In our European history, New Zealand has never before been as poor and relatively unproductive as these countries.   And as the Initiative rightly stresses, economic growth –  and surely even they mean it in per capita terms –  matters.    We haven’t delivered it, and there is no point pretending otherwise.

Is GDP everything? No, of course not.   But if you want a balanced assessment of New Zealand –  and such hardheaded asssessments are the only sensible starting point for good diagnosis and prescription –  one could also point to things like:

  • a homicide rate that is around the middle of OECD countries,
  • an incarceration rate (a “fiscal and moral failure” as the Prime Minister put it) far higher than most,
  • shocking domestic violence rates,
  • wide disparities between Maori and Maori economic and life outcomes,
  • as well as more mundane, but ubiquitous, scandals like the housing market.

Oliver Hartwich is glad to have come to New Zealand.  He’s found a good niche here and I wish him all the best.  Life is comfortable for upper income people in central Wellington.     But what have New Zealanders been doing?

Here is the chart, since 1950, of the cumulative net immigration flow of New Zealand citizens.

net plt flow of nz citizens

In the 50 years to 2016 that was a net outflow of 963000 New Zealanders.   The average population over that 50 years was about 3.7 million.  Roughly a quarter of all New Zealanders have left (net) and not come back.  It is a staggering symptom of failure and underperformance here, that so many people –  in a relatively rich country –  saw what they regarded as  better opportunities abroad and went after them.      Well-performing countries just don’t experience that sort of exodus.  Most of us don’t want a repeat, or a resumption of larger scale outflows once the Australian labour market picks up.  But to read the New Zealand Initiative’s report, one wouldn’t even know it was an issue.

Nearing the end of his rhapsodic introduction Hartwich observes

For policy experts such as my colleagues at the Initiative, New Zealand does not provide the same challenges one faces in solving the Greek debt crisis, organising Brexit, or fighting home-grown extremism.

It should.  After all, that sort of outflow of our own people, that sort of sustained economic underperformance, is unknown in reasonably well-governed countries in modern times.  If I can end on my own modestly upbeat note, we aren’t Argentina, Venezuela or Cuba……and yet we’ve experienced the staggering slippage that shows no sign of reversing itself.    There are plenty of challenges for the next manifesto, if they interested in actually engaging with the specifics of New Zealand’s experience.

Natural resources: Norway and the UK

How natural resources contribute to the prosperity of nations is much-debated.   There is little doubt that a) natural resources can be wasted, mismanaged etc, such that a country well-provided for by nature still ends up pretty poor (Zambia is my favourite example, partly because I worked there), and b) that it is perfectly feasible for some countries to do very well indeed with little in the way of natural resources (one could think of Singapore or Japan, but also Belgium or Switzerland).    The quality of the human capital of the people in a place, and the “institutions” that are put in place or sustained, make a huge difference.   Location looks as though it might matter too.

But equally, it is easy to think of countries where it is pretty clear that natural resources have made a great deal of difference indeed in lifting the economic prosperity of the nation.  One could think of Saudi Arabia, Kuwait, Brunei, Equatorial Guinea and so on.  It isn’t natural resources in isolation that makes them rich –  Iraq and Iran still manage to mess themselves up –  but in combination with some basic level of property rights, institutional quality, and human capital (native or imported) the natural resources have lifted living standards in such countries above levels that could otherwise readily be explained.

The quantity of natural resources in each country is fixed.    That doesn’t mean that what can be done with those resources is fixed –  able people and smart technologies find more efficient ways of extracting the resources or utilising them.  We’ve seen that in New Zealand with the growth of agricultural sector productivity over 150 years or more.  But the fact that the endowment is fixed means that each additional person added to the country reduces the average per capita value of that endowment.  If the natural resource stock is small to start with, it isn’t a point worth bothering about (and so a lot of economic models largely ignore fixed factors).    But if it is a large part of what an economy produces, and exports, it can matter rather a lot.  It is why I’m unconvinced that rapid immigration policy driven population increase makes a lot of sense in New Zealand or Australia, where the overwhelming bulk of what we sell abroad is natural resource dependent.   The point is more immediately pressing in New Zealand –  where we haven’t uncovered major new natural resources for a long time –  than in Australia, but is no less conceptually relevant there.

In this post, I wanted to illustrate the point by looking at the experience of Norway and Britain with North Sea oil and gas.  The oil and gas were always there, but weren’t known about for most of history –  and even if they had been known about, it wasn’t until offshore drilling and processing technology got to a certain point that the resources had much value.  By the 1970s, Britain and Norway were beginning to get into oil and gas production.

Britain and Norway were both advanced economies in 1970, drawing on the skills and talents of their people and growth-friendly institutions and cultures.  Natural resources probably matter a bit more in Norway, but oil and gas weren’t then among those resources.  And in 1970, OECD data indicate that GDP per hour worked in the two countries (converted at PPP exchange rates) were about the same.  As it happens, GDP per hour worked in New Zealand then was around the same level.

norway uk nom gdp phwThese days, by contrast, GDP per hour worked in Norway is around 60 per cent higher than that in the UK  (which is in turn quite a bit higher than New Zealand’s).  Norway has among the very highest material living standards of OECD countries, and the UK is still in the middle of the pack.

Here are the charts for total oil and gas production in the two countries since 1970, using data taken from the BP Statistical Review of World Energy.

First oil

oil prodn

And then gas

gas prodn

Over the 40 years to 2015, the two countries each produced roughly the same amount of oil and the same amount of gas.

There are all sorts of differences between the two countries. I’ll come back to some of those, but the first I wanted to emphasise was population.  Norway now has around five million people, and the UK currently has around 65 million.

Here is per capita oil and gas production for the two countries.

oil pc

gas pc

That “windfall” –  the discovery of large recoverable oil and gas resources –  made a big per capita difference in lightly populated Norway, and not much of one in heavily-populated Britain.

Determined sceptics might argue that it is all a mirage and that somehow Norway would have got to its current living standards anyway.  If I was focusing on GDP per capita they could, for example, point out that in Norway a materially larger share of population is employed than in the UK.  But, as it happened, I was focusing here on GDP per hour worked (and if anything, employing a higher share of the population should probably lower, at least a bit, average output per hour, if the less productive people are the last to be draw into the workforce).  As it happens too, the employment/population gap between Britain and Norway is narrower than it was in 1970.

Perhaps too people might set out looking for areas in which Norwegian policy is superior to that in the United Kingdom.    But there isn’t much to find.   As a share of GDP, for example, government spending in Norway has typically been larger than it is in the UK.

gen govt spending uk and norway

And I went through the structural policy indicators released last week as part of the OECD’s Going for Growth.   Norway isn’t badly run by any means, but on a majority of the indicators Norway scores less well than the UK.

Location probably favours the UK as well –  the south of England is very close, and accessible to, the high productivity populous countries of France, Belgium, Netherlands, Germany.  Norway isn’t remote –  certainly not by New Zealand standards –  but it isn’t quite as advantageously located for prosperity as the UK is.

In sum,  don’t think any dispassionate observer would doubt that oil/gas –  combined with the responsible management of the revenue –  is what explains Norway’s rise over the last few decades to the top of the OECD league tables.  And if, by some historical chance, there had been 65 million people living there, rather than the five million who actually were, it just wouldn’t have made very much difference.  For the UK, the oil and gas were a “nice to have”.  For lightly-populated Norway they made a great deal of difference.

For New Zealand, for whom extreme remoteness is a given, and where fixed natural resources make up so much of our export earnings, it is something to think about.   There is a reasonable alternative story to tell under which the average New Zealander would have been better off –  given the current state of global and local technology etc –  if there were three million of us not 4.7 million.  Perhaps that would have been the case, if we hadn’t restarted large scale immigration after World War Two.

Do big countries get richer (or more productive) faster?

The short answer appears to be “no”.

Much of the debate around the appropriate immigration policy for New Zealand seems to have as a sub-text (implicitly or otherwise) a sense that New Zealand population is just too small, and that if only we had more people we would be richer (per capita) and more productive.     Those who run, or rely, on this line rarely seem to engage with the estimates that New Zealand’s GDP per capita was at its peak, relative to incomes in other countries, at a time (around 100 years ago) when our population was about a quarter of what it is now.  (Of course, the population of other countries has also grown since then, but in most advanced countries the population growth rate has been much slower than in New Zealand –  the UK had about 45m people 100 years ago and about 65m now.)

In their recent report in support of New Zealand’s immigration policy, the New Zealand Initiative joined the group of those arguing that a larger population would be good for New Zealand’s per capita income and productivity.

I wrote about this point in a post back in 2015, in which I observed

I’ve long been fairly sceptical of that proposition. A casual glance around the world suggests no very obvious relationship. The United States and Iceland co-exist, and Japan and Singapore. At the other ends of the income spectrum, India and Bhutan, and Brazil and Costa Rica. There are all sorts of arguments advanced around the economics of agglomeration, and that analysis seems to work quite well in describing what happens within countries. But it does much less well in describing economic performance across countries. And as I’ve pointed out to people previously, if the real economic opportunities in big countries were so much superior to those in small countries, large countries would tend to have (more high-yielding projects and) higher real interest rates than small countries. But they don’t.

Over recent decades we’ve also seen many more smaller countries emerging, presumably because the people in those places concluded they wouldn’t pay too much of a price to be independent.

In the earlier post, I included some scatter plots suggesting that there was basically no relationship at all between the size of country and the subsequent growth in its real GDP per capita or productivity (real GDP per hour worked).    In this post I’m looking at much the same relationships, but this time just using the Conference Board’s Total Economy Database, which starts in 1950.

One of the challenges in any work in this area is that people tend to flow to rich and successful countries.  Indeed, plausibly in a successful fast-growing country, people might even be willing have more children on average.   The simplest way to correct for that is to take the population level at some historical point in time and then look at per capita growth subsequently.   Here is a chart for 33 relatively advanced (and relatively free) economies showing population in 1950 (in logs) and total percentage growth in real GDP per capita over the subsequent 65 years to 2015.

1950 popn and subseqeunt GDP pc

The simple regression line is still slightly downward sloping even if the very fastest growing countries (Singapore, Taiwan and South Korea) are excluded.  But note that I’m not arguing that higher populations are necessarily bad for subsequent growth, simply that there is little evidence (none in the simple bivariate relationships) that larger populations are good for growth.  Small and large countries seem able to successfully, and prosperously, co-exist.

What about more recent periods?  There has been a line of argument –  associated in the context of the New Zealand debate with Philip McCann –  that these issues have become much more important in recent decades as the nature of the global economy has changed (more reliance on ideas, trade in services etc).

Here is the same chart for the 25 years since 1990.

1990 population and real GDP pc

Take out the outlier (Singapore) and the bivariate regression line still slopes slightly downwards.

And for the same countries, here is the relationship between total hours worked in 1990 and subsequent growth in real GDP per hour worked.

1990 hours worked and subseqeunt productivity growth

And still no positive relationship.

My sample of countries in these charts excluded the countries of the former eastern bloc.  Most of them have relatively small populations, and most have –  not surprisingly –  done quite well in the last 25 years or so, once the shackles of communism were removed.   The quality of the data from 1990 might also be in some question.

But for completeness,  here are two charts from 1990 to 2015 with various of the eastern European countries added in (those now in the OECD and/or the EU).   This one for all the countries.

1990 hours etc - enlarged sample

And this one – as much for visibility as anything – just excluding Singapore, South Korea and Taiwan.

1990 hours etc - enlarged sample ex Sing, Taiwan, S Korea

There doesn’t seem to be any simple evidence that, across the relatively advanced world as a whole, a higher starting population has helped make for stronger subsequent growth in real GDP per capita or real labour productivity.

I concluded my earlier post this way

Charts of this sort are, of course, not conclusive. Lots of other things are going on in each country.  In an ideal world, one would want a much fuller and formal modelling of the determinants of growth. But equally, the absence of a positive relationship between the size of the country and its subsequent growth shouldn’t be surprising, and there have been previous formal research results suggesting a negative relationship.

Of course, perhaps New Zealand is an exception. Perhaps real per capita incomes would really be materially lifted if we had many more people here, even though there has been no such relationship across the wider range of advanced countries in history.  But in a sense we have been trying that strategy for 100 years and there is no sign that it has worked so far.   Very few relatively advanced countries have had weaker real per capita growth than New Zealand in the last 100 years (only places like Argentina and Rumania).

Perhaps the next 25 or 100 years would be different. But I think the onus is now on the advocates of policies to bring about a bigger and more populous New Zealand to demonstrate where and how the gains to New Zealanders from a much larger population are occurring?

At that stage, I was putting less emphasis than I now would on two (probably related) factors that make it even less likely that such a beneficial relationship would exist for New Zealand even if it did –  and these charts suggest it doesn’t –  for other advanced countries:

  • our extreme distance from other countries (markets, suppliers, value-chains, competitors etc) in an era when, if anything, personal contacts seem more important than ever, and
  • our continued very heavy reliance on natural resources –  and ability to apply new and better skills to those resources.   Those resources are in fixed supply, our heavy reliance on such natural resources is now quite unusual (it isn’t so for most OECD countries), and there is little sign of the economy successfully gravitating away to any significant extent from a reliance on natural resources.

Playing to our strengths, and maximising the prospects for New Zealanders, looks as if it would be much better-served by an approach that didn’t seem determined to drive up the population, regardless of the 100 years (or 70 or 25 or whatever period you like) in which there has been no evidence that a larger population is enhancing the economic well-being, or productivity, of New Zealanders.

And here is one last chart, for completeness, including all the relatively advanced countries –  eastern European and Asian alike –  and showing population in 1990, and subsequent growth in real GDP per capita.

1990 population and real GDP pc extended sample

Still no sign of that vaunted upward-sloping relationship.

What does the OECD really have to offer us?

The Organisation for Economic Cooperation and Development (OECD) is often loosely described as “the rich countries club”.  It isn’t an entirely accurate description –  there are several high income oil exporting countries who don’t belong (as well as places like Singapore and Taiwan), and some countries that are members (notably Mexico and Turkey) aren’t particularly high income.     But it is a grouping of mostly fairly advanced fairly open economies (New Zealand’s been a member since 1973).   And the organisation claims to be able to offer useful advice to countries as to how to improve their economic performance.  I’ve become increasingly sceptical of that proposition, especially as regards New Zealand.

On a biennial cycle the OECD’s Economic and Development Review Committee (EDRC) meets in Paris to review each member country’s overall economic performance, and offers some specific advice both on general economic management issues and on specific topics agreed in advance between the secretariat and the country concerned.  I wrote about the process, which draws on extensive staff work, on the day New Zealand was last reviewed in April 2015.

The next review is almost upon us.  The EDRC is scheduled to discuss New Zealand on 20 April, so the draft text is probably already in the hands of New Zealand government agencies.   The final text will presumably be released in late May or early June.  This year’s agreed special topics are “Increasing Productivity”, and “Labour Markets and Skills”.    The latter topic apparently includes the New Zealand immigration system, and when the OECD team came to Wellington last year I participated in a meeting with them, along with various government agency representatives, on some of the strengths and weaknesses of our system.   Historically, the OECD tends to be very strongly pro-immigration –  without much evidence for its benefits, especially in remote places like New Zealand –  and I expect their treatment this time will again reflect that presumption, probably with some suggested tweaks at the margins.   But, as often, the OECD might be able to present some cross-country data on the issues in interesting ways.

Quite what they’ll come up with to increase productivity could be more interesting.   In many ways, New Zealand is a test for whether the OECD has much useful to say.  For a member that was once among the richest and most productive OECD economies and now languishes a long way down the league table, New Zealand has been a bit of an embarrassment to the OECD.  After all, we did an awful lot of what they suggested 25 to 30 years ago.

I’m writing about the issue because a few days ago the OECD released one of their flagship cross-country publications, Going for GrowthThese documents often contain a lot of interesting cross-country comparative material –  data collection and presentation is one thing the OECD defintely does well.  But they also get specific, and have a couple of pages of economic policy priority recommendations for each country.  Since the OECD  must already have written their full substantive report on New Zealand for the forthcoming EDRC survey, one might have expected that the recommendations for New Zealand would be particularly incisive and well-focused, offering suggestions which, if adopted, would clearly help reverse our long-term underperformance.   As they note, labour productivity gaps between New Zealand and the other advanced economies have continued to widen over the last quarter century.   As the OECD’s own chart illustrates, real GDP per hour worked is now about 37 per cent below the average for the countries in the upper half of the OECD  (these are countries from Luxembourg and Norway at the top, to Italy and the UK at the bottom).

So what does the OECD propose for New Zealand?

  1. Reduce barriers to FDI and trade and to competition in network sectors.   Recommendations:  Ease FDI screening requirements, clarify criteria for meeting the net national benefit test and remove ministerial discretion in their application. Encourage more extensive use of advance rulings on imports and improve the publication and dissemination of trade information. Sell remaining government shareholdings in electricity generators and Air New Zealand. Remove legal exemptions from competition policy in international freight transport.
  2. Improve housing policies. Recommendations: Implement the Productivity Commission’s recommendations on improving urban planning, including: adopting different regulatory approaches for the natural and built environments; making clearer government’s priorities concerning land use regulation and infrastructure provision; making the planning system more responsive in providing key infrastructure; adopting a more restrained approach to land regulation; strengthening local and central government emphasis on rigorous analysis of policy options and planning proposals; implementing pricing to reduce urban road congestion; and diversifying urban infrastructure funding sources.
  3. Reduce educational underachievement among specific groups. Recommendations: Better target early childhood education on groups with low participation in such education. Improve standards, appraisal and accountability in the schooling system.To improve the school-to-work transition, enhance the quality of teaching, careers advice and pathways, especially for disadvantaged youth, and expand the Youth Guarantee. Facilitate participation of disadvantaged youth in training and apprenticeships. Students from Maori, Pasifika and lower socio-economic backgrounds have much less favourable education outcomes than others.
  4. Improve health sector efficiency and outcomes among specific groupsRecommendations: Increase District Health Boards’ incentives to enhance hospital efficiency, improve workforce utilisation, integrate primary and secondary care, and better managed chronic care. Continue to encourage the adoption of more healthy lifestyles.
  5. Raise effectiveness of R&D support. Recommendations: Further boost support for business R&D to help lift it to the longer term goal of 1% of GDP. Evaluate grant programmes. Co-ordinate immigration and education policies with business skills needs for innovation.

The general goals seem fine, in as far as they go.  And some of the specifics seem sensible enough too (others –  more R&D subsidies, government encouragement of “more healthy lifestyles”  –  seem distinctly questionable).    But could anyone with a reasonably in-depth understanding of the New Zealand economy and its performance over the last few decades, really think that that list, even if adopted in full, would really make a material difference in turning around New Zealand’s long-term productivity underperformance?   I’m all for fixing the housing policy disaster, but when the OECD talks of the agglomeration gains that might make possible, have they actually looked at the dismal Auckland productivity performance over a period when Auckland’s population has already grown very rapidly?

It is also quite surprising what they don’t mention.   Perhaps macro imbalances, such as our persistently high real exchange rate, or our (typically) highest real interest rates in the OECD, don’t easily fit in a structural policy document –  although they are significant symptoms that a list of possible structural policy remedies needs to notice.

But the OECD does publish as part of Going for Growth quite a range of cross-country comparative data on various structural policy indicators.  Even then there are puzzling omissions.  There is nothing at all, for example, on immigration policy.    And company tax is also missing.   Here is the data from the OECD website on statutory company tax rates for 2016.

company tax rates

New Zealand is in the upper third of OECD countries –  and with a company tax rate well above that group of countries (from the Czech Republic to Switzerland) at around 20 per cent.   I’m all in favour of reducing FDI barriers, for example, but for many firms who might consider establishing here, the likely tax bill is probaly a more significant consideration.  And I suspect it offers more payoff in improving productivity than the health system, whatever the merits of the specifics they propose there.

It was also interesting that the OECD does not mention our labour laws.    It is well-known that our minimum wage is quite high relative to median wages/labour costs. In fact, the OECD again illustrate it in their indicator pack. This is their chart, and I’ve simply highlighted New Zealand.

min wage OECD

It is a quite a stark picture, but doesn’t seem to be a priority issue for the OECD.  Actually, I doubt altering the minimum wage laws offers very much on the productivity front, but even if one is simply concerned about disadvantage (as they very much seem to be) we know that getting people into jobs is the best path towards longer-term economic security.   One needn’t go to the US end of this spectrum, but places like the Netherlands and Belgium aren’t exactly known as bastions of heartlessness, small government or whatever.

Overall, I think the list still suggests the OECD has very little idea what has gone wrong in New Zealand, and hence has little more than a generalised grab bag of ideas to offer in response –  many no doubt quite useful in their own way, but mostly likely to be tinkering at the margins.

Out of curiousity, I had a look at what they had to recommend for the previous country on the (alphabetical) list –  the Netherlands.  It is an interesting country too.  Productivity –  GDP per hour worked –  is above that for the group of countries in the upper half of the OECD.  Indeed for decades productivity levels in the Netherlands have been very similar to those in the United States.  Per capita income lags a bit behind, because Dutch people on average don’t work long hours each year (although the participation rate is high).    But it is, by most counts, a very successful economy.    Real GDP per hour worked is about 65 per cent higher than in New Zealand.

What does the OECD recommend for them?

  1. Lower marginal effective tax rates on labour income.
  2. Ease employment protection legislation for regular contracts and duality with the self-employed.
  3. Reform the unemployment benefit system and strengthen active labour market policies.
  4. Increase the scope of the unregulated part of the housing market
  5. Increase direct public support for R&D  [even New Zealand spends more on this than they do]

Setting aside the OECD’s taste for R&D subsidies, it mostly seems sensible, plausible, and well-targeted.  They  seem to have a better idea what to offer an already rich and successful country in the heart of Europe, than they have to offer a once-rich now-underperforming remote one.   For us, that is a real shame.

One can only hope that when the productivity chapter of the forthcoming New Zealand economic survey comes out, they can offer a more persuasive grounded set of recommendations as to what might make a real difference in reversing our decades of underperformance.

(For a more optimistic take on the OECD’s recommendations for New Zealand, see Donal Curtin’s assessment.)


Still no better than middling

The Minister of Finance greeted yesterday’s GDP numbers with the claim that

“While growth has softened in this latest quarter, the continuing trend is [with] consistent ongoing growth ahead of most other developed countries.

In the case of total GDP, that is no doubt true.  It is what happens when your country has had population growth of 2.1  per cent in the previous year.

But where do we sit in terms of growth in real GDP per capita?

The OECD doesn’t have data yet for all member countries, but here is how our GDP per capita growth compares, focusing on the December 2016 quarter over the December 2015 quarter, for the countries there are data for.

real GDP pc 12 mths to dec 16

And here is the same data for the full year to December 2016 over the full year to December 2015.

real gdp pc ann ave to Dec 16

Neither comparison is intrinsically better than the other.  Between them, really the best one can say is that New Zealand has been no better than the median country over the last year or so.  That’s nothing to write home about…….especially as our data suggest we’ve had negative productivity growth over the last year (whether one uses the point to point or annual average measure).   That means all our pretty modest per capita GDP growth over the last year has resulted from throwing more labour and more capital at the economy, and (less than) none at all by using resources smarter and better.

But according to the Minister

“This week’s statistics on economic growth and our external accounts show the benefit of the Government’s sensible, consistent economic management,” Mr Joyce says.

New Zealand Initiative on immigration: Part 7 Productivity and all that

Today I’m continuing on with the New Zealand Initiative’s chapter four, on the (claimed) economic benefits to New Zealanders of large scale non-citizen immigration. I don’t have the appetite to try to comment on every questionable claim in the report, so I start with a section headed “Agglomeration –  Bigger is Better?” in which (despite the question mark) the Initiative appears to position itself firmly behind not just the proposition that immigration is good for us, but also the proposition that a bigger population is good for us.

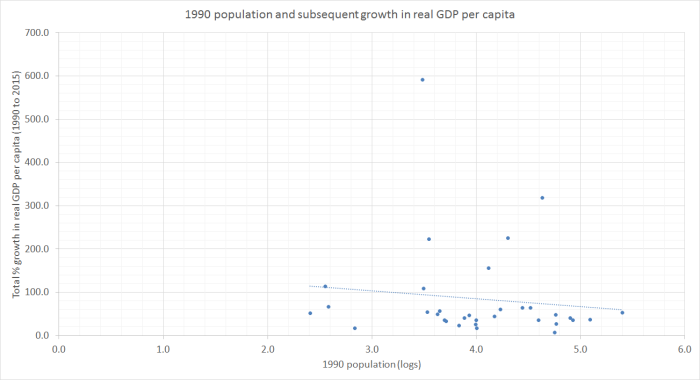
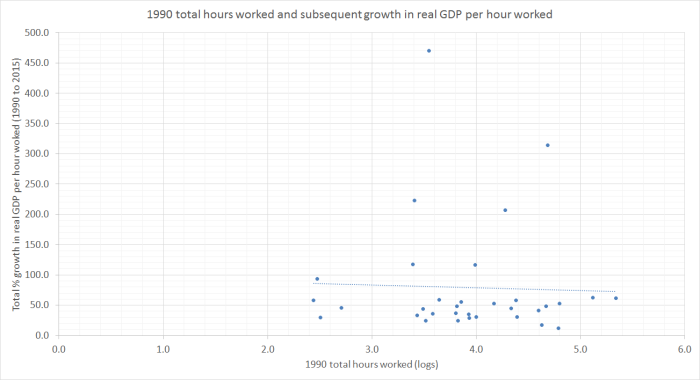
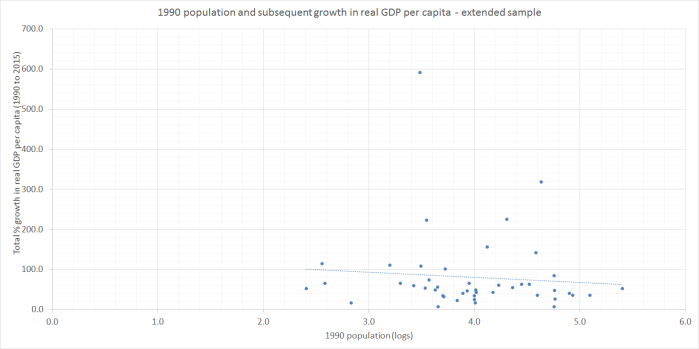
There is no good evidence I’m aware of for the latter proposition.  At a more informal level, I illustrated in this post that large countries (by population) haven’t grown faster (per capita income or productivity) than small countries.  And, of course, consistent with this impression, we have seen many more small countries emerge in the last few decades.

What there is little doubt about is that within countries people and economic activity tend to organise themselves in ways in which the higher productivity activities are increasingly more often found in larger cities.  Cities exist in substantial part because it was found economically advantageous for them to do so.  But it isn’t all that way, by any means.  Natural resource based production tends to occur where the natural resources are –  be it farming, oil and gas extraction, mining, or whatever.   And the observation that within countries an increasing share of high value economic activity is undertaken in cities, tells us little or nothing useful about comparative national economic performance, given the successful co-existence of highly productive large and small countries.

The Initiative seems keen to take the other view

Places, cities in particular, with large, dense populations face lower transport costs in goods, people and ideas. It is cheaper to supply capital or consumer goods and find good workers; there is a better network for knowledge exchange across people.  All vital components of economic growth. The existence of ‘agglomeration economies’ has been established in a number of studies. A meta-analysis of 34 studies found that the positive effects of spatial concentration on productivity remain even after controlling for reverse causality.  Another meta-analysis highlights the importance of considering the various mechanisms through which agglomeration can produce benefits.  New Zealand’s low economic productivity is partly explained by our small population, says Phillip McCann based on economic geography and urban economics.

But, as they acknowledge, I’ve pointed out what appears to be a pitfall in the argument in the New Zealand context, at least when it is used to back encouraging large numbers of new people into Auckland –  what I’ve termed, the 21st century Think Big strategy.

Reddell contends that Auckland’s failure to produce significantly higher growth
compared to the rest of the country contradicts this explanation.

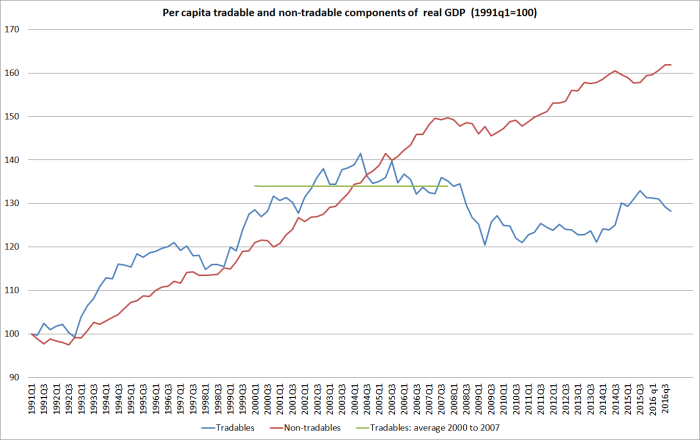
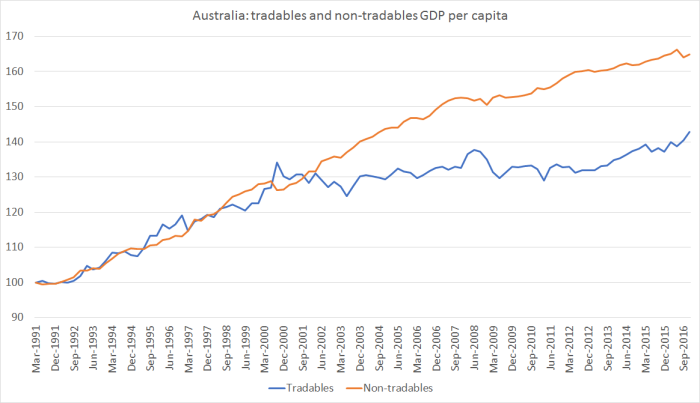
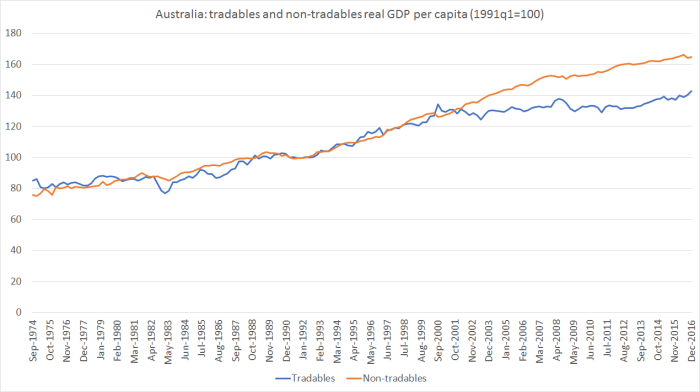
Recall that Auckland’s GDP per capita has been falling relative to that of the rest of the country for the last 15 years, and is quite low relative to that in the rest of the country when compared with other main cities in other advanced countries.  Not only hasn’t Auckland outperformed, it appears to have quite badly underperformed.  One could throw into the mix another point I’ve made previously: there is no major outward-oriented industry (exporting or import-competing) based in Auckland.  It has the feel of a disproportionately non-tradables economy, servicing (a) the rest of the country, and (b) the physical needs of its own policy-driven growth.

How does the Initiative respond to this point?

However, a recent report highlights how standard measures can understate urban productivity differentials and estimates that Auckland’s firms have labour productivity 13.5% higher than firms in other urban areas.

This is, frankly, rather naughty.  The Motu study in question produces revised estimates of labour productivity in Auckland relative to the rest of the country that are not dissimilar to the estimates of the ratio of nominal GDP per capita in Auckland relative to the rest of the country.  No one has questioned that GDP per capita in Auckland is higher than that, on average, in the rest of New Zealand.  But, by international standards, the margin is quite small.  And, more importantly for this debate, the margin has been shrinking, even though the theoretical literature the Initiative seeks to rely on suggests it should have been widening.  More people, from increasingly diverse places, generating more ideas, and as a result selling more stuff here and abroad, and investing to support those sales prospects.  But it just hasn’t been happening.  Instead, immigration policy has been putting more and more people in a place that doesn’t seem to have been producing the expected returns.  And we know that New Zealanders, who presumably are best-placed to assess opportunities and prospects here, have (net) been leaving Auckland.

Frankly I was a bit surprised the Initiative didn’t have a more effective response to these indicators of Auckland’s underperformance and the troubling questions they appear to raise about the economics of New Zealand’s immigration programme.

The next section in the chapter is headed “Macro impact and how we measure it”.  As they note

As a measure of living standards, GDP is not without its faults, but it does indicate how much a nation can produce and, ultimately, consume.  The effect of immigration on GDP can be difficult to disentangle. There is little contention GDP increases with more immigration – that countries produce more with more people is a no-brainer.
Of more interest to economists is GDP per capita – how much the pie is growing relative to the number of people taking slices.

I’d add that the impact on the GDP per capita of natives is, or should be, of particular interest when it comes to considering immigration policy.

There is a surprisingly limited empirical literature on this point.  There is a variety of papers which set up (calibrate) models for how the authors think the economy works, add an immigration shock, and then  –  surprise surprise –  find that the model produces much the answer one expects.    Papers in this class cover the range of results.  Some are set up in ways that produce gains to natives of recipient countries, through some of the sorts of channels Initiative authors cite.  But others, allowing for say fixed natural resources or sluggishly adjusting capital stocks, find that emigration tends to benefit the natives left behind, and slightly dampen the prospects of those in the recipient countries (the modelling the Australian and New Zealand Productivity Commissions used a few years ago in their review of the trans-Tasman relationship worked that way).  In the recent Australian Productivity Commission report on immigration, the modelling work assumed that productivity growth in Australia would be mildly adversely affected by continuing relatively large immigration inflows (there is a somewhat jaundiced, but not inaccurate, summary here).

But in terms of straightforward empirical analysis of effects on GDP per capita or productivity, there isn’t a large pool of relevant papers (and none at all focused on New Zealand, even though we’ve had one of the largest planned immigration programmes anywhere, over a long period of time).

The Initiative authors refers to two papers.   The first they summarise thus

A study of 22 OECD countries from 1987 to 2009 found migrants are not just attracted to countries with higher prosperity, they also help bring it about.

That sounds promising.    The actual results don’t quite match the promise.

The authors estimates four different version of their model. In each case, they show results for how GDP per capita respond to net migration, net migration responds to GDP per capita, and how the unemployment rate and net migration respond to each other.

Here is the impulse response function chart from the first version of the model

boubtane etc model 1

The solid line is the central estimate, and the dotted lines are the confidence bands.

There is a statistically significant response of GDP per capita to a change in the migration rate in the first year after the shock, but everything beyond that is (a) statistically insignificant, and (b) slightly negative –  ie below the zero line.   No one would be surprised by a positive effect in the first period, since in the short-term demand effects from unexpected immigration inflows will typically exceed the supply effects.  But over the medium-term, there is no evidence here of a sustained boost to per capita income.  The pictures from the other three versions of the model all look much the same.

Before moving on, I should briefly highlight two other points about this paper:

  • it uses net migration, whereas most of the theoretical arguments for possible gains from immigration relate to inflows of non-natives (new ideas, new skills etc).  For most countries, the difference isn’t that important, but for New Zealand it is very important.
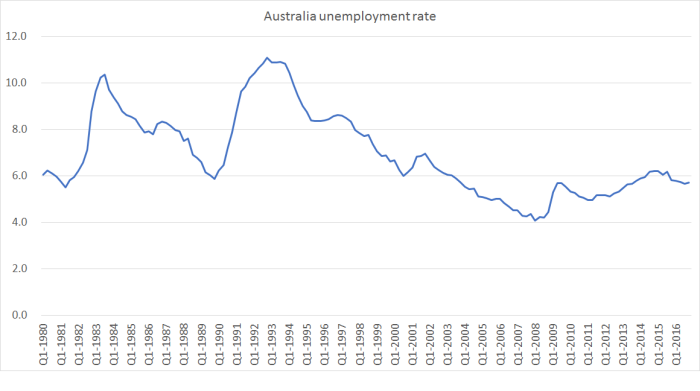
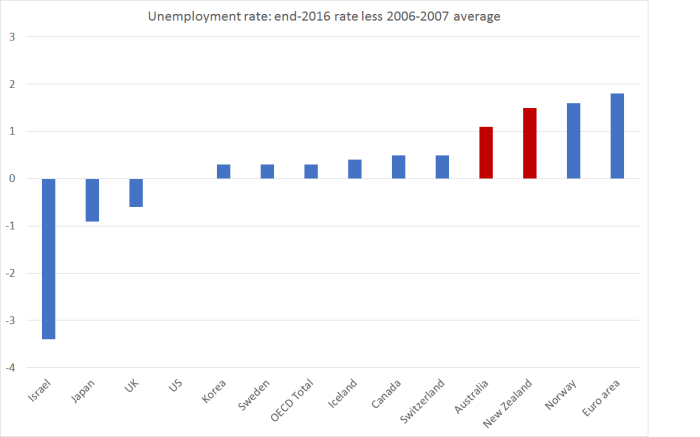
  • one of the key things the paper sets out to show is that immigration does not materially affect the unemployment rate.  This is a point that the Initiative and I are at one on, and  –  for what it is worth –  the results of the paper suggest, as we would expect, no statistically significant effect.

The Initiative then moves on to some recent empirical work (Number 8, October 2016) by several IMF staff researchers, which built on another recent paper, by Ortega and Peri, but focused only on advanced countries.

The study finds that a 1 percentage point increase in the share of migrants
in the adult population can raise GDP per capita by up to 2% in the longer run and that the benefits from immigration are broadly shared across the income distribution.

As it happens, I wrote about this paper , somewhat sceptically, when it was first released, in conjunction with the IMF’s World Economic Outlook, late last year.

Here is the summary version of why the results simply don’t ring true.

This chart is from the paper (here “migrants” is the foreign-born share of the adult population)
stock-of-migrants

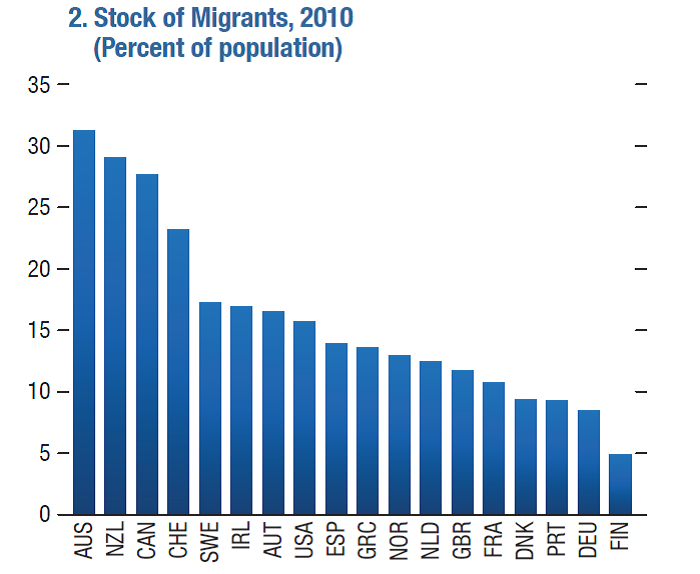
And this was my comment last year.

Think about France and Britain for a moment.  Both of them in 2010 had migrant populations of just over 10 per cent of the (over 25) population.  If this model was truly well-specified and catching something structural it seems to be saying that if 20 per cent of France’s population moved to Britain and 20 per cent of Britain’s population moved to France (which would give both countries migrant population shares similar to Australia’s), real GDP per capita in both countries would rise by around 40 per cent in the long term.  Denmark and Finland could close most of the GDP per capita gap to oil-rich Norway simply by making the same sort of swap.    It simply doesn’t ring true –  and these for hypothetical migrations involving populations that are more educated, and more attuned to market economies and their institutions, than the typical migrant to advanced countries.

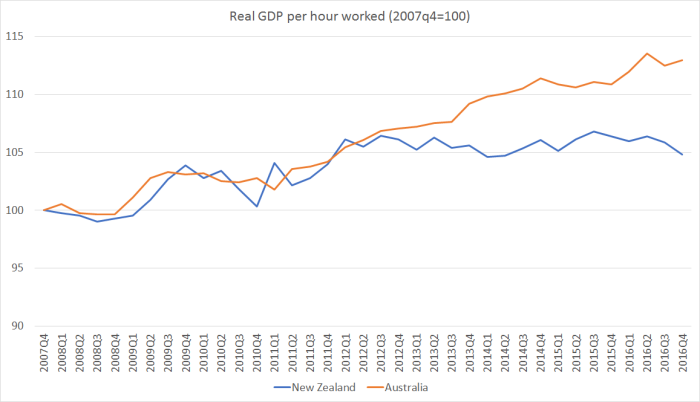
Or, we could turn it around, and think about New Zealand’s actual experience.  Let’s say that the foreign-born share of New Zealand’s adult population increased by 10 percentage points since 1990 –  I can’t quickly find the exact numbers, but it is likely to have been in that order of magnitude.  If this model is correctly specificied – and recall that New Zealand is included in its sample –  that should have given us a huge lift in productivity and GDP per capita, say by around 20 percentage points.  In fact, of course, despite having had probably the largest non-citizen immigration programme of any of these countries in that period (Israel, for example, isn’t in their sample), our productivity (GDP per hour worked –  the metric the IMF authors use) has slipped further behind that of other advanced countries.   Yes, perhaps there were lots of other particularly bad offsetting policies undermining New Zealand’s prospects –  but over this period international agencies, including both the IMF and OECD, repeatedly stated that they thought we had pretty good policies in place.

Of course, as I noted on Friday, my main interest is New Zealand.  If immigration to and among other countries has been productivity-positive, that is something to celebrate, but there is little evidence that it has been so for New Zealand.

One could take the critique and questions a bit broader.  For example, note how the gains arise in this study.  It is from having a large (increased) share of foreign-born people in one’s population.  But immigrants age, have children etc.  Without a continuing inflow of non-citizen migrants, any initial boost to the foreign-born share will erode quite steadily over time.

The US offers an interesting case study.  Around the time of World War One, about 15 per cent of the US population was foreign-born.  Immigration restrictions imposed in the 1920s, and in place for the following forty years, saw the foreign-born share of the US population fall to around 5 per cent by around 1970.  There was nothing comparable in other large migrant recipient countries (eg Australia, New Zealand, Canada).  All else equal, if the IMF model was correctly-specificied, this huge reduction in the foreign-born share should have resulted in a substantial deterioration in the absolute and relative producitivity position of the United States.  There is simply no evidence I’m aware of to support such a proposition (and, in fact, historical estimates suggest that the US had some of its strongest productivity growth in history during these decades).

In my earlier write-up of the IMF paper I noted that

There are other reasons to be skeptical of the results in this IMF paper.  Among them is  that there is a fairly strong relationship between the economic performance of countries today and the performance of those countries a long time ago.  GDP per capita in 1910 was a pretty good predictor of a country’s relative GDP per capita ranking in 2010, suggesting reason to doubt that the current migrant share of population can be a big part of explaining the current level of GDP per capita (and some of the bigger outliers over the last 100 years have been low immigration Korea and Japan and high immigration New Zealand).    In fact, I’ve pointed readers previously to robust papers suggesting that much about a country’s economic performance today can be explained by its relative performance 3000 year ago.  How plausible is it that so much of today’s differences in level of GDP per capita among advanced countries can be explained simply by the current migrant share of the population?

If this is the strongest empirical support advocates of New Zealand’s approach to immigration can adduce, those who have been inclined simply to go along should surely be rethinking their unquestioning support for the policy approach –  whatever merits it may or may not have for some other countries.  I’m aware of a tendency for New Zealand Initiative people to think that the onus of proof isn’t, or shouldn’t, be on them, so obvious and “morally right” is the case for immigration.  Quite where the burden of proof lies is probably more a political one than an economic one, but one might hope that the advocates could produce more evidence, or sustained analysis of the New Zealand case, than is evident in the New Zealand Initiative’s economics chapter.  Especially when the policy approach they support has been tried for more than 25 years, and when even they concede some puzzles about New Zealand’s economic performance in that time.

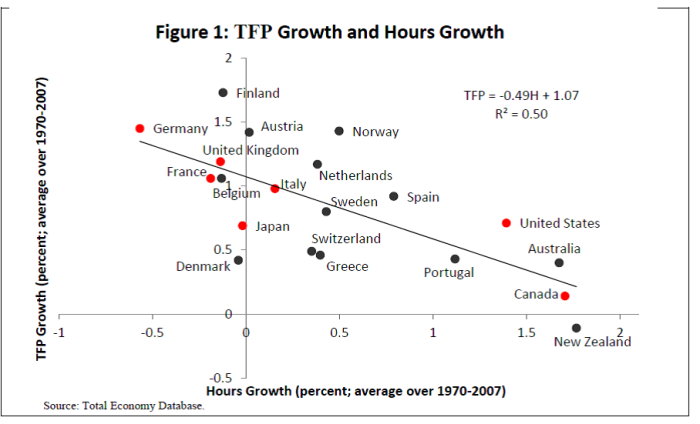
The authors of the IMF paper, and the earlier Ortega and Peri, paper, hypothesise that the gains from immigration come largely through a total factor productivity (TFP) channel.  Although they never explicitly say so, The Initiative seem to share this perspective, with all their talk of ideas, innovation, alternative perspectives etc.  The IMF researchers didn’t test the connection between immigration and TFP.     But in my earlier post I included this chart, using the same foreign-born population share data the IMF did.

imf-mfp

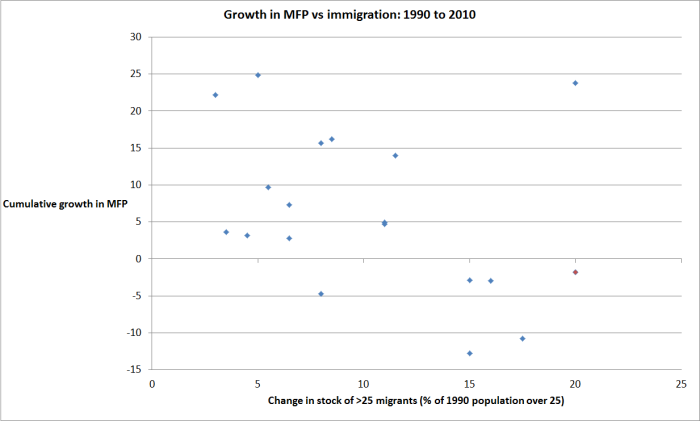
If anything, over the period they looked at, the relationship was negative –  a larger increase in the foreign-born population share was associated with weaker TFP/MFP growth.  New Zealand is the red dot in the chart.  The outlier –  in the top right hand corner –  was Ireland, which looks more positive for the IMF/Initiative story, except that as I also showed in that earlier post, it is quite clear that the surge of migrants into Ireland came several years after the surge in TFP growth.

And, on the topic of TFP growth, in a post last week I illustrated again just how weak New Zealand’s TFP growth has been relative to that in other advanced economies.    Surely, serious think-tank advocates of New Zealand’s large scale non-citizen immigration policy would want to engage with this sort of record, and the apparent inconsistency with the connections they have hypothesised?

Sadly, simply ignoring the actual record in New Zealand seems to be par for course in the economic chapter of the Initiative’s report.

To their credit, they devote a couple of pages of the report to my hypothesis around the contribution of immigration policy to New Zealand’s longer-term economic underperformance (pp 39 and 40 for anyone interested).  As they note, I have argued that

  • “given New Zealand’s continued heavy dependence on natural resource based exports, New Zealand might not be a natural place to locate many more people, while still generating really high incomes for them all”, and that
  • high levels of non-citizen immigration have helpd explain persistently high real interest and exchange rates, in turn deterring business investment, especially that in the tradables sector, and thus tending to undermine productivity growth.

But they don’t really know what to do with these ideas, and so end up largely ignoring them.  There is simply nothing more, in this section or in the rest of the report, on the issues around a natural resource based economy, that is very distant for major markets/suppliers/networks etc.   New Zealand may have many things in common with other advanced economies, but this is one probably very important difference.

And when it comes to New Zealand’s dismal long-term productivity record, the limit of their comment is this

New Zealand productivity has been less than stellar for a long time – a concern to many economists and policymakers.

And that’s it.  There is no attempt at all to engage with the data, or to tell some alternative story of economic management and prospects over the last 25 years or so, in which for example, non-citizen immigration has played a more favourable role.

There is a little bit more on real interest rates –  why they’ve been so persistently high relative to the rest of the world.

The hypothesis also cannot fully explain why the real interest rate has not converged to the rest of the world. Reddell says competing theories explaining the high real interest rate, such as a risk premium associated with New Zealand investment, do not fit with the evidence either, in particular with the persistent strength of the real exchange rate. He contends that the only explanation currently on offer is that the repeated shocks to domestic demand – not fully recognised in advance by market participants – must have been a big part of the story.

Clearly, the Initiative don’t find my story persuasive, but there is simply no attempt to explain why, or to pose a credible alternative hypothesis for one of the most striking features of New Zealand macro data in recent decades.

The best they seem able to come up with is to point out that any sustained demand pressures will tend to put upward pressure on real interest rates.  And that is quite correct of course.  An economy with very strong productivity growth, and the associated investment in support of it and consumption in anticipation of the future income gains, will tend to have high real interest rates (relative to those abroad).    And no one much will regard that as problematic –  rather it is a mark of the success of the economy.

But that hasn’t been the New Zealand story. Business investment has been quite low as a share of GDP (especially given our population growth) and productivity growth (labour or total factor) has been low.  There is little, or nothing, to suggest that the high relative interest rates we’ve experienced in New Zealand over the last 25 years have been a desirable market-led phenomenon.  They look anomalous not just relative to other countries, but also relative to our own underwhelming economic performance.

Here is the Initiative’s attempt to fend off my analysis

The concerns raised by Reddell would apply more broadly than just on immigration. For example, tourists are foreigners who come to New Zealand, purchase our currency and goods, and use infrastructure (they require accommodation, drive on the roads, may require police assistance, add waste to landfills. etc.). Hence, tourism also puts pressure on the real interest rate and real exchange rate.

As I’ve already noted, any persistent demand pressure –  whether from exports or the domestic economy – will, all else equal, tend to put upward pressure on local interest rates.

But except for population-driven pressures (in a country with a modest savings rate) we just haven’t had such pressures.  As I noted just before, business investment has been lower than we might have hoped, exports as a share of GDP have been sideways or backwards, and the consumption share of GDP has been flat for decades.  What hasn’t been flat has been the population, and particularly the foreign-born population, the direct consequence of government immigration policy.    Take their tourism example.  SNZ has data on the average daily stock of foreign travellers in New Zealand(boosting domestic demand) and the average stock of New Zealand travellers abroad (easing domestic demand), going back to 1999.     There are more foreign travellers here than New Zealanders abroad, on average, but the numbers aren’t large.  In 1999, there were on  the average day  16000 more foreign travellers here than New Zealanders abroad.  Last year, that number was 54000.    38000 (net) more travellers here is a helpful addition to net exports, and some pressure on demand.   But

  • the overall export share of GDP is less now than it was in 1999
  • from 1999 to 2016, there was a net inflow of 759000 non-citizen migrants to New Zealand.

That is both a very large number, and a direct government economic policy choice.  It has had consequences, and there seems a reasonable prima facie case, which the New Zealand Initiative has not attempted to seriously rebut, that that government-controlled influx has not been economically beneficial to New Zealanders as a whole.

This post has already got rather long, so just two final thoughts.

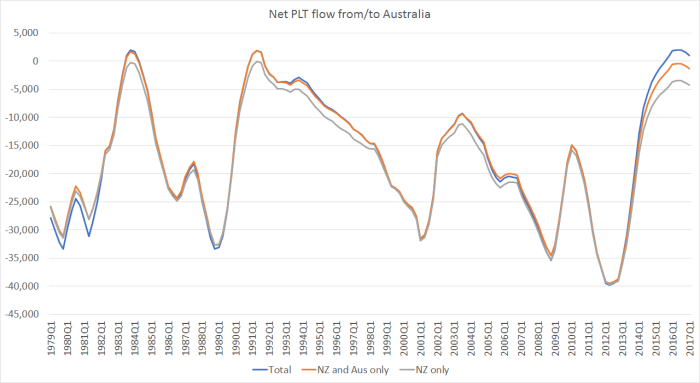
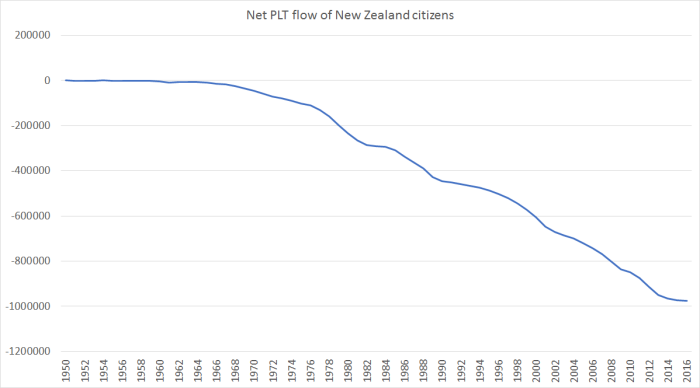
First, it is striking how little attention the Initiative gives to the large sustained outflow of New Zealanders over recent decades.  That outflow is certainly at a low ebb at the moment, but there seems little reason to assume that the exodus has come to any sort of permanent end –  as even the Initiative recognises, our productivity performance languishes.   Whatever one thinks of immigration policy in the abstract, surely it is a somewhat relevant consideration to look at what New Zealanders themselves are doing –  people best placed to assess opportunities and prospects here?   There is, among some policymakers, a weird approach to this issue, in which immigration policy is substantially about replacing those who leave.  I don’t think the Initiative subscribes to that silliness, but neither does it call it out.  When individuals are making rational choices to move – to leave New Zealand –  the burden of proof should really be on those who want the government to try to second-guess those judgements and choices.  When people left Ireland, Italy, Sweden or wherever for the US in the 19th century, it benefited those who left and those who stayed.  It would have daft for the authorities in those places to have responded “woe is me, we need to find some poorer people from other places to bring in to replace those who’ve left”.  A quite different approach would be to respect and respond to the market signals – movements of their own people –  and try to fix up their own economies in ways that might make it no longer attractive for  their own people to leave.  It would have been a much better lesson for the New Zealand authorities to take.  Residents of Taihape and Invercargill should be grateful governments didn’t/couldn’t respond to outflows of people from those towns by suggesting a presssing need to get other people from elsewhere in the world to move to Taihape and Invercargill, even though the economic opportunities had moved on from those places.

And second, in the IMF paper that the Initiative cite there are references to a new paper by various Harvard researchers on the economic effects of diversity (so recent that the references have been added since the version of the IMF piece that I commented on last year).  The authors note that typically in studies to date “the negative effects of diversity seem to dominate empirically”.  In this paper, they find more positive results, but they also look at what sort of diversity might produce benefits (p 26)

 we extend our index of birthplace diversity and account for cultural and economic distance between immigrants and natives. The productive effects of birthplace diversity appear to be largest for immigrants originating from richer countries and from countries at intermediate levels of cultural proximity.

and

This suggests that a combination of culturally closer immigrants and richer origins (potentially a proxy for higher skills) can be particularly valuable.

If this model is robust, then it is perhaps unfortunate for the economic case for the immigration programme that very little of New Zealand’s immigration is from countries richer than our own, and most of it isn’t from countries with close or intermediate levels of “cultural proximity”.  By contrast –  and uncomfortable as it is to point it out again –  all New Zealand’s immigration in the mid 19th century was from countries richer than us.  As such, there is little doubt that if lifted economic performance and productivity for all New Zealanders.    Whether the results are robust is something for others to look at, but it is the sort of specific results, that recognise that some immigration can be beneficial, but not all needs to be –  it depends on various things, including time, place, and people –  that the New Zealand Initiative should be engaging with rather than merrily asserting, with no New Zealand specific evidence –  that the gains to natives are there simply because people have come among us from another country, any country.
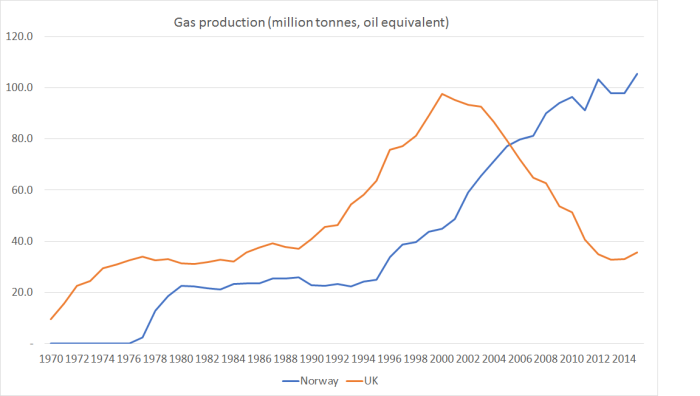
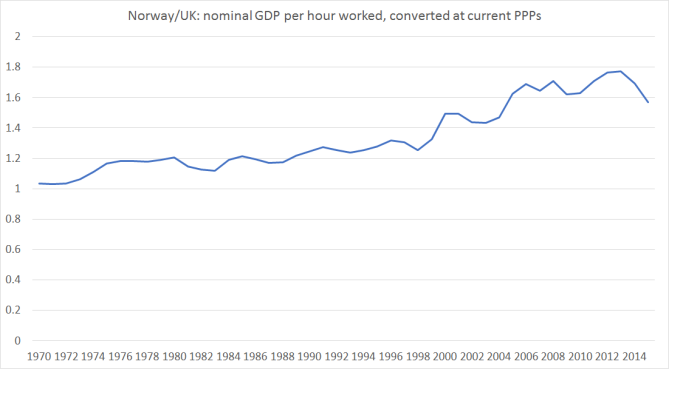
Total factor productivity growth: how have we been doing?

The Conference Board’s Total Economy Database is my favourite source for cross-country comparisons of productivity growth.  I’m not close enough to the respective methodologies to know whether and where to prefer their methodology to that of the OECD, but the Conference Board has data for a lot more countries, and typically  has estimates that go back a bit further in history.

Yesterday, I dug out their estimates of total factor productivity (TFP) growth.  They’ve recently revised their methodology, although for the time being that means they only currently go back 20 years.  I was curious to see how New Zealand had performed, on this metric, relative to other advanced countries.

Some readers will recall this IMF chart which I’ve run a few times previously.

imf-hours-and-mfp

It uses an earlier vintage of Conference Board estimates, and on that basis, New Zealand had had the lowest TFP growth of any of these OECD countries for the full period 1970 to 2007.

How about the more recent period, since 1994?   Here I’ve used a larger group of countries –  all the OECD countries, all the EU countries, plus Singapore, Hong Kong, and Taiwan –  very similar to the set of countries I used for a range of posts back in 2015 about New Zealand’s relative performance.

TFP growth 94 ot 15 TED
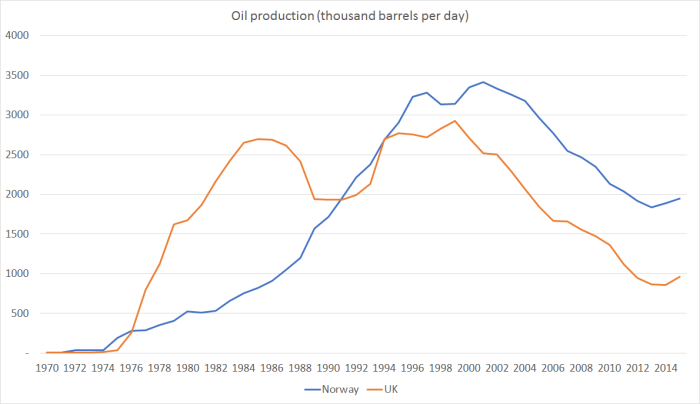
Over this period on this measure, we weren’t the worst, but we weren’t far off the worst.  A lot of the former eastern-bloc countries, now given the opportunity to catch-up with the West, are bunched towards the left of the chart.

And here are New Zealand and Australia shown relative to the median of these advanced countries.

TFP NZ and AUs
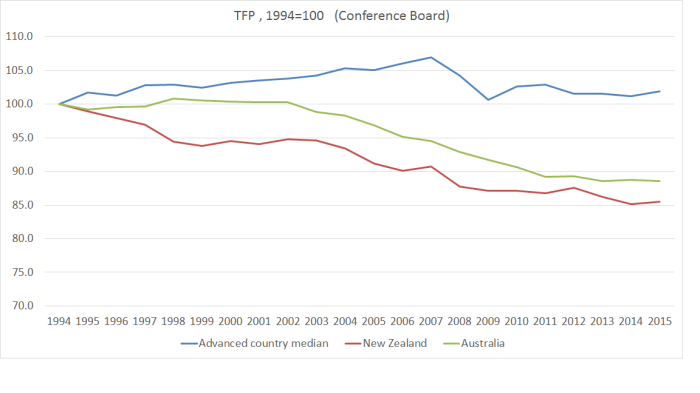
And New Zealand relative to the median of the G7 countries, and to the median of the former eastern-bloc countries. Recall, after all, that the narrative of economic reform in New Zealand had also been to allow us to catch up again with the richer advanced countries.

TFP NZ g7 east europeNot an altogether pretty picture.

Of course, observant readers have probably noticed that there doesn’t seem to have been much TFP growth anywhere for the last decade or so, and that while New Zealand doesn’t look to have done particularly well during that period, we also don’t look much worse than usual.  But here is how we have done relative to various other countries/sub-groups over that period.

TFP 05 to 15

Plenty of countries did worse than us, but among those that were quite similar to New Zealand and Australia over this period were Italy, Spain and Portugal (Greece was materially worse).

For these purposes, I’m mostly interested in how New Zealand has done relative to other countries.  There is a reasonable question as to how the level of TFP can have fallen so badly in 20 years (almost 15 per cent in New Zealand if one believes this measure).  TFP growth is a residual, after decomposing GDP growth into growth in the capital and labour stocks and –  done properly –  measuring both of those isn’t straightforward (eg it is one thing to measure total hours worked, another to get a good measure of the quality of the labour, or thus total human capital applied to production, especially in an era when tertiary education has become a lot more common).  Different methodologies will produce different estimates, but so long as similar methodologies are applied for all countries we can still use the datasets for cross-country comparative purposes

All of which is a lead in to a perhaps slightly less discouraging picture for New Zealand.  The OECD also produces TFP growth estimates, but for a much smaller range of countries  –  only 20 of their 34 member states, including none of the east European convergence economies.   And there aren’t yet estimates for all the countries for 2015.

But here is the comparison for 1994 to 2014 between New Zealand and this sample of the really advanced OECD countries.

TFP oecd oecd sampleThe gap between New Zealand’s cumulative TFP growth and that of the other advanced economies isn’t as large as that shown on the Conference Board data (second chart above).  Then again, since the OECD data doesn’t include the catching-up eastern Europeans that shouldn’t be a surprise.   But what is more striking is that until 2003 we were more or less matching the other OECD countries in this sample.

Here, for comparison, is the Conference Board data for New Zealand and the OECD’s sample of (20) countries.

TFP OECD TED sampleIn the end, perhaps the pictures aren’t really that dissimilar after all.  We’ve done badly relative to other traditional advanced countries and, if anything, on this measure too, the last decade or so is looking relatively worse.  In other words, if there was some convergence of growth rates, it looks to have been mostly only because TFP growth in the east European countries (in the TED sample but not in the OECD’s) slowed up so very markedly (as you can see in the third chart above).   That might be unfortunate for them –  and some combination of policy limitations, and substantial convergence already having occurred in some countries –  but doesn’t put New Zealand’s underperformance in any better light.

It is the sort of underperformance that should be leading to hard questions about the overall direction of economic policy in New Zealand.   After all, if TFP growth isn’t everything about economic performance and sustained prospects for prosperity, it is typically seen as quite a large part of the picture.  And we’ve just kept on doing badly.