Governments have purported to run New Zealand’s immigration programme primarily as an “economic lever”, intended to help lift the productivity and performance of the New Zealand economy, presumably with the aim of lifting not just average per capita incomes of those living in New Zealand, but of lifting the average incomes of New Zealanders. Public policy, especially in matters economic, should be made primarily with the interests of New Zealanders in view.
As I’ve noted previously, even among those gaining permanent residence approvals only around half (including the immediate family of the primary applicants) come under a skills heading, and in some cases they don’t seem overly highly skilled.
I highlighted a couple of weeks ago how relatively unskilled many, perhaps even most, of those coming to New Zealand on work visas are, even under a so-called Essential Skills category. That programme increasingly looks like another example of corporate welfare. But the standards are somewhat more demanding to gain a permanent residence approval. I used the work visa data because it was available at the right, disaggregated, level of detail. I haven’t been able to find anything comparable for permanent residence approvals (if any readers know of such data I’d happily be pointed to it).
But Statistics New Zealand does have data on Infoshare about the occupations of permanent and long-term arrivals. These data have their limitations including:
- They aren’t published by citizenship, and PLT arrivals include lots of returning New Zealanders, who of course aren’t subject to our immigration policy
- Intentions (about whether one is coming for the long-term or not) are self-reported, and subject to change.
- Occupations are self-reported (as distinct from the work visa data, where the approval is for a specific position).
Many arrivals don’t have an occupation either – they might be students, children, the aged, or non-employed spouses caring for children. Oh, and SNZ report that around 5 per cent of all stated occupations (on arrivals cards) are illegible, or otherwise unable to be fitted into ANZSCO occupational classifications.
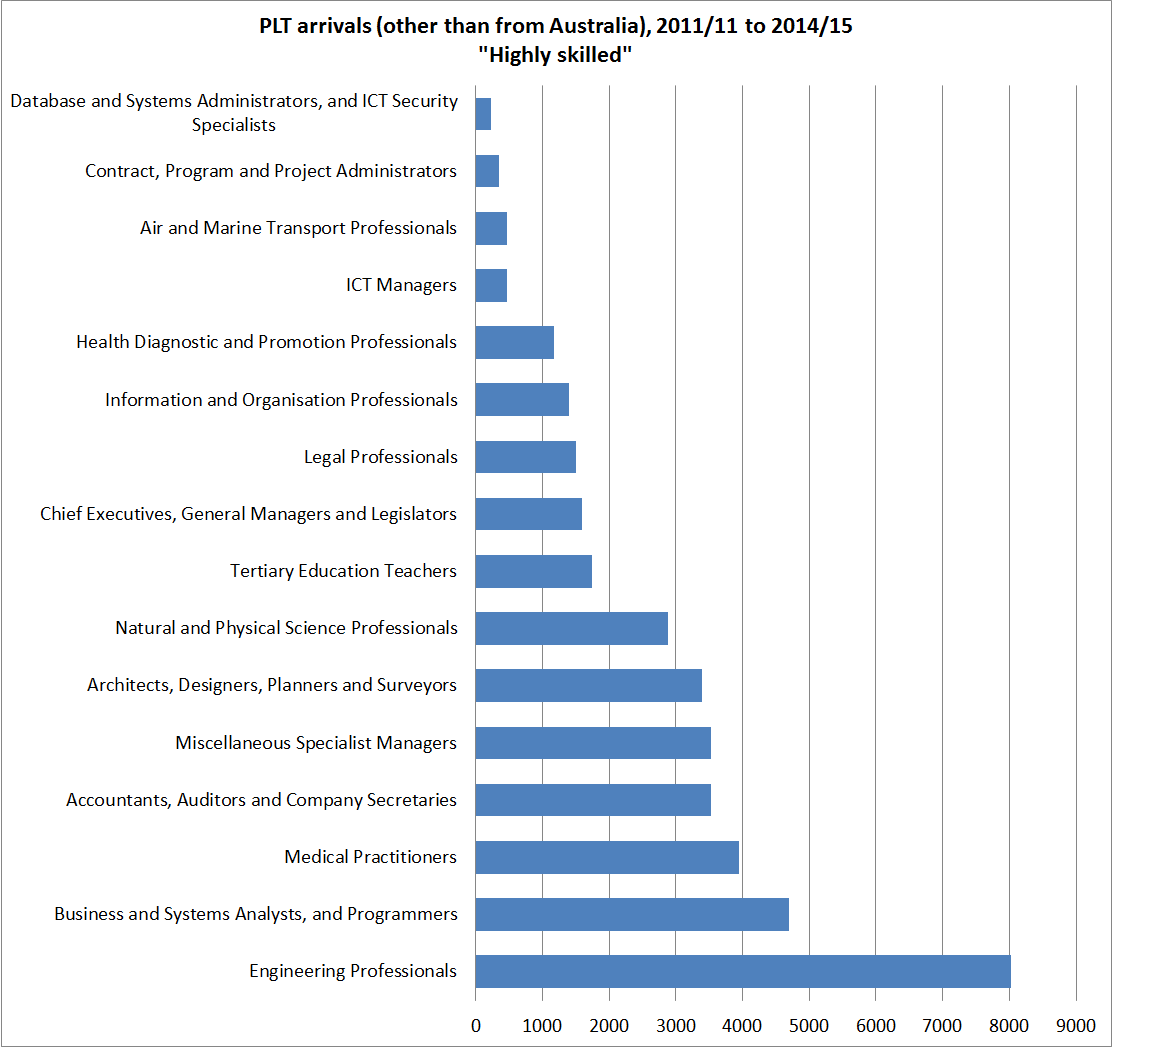
There isn’t anything that can be done about the second and third points, but most of the flow of New Zealanders is to and from Australia, and most of the flow between New Zealand and Australia is New Zealand citizens. So the charts below shows PLT arrivals, for the last five years, from places other than Australia, where the person arriving wrote down a clearly identifiable occupation. There were around 135000 of these people.
First, the positive story. This chart showed the occupations that looked like the sort of positions people (including me) have in mind when they hear that New Zealand has a skills-focused immigration programme, designed to lift overall economic performance over the medium-term. There were about 38000 arrivals in these occupational groupings. Jokes about, say, lawyers aside, I doubt anyone is going to quarrel much with people like these, if we are going to run a large scale immigration programme.
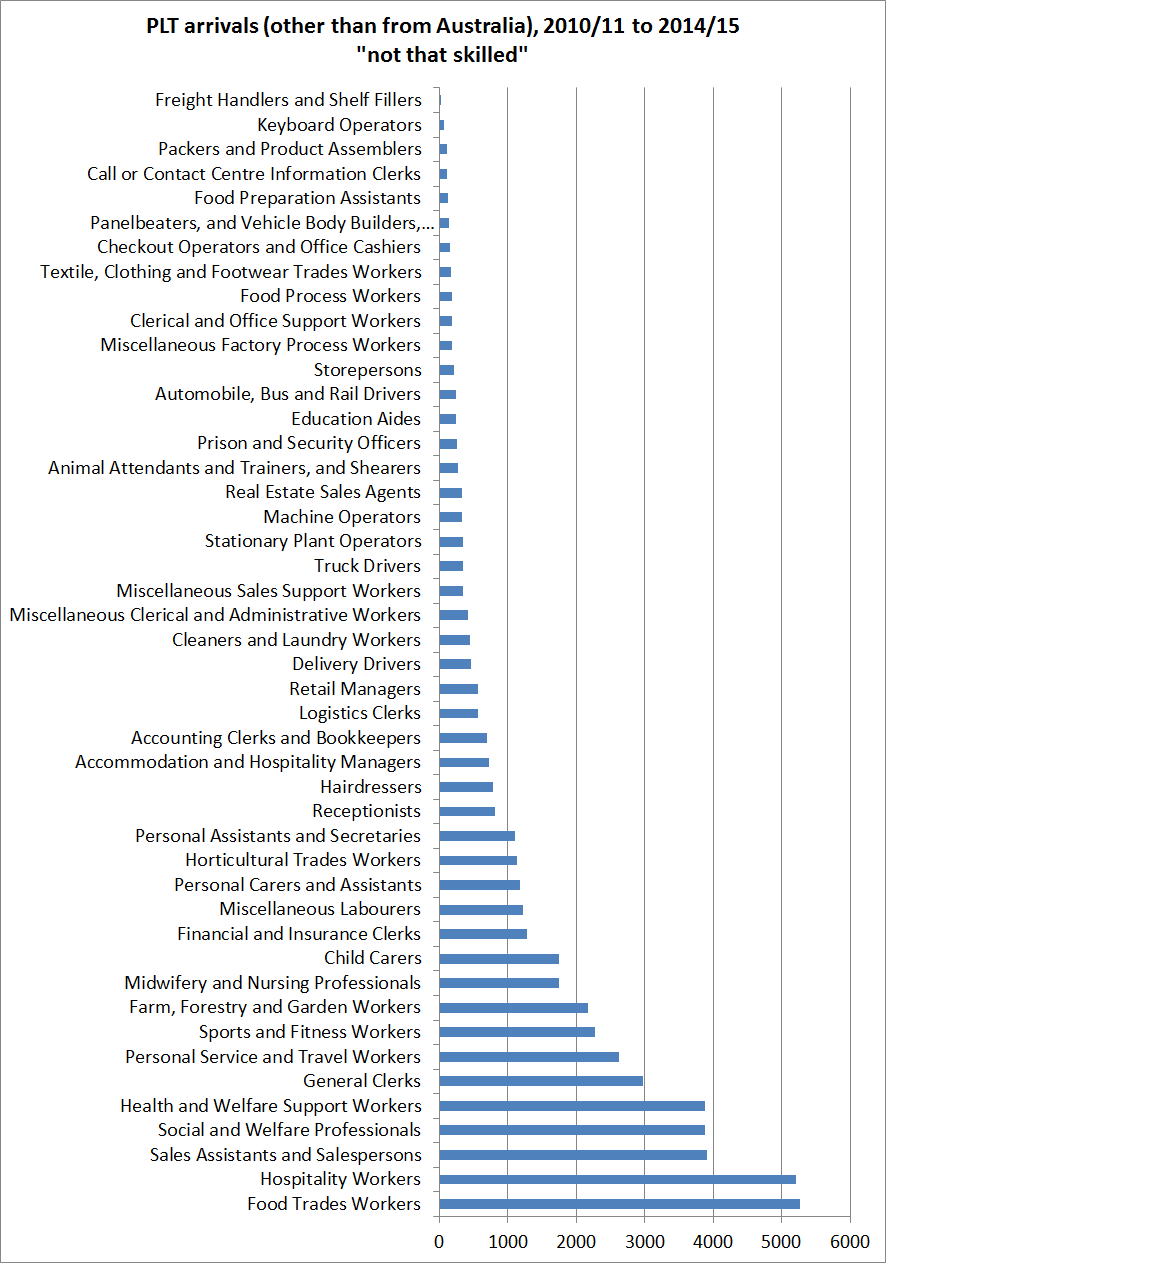
Second, the not-so-positive side. There were 51000 arrivals (38 per cent) in occupations that few people think of when they think of a skills-focused immigration programme. People will no doubt differ a little on what roles to put in this list, but as a whole it makes quite sobering reading. And remember that SNZ are only capturing here the people who actually report an occupation.
There is a middle group of occupations that I won’t show in detail. In deference to the Christchurch repair and rebuild process, I’ve put most building and construction-related positions in that category. But the largest single group in that middle category, somewhat to my surprise, was school teachers. No doubt there are many able immigrant school teachers, but again they aren’t usually the sort of grouping most people have in mind thinking about skills-based immigration programme (and I doubt many of them are teaching advanced high school science courses).
So most of our migrant arrivals aren’t actually here for their skills at all, even on the government’s rather generous interpretation of skills. And of those who are, a huge proportion look to be people, or occupations, that aren’t overly skilled at all. The Treasury papers I discussed a few weeks ago provided little or no basis (or reference to other material) showing how our skills-based immigration, as actually run, was boosting the productivity and future incomes of New Zealanders, despite the rhetoric of ministers and of the Secretary to the Treasury. I now have the papers MBIE has released, but have not yet had time to work through them. I’m hoping there is something more substantial there. At the moment, however, the large scale active immigration programme has the feel of something just focused on driving up New Zealand’s population, with little or no robust analysis or evidence to support a belief that New Zealanders are benefiting from the programme. If there are benefits to New Zealanders from the skills migrants are bringing, they are likely to be concentrated in the sort of occupations/skills captured in the first chart above. We could tap those gains with a much smaller permanent residence approvals programme – perhaps 10000 to 15000 per annum, rather than the current (very large by international standards) 45000 to 50000 per annum.

NZ citizens are also returning to NZ from the UK.
LikeLike
Yes, that’s true, and there will be some NZ citizen flow from other countries too, but taking out the arrivals from Aus excludes most of the NZ citizens. Ideally, MBIE would publish a detail occupational breakdown for permanent residence approvals. that should be easier to do now that most of those who get PR are already living in NZ (having come on student or work visas initially)
LikeLike
50,000+ Kiwis were moving to Australia annually from 2007-2013.
Over 1 million expat Kiwis live overseas. Expat Kiwis are now beginning to move back to New Zealand.
NZ can’t control or stop those 1 million expat Kiwis which most of them one day want to return back to New Zealand
NZ has a fast ageing population & declining birth rates. danger of ghost towns popping up in the regions due to declining populations. NZ is very much dependent on migration growth for population growth.
Asians in New Zealand now have a higher birth rate than Pakeha.
LikeLike
Agreed, Winston Peters is persistently concerned about new migrant parents on Universal Super, around 22,000 plus who have come in under the immediate family category. He should be more concerned about the 1 million expat kiwis that have not worked in NZ and paid no NZ taxes that would be entitled to Universal Super.
LikeLike
I wouldn’t be too concerned about returning New Zealanders since the vast majority will have come from Australia and the UK where accumulated state pension entitlements will be offset against NZ Superannuation.
LikeLike
not necessarily in the Australian case, since the Aus age pension is means-tested and ours is not (and people can take their accumulated compulsory private savings early and spend that.
LikeLike
Yes, I entirely agree that NZ is now dependent on immigration for population growth, but why is population growth desirable? Many other advanced countries now have flat or falling populations and seem to be doing just fine. There is no empirical connection between, say, the size of a country’s population and its subsequent GDP per capita growth.
LikeLike
Someone has to pay taxes to look after the old and aged.
LikeLike
Yes, quite the opposite in NZ’s case. The net benefit to NZ per capita output is likely to be negative. The numbers provided in the article helps to confirm this. We could achieve a positive net benefit,with less migrants, by focussing more on the quality of successful applicants.
LikeLike
PLT also includes tourists and international students who hold a visa for more than 12 months. Your analysis is more than likely badly skewed when both of these have year on year record increases.
LikeLike