Tradables sectors in New Zealand and Australia

I have to spend the morning on the gruesome business of trying to make progress in unpicking 20 years of mismanagement of the Reserve Bank pension fund, dating back in some cases almost 30 years.  So this morning’s post will be short.

First, the latest update of my quarterly chart of real per capita tradables and non-tradables GDP.  Regular readers will recall that this is a rather rough proxy –  first developed by the IMF when they were highlighting New Zealand imbalances more than a decade ago.   For these purposes, the tradables sector is the primary and manufacturing components of production GDP, plus the exports of services from expenditure GDP.   The rest of GDP is treated as non-tradables.  Both series are indexed to 100 in the first quarter of 1991, which is when the official quarterly population series begins.

T and NT components NZ to Dec qtr 16

It isn’t a pretty picture.  There has been no growth in real per capita tradables sector GDP (on this proxy) for 17 years.   The peak in the series was in 2004, and if anything it has been trending down since then.  A year or two ago, it looked as though some sort of rebound was underway –  all those tourists and foreign students –  but even some of that growth has been reversed in the last few quarters.  Successful economies –  ones that catch up with the leaders, which record strong productivity growth –  tend to be those with relatively fast-growing exports, and strongly-performing tradables sectors.   A reasonable interpretation of what has gone on is that whatever factors led to the exchange rate being so persistently high –  since around 2003/04 –  will have accounted for the weak tradables sector performance.

Once upon a time, while I was at Treasury, we had someone do similar charts for a wide range of OECD countries.  I’ve only done one for Australia.  Here is what it looks like –  same definition,  based to the same date as the New Zealand one, and on the same scale.

Aus T and NT to Dec 16

Australia didn’t see much growth in real per capita tradables sector output over the 2000s.   In a way, that wasn’t surprising.  They had a huge terms of trade boom, which gave them more income to spend, without needing to produce any more tradables to sell abroad.  And they also had a massive business investment boom –  increasing future production capacity in the minerals sector –  which will have squeezed out tradables sector production during the investment phase.   But over the last five years, growth in real per capita tradables GDP has resumed again – even growing a bit faster than the non-tradables sector.   Perhaps (but only perhaps) there is some connection with the divergent labour productivity performance in the two economies in recent years.

real gdp phw dec 16 release

And for anyone wondering if the performance in the 1990s, when tradables and non-tradables production more or less kept pace, was unusual, in Australia (but not in New Zealand) there is the data to do the tradables/non-tradables GDP chart all the way back to the mid 1970s.  Here it is.

aus t and nt to 74

The sort of pattern we’ve seen –  17 years of no per capita growth in the tradables sector –  doesn’t look like the sort of feature one expects in a successful economy, poised to catch up with the rest of world, reversing decades of relative decline.  Sadly, of course, New Zealand hasn’t been such an economy.  On current policies, there is little reason to expect anything very different in the foreseeable future.

Housing, governments, and public opinion

There have been a couple of interesting polls that caught my eye lately on the government’s handling of specific issues.

The first was from Newshub on housing

newshub housing.jpg

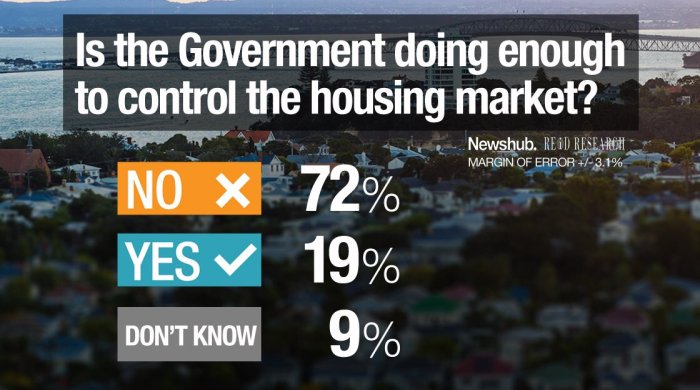
Taking the wording literally, the last thing I’d want is the government “controlling” the housing market.  They (this government and its predecessor) have done quite enough to mess it up as it is.    It looks as though real house prices nationwide will have risen by around 50 per cent in both the previous Labour-led government’s nine years in office, and in the current National-led government’s nine years in office –  a bit more in the earlier government’s term (which included a 10 per cent fall in nominal house prices in 2008) and a bit less in the current government’s term.

We simply didn’t have today’s problems before governments (central and local) took powers to “plan” –  something that seems to have worked about as well as Eastern European planning more generally did during the Communist decades.  But I don’t suppose the respondents were interpreting the question quite that literally.  It looks like an overwhelming expression of a sentiment that something (probably quite a lot) needs to be done.

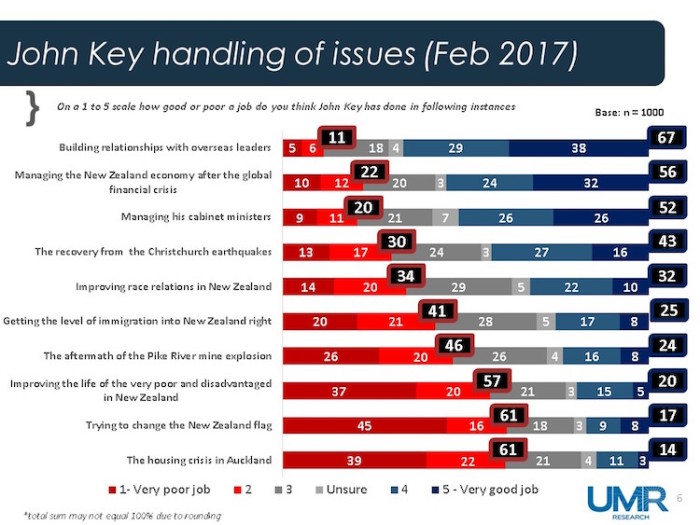
At the time of John Key’s early resignation from Parliament last month, there was some UMR polling reported on how well Key had handled various issues.   On most of the issues, we can probably treat it as a proxy for how the government had handled those issues.    This was the main graphic.

UMR john key

I found it a bit easier to read if I converted it into a chart of net balances –  the difference between of those saying “good” or “very good” and those saying “poor” or “very poor”.

Key UMR poll results
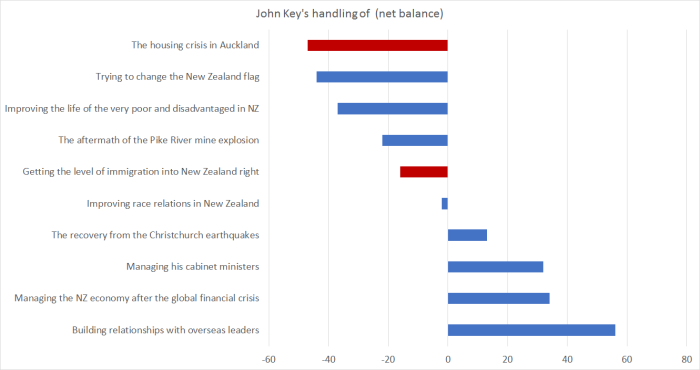
In some areas, Key rated very well, as one might expect (he did after all lead his party to three election victories).   Relationships with foreign leaders scored as highly as you might expect from someone who seemed generally to be regarded as “the sort of person you want to have a beer with”.       And if the government didn’t do anything much in the wake of the “global financial crisis”, arguably it didn’t have to –  after all it was mostly a North Atlantic crisis, and when the crisis ended there, so did the worst of the backwash in the rest of the world.   But if you are in office, you tend to get the credit.

Of the other answers, the only one that really surprised me was the quite negative Pike River score.  Perhaps more people than I appreciated really did think the mine should have been re-entered to try to retrieve the bodies?

But of course the two results that really caught my eye are the ones I’ve highlighted in red.  Respondents clearly didn’t think, on balance, that John Key had done well in “getting the level of immigration into New Zealand right”,   and were really really negative on how well the “housing crisis” in Auckland had been handled.  Perhaps the phrasing was a bit emotive, but when 61 per cent of people thought Key had done a bad job, and only 14 per cent thought he’d done a good job, the overall message is pretty clear.   The public just don’t buy the profoundly dishonest line that Key and his successor have run, that somehow unaffordable house prices (and some of the worst house price to income ratios anywhere in advanced world) are “quality problems“.  They are, quite simply, a scandal, and a sign of near-total failure (economic and moral) of policy in this area.  And this from a party that once prioritised home-ownership, and notions of a property-owning democracy.

Instead, we now have a governing party (notionally from the centre-right) that can’t or won’t do anything much about freeing up urban land supply, and can but won’t do anything much about cutting back the flow of non-citizen immigration that aggravates and amplifies the housing affordability problems.   It looks a lot like a deliberate attempt to skew wealth towards those who already have it, away from those who don’t.  I don’t suppose it is quite so deliberate, but the effect is the same.

I happened to have the 1975 National Party manifesto on my desk.  They had some really flaky stuff to say about housing –  a bit of that below –  but at least there was some realism on this specific point.

“The first way we will do this is by admitting honestly that we cannot create a better environment when people are pouring into the country faster than anybody can provide houses –  any kind of houses.  Thus immigration will be cut from the current rate of 30000 per year to around 5000.  This will give us the breathing space we so desperately need.”

National was in opposition then.  But it would be a good line for Opposition parties this year –  or for the government –  even if they all think they are really serious, this time, about sorting out the dysfunctional, over-regulated, urban land supply market.

As I said, that 1975 National manifesto had some astonishing stuff on housing.  I suspect it wasn’t unique to them.  The Values Party –  sometimes regarded as the world’s first environmental party –  did rather well in the 1975 election, getting 5 per cent of the vote in an FPP election.   And I doubt the Labour Party’s stance then would have been that much different.  But here is what the National Party –  just about to score a huge landslide victory –  was promising:

National has developed a complete plan for “the cities”.  And in doing so has become the first political party in New Zealand to include a serious urban development programme in its election policy.

…..

First, we will make moves to limit urban sprawl.  Second, we will set out to save the beauty that already exists.  And third, we will ensure that all new buildings contribute to an improved environment, at all times remembering that cities are people and that the social factors are all-important.

When a city sprawls, it destroys productive farmland and inevitably this also leads to decay in the inner city.  But sprawl can be stopped.  It has been done overseas and we will do it here.  We will change the Town and Country Planning Act to provide legal powers to literally “fence off” the cities.

….

….the government will encourage and finance new and better forms of high density housing.  This will not mean high rise apartments. We will build not just houses, but whole new communities. Ones in which people will want to live.

And so we have metropolitan urban limits, rural/urban boundaries, and all the associated restrictions that have given a land-abundant country some of the more expensive suburban and urban-periphery land around.  It was bad policy then, as it is now, but for the 15 years or so after those words were written New Zealanders were protected from the worst of it because population growth was very sluggish –  between the exodus of New Zealanders to Australia, and the reduced inflow of non-citizen immigrants.

What worries me now is that both main parties seem to believe, in principle at least, in freeing up urban land supply.  But it remains a great deal easier to pledge allegiance to that principle, than to do something serious about it.  Eight and half years into this government and very little has been done, even though the rhetoric has been roughly right since before they came to office.  Perhaps a Labour-Greens government really will be different, but if one is to take that prospect seriously perhaps it would be a good to see some agreed “Housing affordabilty and land use rules”, to match the recent welcome budget responsibility rules.      Not much has been heard from the Greens on this since their co-leader last year courageously advocated a substantial fall in house prices.     And the Greens historically have had a lot of sympathy with lines like those in that National Party 1975 manifesto.

I’m all for liberalising the urban land market.  But there needs to be a lot more realism about the prospects of substantial change.  I don’t favour cutting our immigration targets mainly for house price reasons –  in principle at least, that problem could be better dealt with in other ways –  but given the scale of the housing problem, the clear public discontent over housing unaffordability, and the much greater ability for governments to adjust immigration targets than to put in place new planning laws, it simply seems reckless –  and frankly ideological –  not to wind back quite substantially our target rate of non-citizen immigration.    For the Greens, who put a lot of emphasis on the physical environment, and for Labour –  historically the party of the working class New Zealanders –  it should really be a natural policy call.   I’m not sure why it seems not to have been so far.    Perhaps it is just fear of being tarred as somehow like Trump or Le Pen or whoever, even though our rate of legal immigration is typically far higher than those in almost any OECD country (a bit ahead of even Canada).    But even if your own natural biases are somehow pro-immigration, surely it is now past time to take a hard look at the New Zealand experience:  New Zealanders’ incomes haven’t been boosted by large-scale immigration, and housing for their children is rendered ever-more unaffordable by the toxic mix of planning restrictions and rapid population growth.  It is well past time to be cutting the immigration targets quite severely.

Of course, not everyone agrees.  I notice that the New Zealand Initiative has a new report out, Manifesto 2017 , outlining in very upbeat style their recommendations for what the next government should do.  It is 80 pages long, and I might offer some thoughts when I’ve read it, but I did do a quick search of the document for references to immigration policy, especially in light of the very recent Initiative report on that topic (which I reviewed in a series of posts).  There wasn’t much, but I did find this

Our report The New New Zealanders argues few countries have as successful
migration and integration policies as New Zealand.  It is yet another aspect of New Zealand to be proud of and celebrate.

If only it weren’t for those pesky unaffordable house prices, and levels of productivity that languish far behind those of other advanced economies.  It would good, just once, to see the evidence of the “success” –  for New Zealanders –  of our immigration policy.

In passing, this weekend has brought up the second anniversary of my move to become a stay-at-home parent, and thus the effective second anniversary of this blog.      I’ve been thankful for all the readers and the various comments/challenges various of you pose at times.  A while ago my 13 year old son asked me how long I’d keep going with the blog.  I responded that it might be two years or it might be 30 years, depending on whether I still had things to say, still had readers, and whether doing the blog came at an opportunity cost, to other things I might want to do, that outweighed the fun and stimulus I’ve had from continuing to do it.    There are rare days when I wonder if I still have much to say, that hasn’t been said 10 times already.  Then again, the other day I found a list on my desk dating back to 2015 of various topics I could usefully cover.  Many of them I still haven’t got to, and indeed I noticed this morning a book in a pile by my bed that I’ve been meaning to write about since I began.  So, for the time being at least, I’ll keep on as I have been.

Fiscal policy: in defence of the last Labour government

Bryce Wilkinson of the New Zealand Initiative was out yesterday with a comment, in the Initiative’s weekly newsletter, on the Labour/Greens proposal to establish a fiscal council.  I wrote about –  and welcomed – that proposal a week or so back.

Until I saw Bryce’s note, I had forgotten that the New Zealand Initiative had proposed the establishment of a fiscal council.   So add their names to the list of supporters:  the OECD (the technocratic wing of the European centre-left) favours a fiscal council, the Treasury’s independent reviewer of fiscal policy (a long-time senior IMF official) recommended a fiscal council, the New Zealand Initiative favoured a fiscal council, and even the (fairly right wing) 2025 Taskforce (of which Bryce was a member) favoured looking at something like a fiscal council.  And now our Labour Party and Green Party also do.   As many other OECD countries now have something of the sort, it all seems to amount to a reasonably strong case.

Of course, doing it well would be a challenge –  getting a succession of the right people would really matter.  But that is true of many of our public watch-dog and monitoring roles.

As Bryce notes, the current National-led government hasn’t adopted the recommendation.

Why not? Probably, it sees little need given its proven commitment to restoring fiscal surpluses. True virtue is its own witness. Establishing a superfluous agency to attest to its virtue would undermine it. To which our churlish response is that fiscal virtue is as ephemeral as the political winds and John Key’s promise to steer clear of New Zealand Superannuation was less than fiscally virtuous.

And he then asks

So why are Labour and the Greens on the virtuous side of this issue? After all, the last Labour government left National facing fiscal deficits for as far as the average geriatric eye could see.

That observation likely answers the question. Newly found virtue lacks credibility. Governments that can’t make credible commitments are weak governments. However, we hasten to add that this does not make it less of a virtue. A commitment to fiscal virtue is a fine thing.

I’ve already pointed out privately to Bryce that that seemed more than a little unfair to the previous government.   Let me explain why.

It is certainly true that when the current government took office in November 2008, official fiscal forecasts showed large deficits for many years into the future.  But the last fiscal initiatives of the outgoing Labour government had been the 2008 Budget, the parameters for which were set out in the Budget Policy Statement released at the end of 2007.

Throughout much of the previous Labour government’s term of office, a key theme of fiscal policy developments had been the surprising strength in revenue.  It was, in many respects, why the fiscal surpluses were so large during those years –   Treasury and the government kept being taken by surprise, and Treasury was (prudently) cautious about treating the surprises as permanent.  If it was just a series of one-offs, or something cyclical, it wouldn’t have made sense to increase spending or cut taxes in response.

The Treasury gradually revised upwards their assessment of the underlying fiscal position.  Unfortunately, they took a particularly optimistic stance by the end of 2007.  I can recall the then Prime Minister making much of the fact that Treasury was now assuming that most of the revenue gains would prove permanent (and thus could support some mix of increased spending and lower tax rates) without the risk of dropping back into deficits.  I joined Treasury on secondment in mid-2008 and I have seen documents written to the Minister of Finance during early 2008 stating that reassessment.  I was under the impression that some had been released, perhaps as part of the pro-active release of 2008 Budget papers, but on checking that link on the Treasury website, I couldn’t see the paper in question.

But the facts of the reassessment aren’t in dispute.  Several Treasury staff produced a paper last year on the process of getting back to surplus, including the background to the deficits.  Here is what they had to say

Over the period 2005-2008, the Treasury increased its estimates of structural revenues by around 1 percentage point of GDP each year, and by 2008 the Treasury considered most of the operating surplus was “structural”

and

When the tax reductions [along with further spending increases] were announced in Budget 2008, the Treasury was still predicting the operating balance to remain in surplus through the forecast period, albeit at a lower level.

With the benefit of hindsight, the degree to which the surpluses were structural was overestimated. Although the tax reductions announced in 2008 turned out to be well-timed from the perspective of stabilising the economy following the GFC, their permanent nature added to the subsequent structural deficits.

Here is the chart from the 2008 Budget Economic and Fiscal Update.

Figure 2.6 – Total Crown OBEGAL

Figure 2.6	- Total Crown OBEGAL.

Source: The Treasury

That document was signed off  by the Secretary to the Treasury as representing his best professional assessment of the economic and fiscal outlook, incorporating the effects of announced government policy.  In New Zealand –  unlike many countries – the forecasts are those of the professional advisers, not those of the Minister of Finance.

On the basis of the economic and fiscal information available to it, the Treasury has used its best professional judgement in supplying the Minister of Finance with this Economic and Fiscal Update. The Update incorporates the fiscal and economic implications both of Government decisions and circumstances as at 9 May 2008 that were communicated to me, and of other economic and fiscal information available to the Treasury in accordance with the provisions of the Public Finance Act 1989.

John Whitehead
Secretary to the Treasury

14 May 2008

The projected surpluses by the end of the forecast period were tiny –  essentially the budget was projected to be in balance by then.  The economic and revenue outlook had worsened over the first few months of 2008, after the broad parameters of the Budget had already been sketched out in the BPS.   As we now know, New Zealand was already in recession by May 2008.   But on best Treasury advice, the then Labour government thoiught they were leaving an essentially balanced budget, on top of an already very low debt level, not deficits.

Of course, the government was wrong in that assumption.  But, specifically, Treasury was wrong in its best professional advice.    Perhaps the government would have run quite expansionary discretionary fiscal policy anyway, even if Treasury had been less optimistic about how permanent the revenue was.  They were, after all, behind in the polls, and the PM’s office –  didn’t Grant Robertson work there? –  would no doubt have been putting a lot of pressure on the Minister of Finance.  But that hypothetical didn’t arise.    They didn’t have to make such awkward political choices –  their own professional advisers told them they could have tax cuts and spending increases, and still keep the budget in (modest) surplus.  The Opposition National Party shaped its, more generous, tax cutting promises on much the same sort of Treasury forecasts and estimates.  (And a few years earlier, the 2005 election had partly been a bidding war as to how best to spend the surplus –  not whether there really was a structural surplus).

It wasn’t Treasury at its finest.  It is, perhaps, a reason to be cautious about just how much a fiscal council might add.   Would such a body, faced with similar circumstances –  a long succession of revisions upwards in revenue –  have really reached materially different judgements about the outlook then?  Perhaps.  We can’t know, but back in 2008 Treasury was using its best professional judgement, and the mistakes were still made.

There is a bit of a tendency afoot to suggest that the current National-led government has done a better job of fiscal management than the previous Labour government did.  I’m not really convinced by that story.   I’d accept that the previous government might have had an easier job than the current government has –  since one inherited modest but growing surpluses, while the other inherited deficits.  The current government had some nasty shocks (earthquakes) but also some of the best terms of trade in decades and the weakest wage pressures.      But if we expect our politicians to be guided by professional advice in areas like this, the previous government did what most orthodox opinion advised them to, keeping on delivering surpluses and reducing outstanding debt.  Probably they should have emphasised tax cuts more than spending increases, but this particular debate is about overall fiscal balances.

By the end of Labour’s term, government spending as a share of GDP was rising a lot –  but then Treasury was telling the government the money was there to spend.  And for all the talk of how the new Labour/Greens rules commit a new left-wing government to keep spending at around current National government levels, that level is around the average level that prevailed under the previous Labour government.

core crown expenses

There are things I’d criticise about the previous government’s policy. Allowing big structural surpluses to build up, as happened in the first half of the term, set the scene for a big spend-up later (which would have been big tax cuts if National had won in 2005). It is probably better to recognise the limitations of knowledge and typically keep both surpluses and deficits small. But it is easier to say in hindsight than it might have been at the time.  And in 1999, the severe fiscal stresses of 1990/91 were pretty fresh in everyone’s memory.

Of course, this note has been a defence of the previous Labour government.  The Greens don’t have experience in government, and don’t have the same degree of historical credibility.    So in that sense, no doubt Bryce Wilkinson is right to argue that part of the motivation for the recently announced package is the desire to use commitments like this to help establish some credibility (even at the expense of burning off some of their own loyalists).

And I can only endorse Bryce’s final observation on the fiscal council proposal.

So three cheers to Labour and the Greens for this initiative. May they stick to it.

Do big countries get richer (or more productive) faster?

The short answer appears to be “no”.

Much of the debate around the appropriate immigration policy for New Zealand seems to have as a sub-text (implicitly or otherwise) a sense that New Zealand population is just too small, and that if only we had more people we would be richer (per capita) and more productive.     Those who run, or rely, on this line rarely seem to engage with the estimates that New Zealand’s GDP per capita was at its peak, relative to incomes in other countries, at a time (around 100 years ago) when our population was about a quarter of what it is now.  (Of course, the population of other countries has also grown since then, but in most advanced countries the population growth rate has been much slower than in New Zealand –  the UK had about 45m people 100 years ago and about 65m now.)

In their recent report in support of New Zealand’s immigration policy, the New Zealand Initiative joined the group of those arguing that a larger population would be good for New Zealand’s per capita income and productivity.

I wrote about this point in a post back in 2015, in which I observed

I’ve long been fairly sceptical of that proposition. A casual glance around the world suggests no very obvious relationship. The United States and Iceland co-exist, and Japan and Singapore. At the other ends of the income spectrum, India and Bhutan, and Brazil and Costa Rica. There are all sorts of arguments advanced around the economics of agglomeration, and that analysis seems to work quite well in describing what happens within countries. But it does much less well in describing economic performance across countries. And as I’ve pointed out to people previously, if the real economic opportunities in big countries were so much superior to those in small countries, large countries would tend to have (more high-yielding projects and) higher real interest rates than small countries. But they don’t.

Over recent decades we’ve also seen many more smaller countries emerging, presumably because the people in those places concluded they wouldn’t pay too much of a price to be independent.

In the earlier post, I included some scatter plots suggesting that there was basically no relationship at all between the size of country and the subsequent growth in its real GDP per capita or productivity (real GDP per hour worked).    In this post I’m looking at much the same relationships, but this time just using the Conference Board’s Total Economy Database, which starts in 1950.

One of the challenges in any work in this area is that people tend to flow to rich and successful countries.  Indeed, plausibly in a successful fast-growing country, people might even be willing have more children on average.   The simplest way to correct for that is to take the population level at some historical point in time and then look at per capita growth subsequently.   Here is a chart for 33 relatively advanced (and relatively free) economies showing population in 1950 (in logs) and total percentage growth in real GDP per capita over the subsequent 65 years to 2015.

1950 popn and subseqeunt GDP pc

The simple regression line is still slightly downward sloping even if the very fastest growing countries (Singapore, Taiwan and South Korea) are excluded.  But note that I’m not arguing that higher populations are necessarily bad for subsequent growth, simply that there is little evidence (none in the simple bivariate relationships) that larger populations are good for growth.  Small and large countries seem able to successfully, and prosperously, co-exist.

What about more recent periods?  There has been a line of argument –  associated in the context of the New Zealand debate with Philip McCann –  that these issues have become much more important in recent decades as the nature of the global economy has changed (more reliance on ideas, trade in services etc).

Here is the same chart for the 25 years since 1990.

1990 population and real GDP pc

Take out the outlier (Singapore) and the bivariate regression line still slopes slightly downwards.

And for the same countries, here is the relationship between total hours worked in 1990 and subsequent growth in real GDP per hour worked.

1990 hours worked and subseqeunt productivity growth

And still no positive relationship.

My sample of countries in these charts excluded the countries of the former eastern bloc.  Most of them have relatively small populations, and most have –  not surprisingly –  done quite well in the last 25 years or so, once the shackles of communism were removed.   The quality of the data from 1990 might also be in some question.

But for completeness,  here are two charts from 1990 to 2015 with various of the eastern European countries added in (those now in the OECD and/or the EU).   This one for all the countries.

1990 hours etc - enlarged sample

And this one – as much for visibility as anything – just excluding Singapore, South Korea and Taiwan.

1990 hours etc - enlarged sample ex Sing, Taiwan, S Korea

There doesn’t seem to be any simple evidence that, across the relatively advanced world as a whole, a higher starting population has helped make for stronger subsequent growth in real GDP per capita or real labour productivity.

I concluded my earlier post this way

Charts of this sort are, of course, not conclusive. Lots of other things are going on in each country.  In an ideal world, one would want a much fuller and formal modelling of the determinants of growth. But equally, the absence of a positive relationship between the size of the country and its subsequent growth shouldn’t be surprising, and there have been previous formal research results suggesting a negative relationship.

Of course, perhaps New Zealand is an exception. Perhaps real per capita incomes would really be materially lifted if we had many more people here, even though there has been no such relationship across the wider range of advanced countries in history.  But in a sense we have been trying that strategy for 100 years and there is no sign that it has worked so far.   Very few relatively advanced countries have had weaker real per capita growth than New Zealand in the last 100 years (only places like Argentina and Rumania).

Perhaps the next 25 or 100 years would be different. But I think the onus is now on the advocates of policies to bring about a bigger and more populous New Zealand to demonstrate where and how the gains to New Zealanders from a much larger population are occurring?

At that stage, I was putting less emphasis than I now would on two (probably related) factors that make it even less likely that such a beneficial relationship would exist for New Zealand even if it did –  and these charts suggest it doesn’t –  for other advanced countries:

  • our extreme distance from other countries (markets, suppliers, value-chains, competitors etc) in an era when, if anything, personal contacts seem more important than ever, and
  • our continued very heavy reliance on natural resources –  and ability to apply new and better skills to those resources.   Those resources are in fixed supply, our heavy reliance on such natural resources is now quite unusual (it isn’t so for most OECD countries), and there is little sign of the economy successfully gravitating away to any significant extent from a reliance on natural resources.

Playing to our strengths, and maximising the prospects for New Zealanders, looks as if it would be much better-served by an approach that didn’t seem determined to drive up the population, regardless of the 100 years (or 70 or 25 or whatever period you like) in which there has been no evidence that a larger population is enhancing the economic well-being, or productivity, of New Zealanders.

And here is one last chart, for completeness, including all the relatively advanced countries –  eastern European and Asian alike –  and showing population in 1990, and subsequent growth in real GDP per capita.

1990 population and real GDP pc extended sample

Still no sign of that vaunted upward-sloping relationship.

Comparing ACC investment returns to NZSF’s

I’ve written quite a bit over the last few weeks about the New Zealand Superannuation Fund.  My argument is not that they have done badly –  indeed, some evidence suggests that over a relatively short period (since their own self-assessment benchmark is a rolling 20 year horizon) they have done rather well – but rather that what they do isn’t worth doing at all (for citizens and taxpayers).   Total returns have been rather risky – interviewed on Radio New Zealand the chief executive called it a “high octane” fund – and don’t stack up that well against rate of return requirements the government generally expected over that period for discretionary investment projects, or with the sorts of hurdle rate private sector entities typically use in evaluating projects.

One reader has suggested several times that I show the data for the ACC investment performance.  The value of ACC’s total assets is currently quite similar to that of NZSF.

To give credit to NZSF, their investment performance data is much more easily available (on their website) than that of ACC.     But I did track down a couple of charts of ACC’s investment performance and ACC provided me with the annual data behind those charts, going back to the 1992/93 June year.

These are the headline numbers for the two government entities for the 12 full financial years in which both were operating.

acc and nzsf

What will no doubt stand out first is that ACC’s returns have been much less volatile –  less risky –  than those of NZSF.  They are very different funds, with very different mandates and different appetites for risk.

The numbers the two agencies supply are not exactly comparable.  The NZSF returns data are pre-tax and after costs.  ACC is not liable for New Zealand tax, although they note that they pay a small amount of foreign withholding taxes.  Their numbers are also reported before allowing for some investment management expenses.  This is from their Annual Report

However, returns are shown prior to the deduction of other investment management costs of $42.4 million (including fees paid to external fund managers and the remuneration of our investment staff), which would have detracted 0.135% from investment returns in 2015/2016.

In the remaining calculations in this post, I have silently deducted 0.135 per cent per annum from the ACC returns to produce numbers more closely comparable to those NZSF provides.

Over the 12 years both agencies were investing, NZSF produced (geometric) average annual returns of 9.5 per cent.    ACC managed 8.3 per cent average annual returns over the same period.  But the big difference was in the volatility of those returns.   For NZSF, the standard deviation of the annual returns was 13.9 per cent over that period, while for ACC it was only 4.8 per cent.   That is pretty low level of risk.  (I’m a trustee of the Reserve Bank’s superannuation scheme.  We have historically been a deliberately relatively low risk fund, and over the same period the standard deviation of our returns has been similar to ACC’s.)

You can see in the chart above where it really makes a difference.  Over 2008/09, at the height of the recession (here and abroad) and financial crisis, ACC had a bad year.  Returns in that June year were -1 per cent.   At NZSF, they lost 22 per cent of the value of the assets.   Fortunately that was still 22 per cent of not that much.

In an earlier post, I looked at the Sharpe ratios –  returns relative to the variance of those returns –  for NZSF.  It is a commonly used metric in looking at, andcomparing, funds managers.

NZSF’s official performance benchmark is the total returns of the fund relative to the (risk-free) Treasury bill rate.     ACC doesn’t use that metric, but lets see how the two organisations compare on it anyway, again over the 12 financial years 2004/05 to 2015/16.

Average return above T bill(percentage points) Std deviation(percentage points) Sharpe ratio
NZSF 5.7 14.6 0.39
ACC 5.2 5.8 0.90

And recall that NZSF’s own document suggest that over the long-term they don’t exepct anything like that level of returns: they aim to produce “at least” 2.7 percentage points above Treasury bill yields.

Both ACC and NZSF like to report on how they have done relative to benchmarks that they themselves have set (the “reference portfolio” in NZSF’s case).   That can be useful in assessing their active management returns and allowing the respective managements and Board to assess whether active management is worth doing at all.  It matters less to taxpayers, especially in the NZSF case, where there isn’t wealth that has to be managed, but rather we have to take a view on whether having the Fund –  funded from taxes and borrowing – is worthwhile at all (and where the benchmark is designed in a way that makes it not too hard for the NZSF to beat).   As I noted, the official performance benchmark for NZSF is performance relative to Treasury bill.   But for what it is worth, here is the same sort of table for what both organisations might call their ‘active management”.

Average annual active mgmt returns (percentage points) Std deviation (percentage points) Sharpe ratio
NZSF 1.8 3.2 0.56
ACC 0.9 0.8 1.13

ACC’s performance, even on this measure, is pretty impressive, both absolutely and relative to NZSF’s.   ACC has a longer-run of data, and the performance over the full 24 years of data is quite similar to that for the 12 years for which we can compare ACC and NZSF.

I’ve tried to ensure that all my numbers are accurate, although there is always some risk of error in combining differently formatted numbers etc.  But the key point really is in the headline numbers in the graph above.  Over the 12 years to date –  when NZSF has done better than they expected –  ACC has earned average total returns a bit less than those of NZSF, but they have done so by taking on much less risk.

And as I”ve highlighted in the various NZSF posts, NZSF’s sort of investment strategy tends to lead to very big losses at just the times when Crown finances are  put under greatest stress anyway (in severe economic and financial downturns).  That is a distinctly unappealing feature, and a risk profile more akin to that adopted by ACC over the years also looks as though it would be a better approach to take to any other Crown investment management subsidiaries.  Those with long memories will recall the intense fiscal pressures –  some real some exaggerated – in 1984, 1990/91, 1998/99, and 2008/09.  In future downturns, the last thing we need is huge investment losses amplifying pressures for politicians to “cut and cut now”.   It is fine for technocrats to argue that markets will bounceback.  Often they do, but it is a great deal of unnecssary risk for taxpayers to assume, or for them to rely on politicians and appointed technocrats to manage.

As a final note, I’ve been critical of the reshuffle of Kiwibank shares among various Crown agencies, which reduced NZ Post’s share, and resulted in NZSF and ACC owning around a quarter each of a retail bank.  In neither agency’s case does that look particularly good.  If things go well, both NZSF and ACC might do rather well financially –  after all, they were the only credible and politically acceptable buyers.  But neither ACC nor NZSF has any expertise in retail banking, and difficulties of handling any potential failure of Kiwibank –  and the inevitable pressures for government bailouts – are only compounded by the dispersed non-expert ownership all still on the overall balance sheet of the Crown.


Time to wind-up the NZ Superannuation Fund

In their print edition last Friday, NBR ran a piece from me suggesting that it was now time to wind-up the New Zealand Superannuation Fund.  For those with NBR subscriptions, it is now available on line.

I didn’t assign my copyright to NBR or anything of the sort, but I won’t reproduce the full column here.  It was, largely, a much shorter version of a post I did here a couple of weeks ago (and in the process of generating it, I proved to myself again that one reason I write long posts is that short posts take much longer).  But this was the final paragraph.

There is a political debate to be had about both NZSF and about the future parameters of New Zealand Superannuation.  But the two simply aren’t very logically connected.   What NZS policy we run in future depends on all manner of things, including the overall state of the government’s finances.  But the performance of one part of the balance sheet simply isn’t a key consideration.    If it makes sense for governments to run speculative investment management operations, it does so whether or not life expectancies are increasing.   But short of Norwegian quantities of oil and gas being discovered here –  which give the government cash that simply has to be invested –  it is just isn’t a business the government should be in.  Fortunately, the Fund hasn’t done badly over its life to date, but let’s bank the gains, and wind-back the considerable future risks by closing the Fund and using the proceeds to repay government debt.   

In both my recent posts on NZSF (here and here) , I’ve tried to emphasise that those who run it probably haven’t done a bad job in the time they’ve been managing our money.  (Here I should note that the NZSF have pointed out, via a response to someone else’s OIA, that in my first post I made a mistake in annualising the rates of return on the New Zealand stock exchange, a number I had mentioned in passing in that post.  NZSF and I agree –  on this if little else –  that the New Zealand stock returns are not a particularly meaningful benchmark for these purposes.)

NZSF has been charged by Parliament with running a high risk fund, they’ve done that, and over a period in which global asset markets have done rather well, they’ve made quite a bit of money for the taxpayer.  But if the relevant benchmark isn’t the NZSE50, neither it is (as NZSF and its chief executive keep claiming) the Reference Portfolio that the Fund Board themselves construct and adopt.  The latter has some uses inside the organisation, but it is largely irrelevant for taxpayers and citizens trying to decide whether NZSF has (a) done a good job, and (b) should exist at all.

In their own official documents, the relevant performance benchmark is

It is our expectation, given our long-term mandate and risk appetite, that we will return at least the Treasury Bill return + 2.7% p.a. over any 20-year moving average period.

That expectation is hardly ever mentioned when, for example, the chief executive takes to the media.  It didn’t appear in the OIA response I linked to earlier either.

As it happens, the returns to date have been (quite a bit) better than that benchmark –  which is why I’m quite open about the fact that NZSF has probably done a reasonable job, perhaps as good as most other managers with their opportunities might have done.   But after only 13 years, their own official documents tell us that we can’t yet know how much of those returns is down to luck, and how much down to skill.   As they note, when you take as much risk as they do –  really big year to year fluctuations –  it takes a long time to tell.   When global markets are rising strongly it isn’t hard to make money.

Over the life of the Fund, their total returns have averaged around 10 per cent per annum.  As I’ve noted previously, over most of that period the Treasury required government agencies looking at investment projects to use a discount rate of 8 per cent real (or around 10 per cent in nominal returns).  Of course, what discount rate one should use depends on how risky the proposed project is, and what it does to the risk profile of the whole of the owner’s business.  A “high octane” (Orr’s words) investment management subsidiary is risky –  it might not be Wellington aiport runway extension risky or INCIS risky, but it will be riskier than, say, a new school in a growing city.   And these sorts of investment management returns tend to add to, rather than reduce, the variance of the Crown’s overall financial position –  in particular, the biggest losses tend to become starkly apparent in periods when there is the greatest pressure on other government finances (ie in severe global economic and financial downturns).  A 10 per cent (pre-tax) return over the period from 2003 to now –  even though it is better than they expected –  just isn’t that impressive.  And NZSF tell us that even they believe those sorts of returns can’t be expected to be replicated in future –  they tell us we should expect 2.7 per cent above the Treasury bill rate.  Who knows what a “neutral” New Zealand Treasury bill rate is, but even if it is getting up to around 4 per cent, that suggests expected future pre-tax returns of less than 7 per cent.   And there is no reason to think that the variances, or covariances, of the portfolio will be less in future than they have been.    (In recognition of the lower interest rate environment, Treasury now encourages government agencies to use a real pre-tax discount of 6 per cent –  or 8 per cent in nominal terms.)

I could add into the mix the point that few private companies will be using hurdle rates of return of less than 10 per cent in deciding on investment projects, or the acquisition of a subsidiary.  And that is what NZSF is –  a fairly aggressive investment management subsidiary of the New Zealand government (with deteriorating governance/transparency –  eg when a large chunk of a government-owned local retail bank is in the portfolio).

And so my bottom line is that we should be thankful for the reasonable returns we’ve had from NZSF to now (through some mix of luck and skill), but that since we can’t count on anything like those sorts of returns in future (even NZSF say so), and even the returns to date are really only sufficient to compensate us for the risk run on our behalf, we’d be better off locking in the gains we’ve had, closing down the Fund,  liquidating the assets over a couple of years, and using the proceeds to repay public debt.    Our government does not need to be in this game –  unlike, say, the governments of Norway or Abu Dhabi, with genuine wealth to manage and smooth –  and the returns to doing so don’t look that attractive.   As the Crown is already heavily exposed (both through the tax system and its other extensive asset holdings) to the ups and downs of the domestic economy and global markets, strategies that reduce risk, rather than increase it, seem intuitively more appealing.  The NZSF logic is the opposite of that.

To accompany my NBR piece, they did an NBR Radio interview.  The one question that got me thinking –  and really the reason for this post, which to some extent is traversing old ground –  was along the lines of “wouldn’t winding up the NZSF leave ordinary people worried about whether their NZS pension would be there for them when they got old?”.

That the question slightly rattled me probably just reflected the fact that I’m a macroeconomist not a political scientist.    Perhaps it is also a testimony to Michael Cullen’s political skill in constructing the NZSF, initially to safeguard surpluses from spending ministers as anything else, and linking it to the NZS regime.      But why shouldn’t people worry?

  • NZSF is only a small part of the government’s overall balance sheet,
  • Our government finances are –  thanks to a succession of Labour and National led governments –  among the stronger in the advanced world,
  • Even the staunchest advocates of NZSF never saw it contributing more than a moderate proportion of future NZS costs,
  • We’ve had a universal government pension since around 1940 –  with brief interruptions in the means-testing years of the 1980s and 1990s – and a government old-age pension for those in need since 1898,
  • Our universal old-age pension is high enough to keep most old people out of poverty (even those who earned low enough incomes through their lifetimes that they’d have had little effective capacity to save), but doesn’t (of itself) deliver high incomes to people beyond basic needs (so it isn’t like some state schemes elsewhere in the OECD),
  • And there is nothing about NZS that is unaffordable in the long run, provided that sensible, well-foreshadowed, adjustments in the age of eligibility are made, in line with continuing improvements in life expectancy.  Ideally, we’d have the age at 67 already, and be increasing (by statutory formula) a little each year as the life expectancy rises.   Simply shifting the age to, say, 67 doesn’t resolve the issue, but a suitable resilient formula-based adjustment would.

In modern times, the greatest period of uncertainty –  by far –  about future state pension support was during the years from around 1985 to 1998 when a means-testing regime was instituted and then constantly revisited.  That had to do with some combination of the overall stretched state of the government’s finances, as well as essentially ideological debates about universality vs targeting.

If one believes –  as I, somewhat reluctantly (but for good second-best reasons) do –  in a modest but universal state age pension, the best protections of that over the long-term, and the best way to provide predictability to individuals (avoiding jerky discontinuous policy adjustments) are

(a) sound overall government finances (low debt levels, and tax and spending shares of GDP that don’t push historical or international limits), and

(b) agreed, or at least broadly accepted across the main parties, statutory provisions that lay down well in advance how the age of eligibility will adjust in future as life expectancy increases.

NZSF really isn’t relevant to either.    It is just a high-risk investment management business, and that isn’t a natural business of government.

And veering slightly further off topic, I’m still puzzled by that Labour-Green commitment I discussed yesterday to keep core Crown spending to around 30 per cent of GDP while doing nothing to alter NZS parameters.  This was the chart from the Treasury’s long-term fiscal statement released late last year.

ltfs
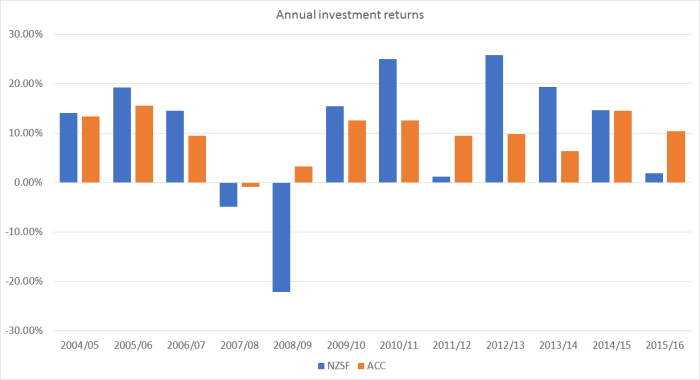
They would be okay for the next few years, but once you get even 10 years out from here, there would need to be a lot of other expenditure cut to keep spending to around 30 per cent of GDP, even if (a) the two parties resume NZSF contributions soon, and (b) investment returns proved to be pretty good.   I’m genuinely puzzled how they propose to square that circle.

Labour/Green Budget Responsibility Rules

Grant Robertson, for Labour, and James Shaw, for the Greens, released on Friday a short document on the “budget responsibility rules” the two parties would adopt if they are in a position to form a government after the election.

As others have noted, it was PR win for the two parties, in what was in any case not a great week for the government (Afghanistan and all that).    If one criticism of the left-wing parties in the 2014 election was that no one seemed sure what a Labour-Green government might look like, or how the key figures might get on, this is the sort of initiative that helps build confidence and makes people nearer the centre, or just tired of nine years of a government that has accomplished little, think harder about the possibility of voting for a change.   Whatever their other specific policies, whatever their other limitations, in this release –  and, for example, in the double-page spread in the Herald, – Shaw and Robertson looked and sounded like plausible responsible senior ministers.

On the substance, I think it is only fair to note that for 30 years or so there hasn’t been a huge difference between the two main parties on the overall approach to fiscal policy, and that has been to the credit of both parties.  Roger Douglas and David Caygill broke the back of our record of fiscal deficits, and Ruth Richardson and Bill Birch finished the job.  Both parties ran surpluses through much of the 1990s and the 00s.  The budget was run badly into deficit late last decade, through some combination of poor official forecasting, the global recession and productivity slowdown, and the earthquakes.  Policy played a part –  Labour in government was responsible for a large increase in spending (advised by Treasury that it was sustainable). But had National been in government in 2005-08 it is difficult to believe that fiscal bottom lines would have been much different.  They’d have been getting the same Treasury advice about revenue sustainability, although presumably they’d have done more about tax cuts than Labour did, and put through fewer spending increases.   Since then both main parties have had a shared commitment to get back to surpluses –  helped along by relatively favourable terms of trade, and unexpectedly strong population growth, which tends to flatter the fiscal position in the short-term.

Of course, the Greens have remained a bit of an unknown quantity in the broad area of economic management, not helped by for example the flaky suggestion from their former leader that New Zealand should have been adopting quantitative easing, at a time when there was still plenty of scope for conventional monetary policy.  But that now seems to be in the past, and in this new agreement the Greens have pretty much signed on for an orthodox and fairly sensible approach to broad fiscal management.  Perhaps they always were, but sometimes writing things down and stating them openly matters.

There are six points in the Budget Responsibility Rules document.  I’m mainly interested in the sixth of them –  the genuine and welcome innovation.    My comments on most of the others are mostly around the margins, intended as constructive technical points rather than any very substantial disagreement.

The first two points are

1. The Government will deliver a sustainable operating surplus across an economic cycle.

An OBEGAL surplus indicates the Government is financially disciplined and building resilience to withstand and adapt to unforeseen events. We expect to be in surplus every year unless there is a significant natural event or a major economic shock or crisis. Our surpluses will exist once our policy objectives have been met, and we will not artificially generate surpluses by underfunding key public services.

2. The Government will reduce the level of Net Core Crown Debt to 20% of GDP within five years of taking office.

To give future generations more options, reducing government debt has to be a priority. By setting a target, provided that economic conditions allow, we will be able to make responsible debt reductions and invest in housing and infrastructure that strengthen our country and prepare us for future challenges.

On which I would make just two points:

  • if nominal GDP is growing at, say, 4.5 per cent per annum (say, 2 per cent inflation, and 2.5 per cent through some mix of population and productivity growth) then a stable debt to GDP ratio of 20 per cent is consistent with annual deficits of 0.9 per cent of GDP.  I’m not opposed to the commitment to run surpluses in normal times –  presumably offset by deficits in years with serious economic downturns –  but since those severe downturns typically come less than once a decade, and a parliamentary term is only three years, they will need to do some hard thinking about how to operationalise these self-imposed rules jointly, as the 20 per cent target comes into view.   There is a real risk of seriously pro-cyclical fiscal policy quite late in economic cycles, compounded by the fact that the commitment to run surpluses is not expressed in terms of a structural balance (ie stripping out the estimated budgetary effects of the state of the economic cycle).
  • what is a sensible debt target with, say, zero population growth would, all else equal, be too low a target if population growth was to continue at 1.5 or 2 per cent per annum.   The Greens have announced a net immigration target which is consistent with population growth of on average around 1 per cent per annum.  We don’t yet know what Labour immigration policy is.      (I should add that this technical point is relevant to the current and past governments’ specification of debt targets as well –  such targets typically arose more out of political framing etc than out of robust economic analysis.)

The third of the rules is

The Government will prioritise investments to address the long-term financial and sustainability challenges facing New Zealand.

The Government will prioritise responsible investments that enhance the long term wellbeing of New Zealanders – such as restarting contributions to the Super Fund. In addition we will invest in infrastructure to support our growing population, and reduce the long term fiscal and economic risks of climate change.

I’m not going to get into debates about NZSF here (the bigger fiscal issue is how much overall public sector saving there should be, not the institutional form it takes), and presumably no one is going to quibble with the high level of generality in the italicised commitment.  All the arguments –  including those within any future government – will be about the details of specific policies, values, and preferences, and about how hardnosed project evaluation and cost-benefit analyses should be.

The fourth rule is interesting and somewhat surprising

4. The Government will take a prudent approach to ensure expenditure is phased, controlled, and directed to maximise its benefits. The Government will maintain its expenditure to within the recent historical range of spending to GDP ratio.

During the global financial crisis Core Crown spending rose to 34% of GDP. However, for the last 20 years, Core Crown spending has been around 30% of GDP and we will manage our expenditure carefully to continue this trend.

Here is the chart of core Crown spending as a share of GDP.

core crown expenses

The average over that full period has been 30.8 per cent of GDP.

I’m more hesitant about this “rule” or commitment than you might expect.   On paper it looks like a timely recognition of the cost to productivity and real future incomes of too large a state.  But when, thinking about fiscal rules, it is really important to think about (a) how they might be gamed in future, and (b) how they might lead even the authors of those rules into decisions that might less than ideal.  I’ve also not seen anyone ask Labour, in particular, how they square a semi-commitment to hold core Crown expenses to around 30 per cent of GDP with doing nothing about NZS.  Even the most enthusiastic supporters of the NZSF recognise that it will make only a modest contribution to covering those ageing population costs  –  and probably none at all in the life of any Labour-Green government elected this year.

But even setting that specific issue to one side, this is a commitment around core Crown expenditure, but there are other ways to skin a cat.  If a future government feels bound by an expenditure commitment, why not try regulation.  There doesn’t appear to be anything comparable limiting future extensions of the regulatory state (thus, say, in a US context a statutory mandate compelling people to buy health insurance might be a substitute for more direct government spending on health).  And it isn’t clear that this commitment by Labour and Greens would limit the use of tax expenditures.  And people closer to the details of how governmemt activity is classified might want to pay attention to the possibilities in the distinction between core and total Crown.  Finally, expenditure to GDP ratios can be flattered by the state of the cycle –  a ratio of 30.000 per cent late in a big boom, can quickly transform into one of 32 or 33 per cent without any new discretionary fiscal choices if there is a serious recession.

These comments are, mostly, not intended to take away from the welcome overall thrust of the Labour/Greens commitments, but they are some details to think about when it comes to firming up what the commitments might mean if/when they are in office.  Under pressure, ministers and smart bureaucrats find “outs”.  For now, one should welcome the fact that the parties believe it is politically advantageous to commit to something like an expenditure (share of GDP) ceiling.

I’ll pass over the tax commitment quickly

5. The Government will ensure a progressive taxation system that is fair, balanced, and promotes the long-term sustainability and productivity of the economy.

The Government will ensure a progressive taxation system that is fair, balanced, and promotes the long-term sustainability and productivity of the economy.

Since no one –  apart perhaps from one or two lump-sum taxers lurking under rocks somewhere –  will disagree, it means very little in substance and constrains no practical choices.  The substance of any tax reform will no doubt flow from the tax working group they propose to establish –  where the terms of reference and the people they agree to appoint will matter rather a lot.

My main interest in the whole document is the commitment to establish a fiscal council.

Measuring our success in government

  • The credibility of our Budget Responsibility Rules requires a mechanism that makes the government accountable. Independent oversight will provide the public with confidence that the government is sticking to the rules.
  • We will establish a body independent of Ministers of the Crown who will be responsible for determining if these rules are being met. The body will also have oversight of government economic and fiscal forecasts, shall provide an independent assessment of government forecasts to the public, and will cost policies of opposition parties.

It isn’t in the official document, but in another interview with Robertson he confirmed that the body would not be located inside Treasury.

The establishment of a body of this sort would be entirely conventional for an advanced, open, economy.  It is something the OECD, for example, has recommended for some time and (from memory) the Treasury’s own external reviewer a couple of years ago also favoured establishing one.

Early last year the Green Party came out advocating the establishment of an independent policy costing unit.  I wrote about the proposal here.  It was a well-intentioned, but somewhat flawed, proposal – including because, somewhat surprisingly, it had proposed locating the independent unit, to cost opposition party policies, inside the Treasury.

I noted at the time that

I reckon that if New Zealand is going to establish such a unit it should be done as an office of Parliament, and I wonder why the Greens chose not to take that option.  Perhaps they took the view that such a unit would be cheaper if it operated within Treasury (drawing on the corporate functions of a larger organization).  But even if that were true, I suspect it would be a false economy.

On the overall proposal, I noted

But is it worth going down this track?  I’m still ambivalent.  I don’t think there is enough thoughtful scrutiny of macroeconomic policy issues in New Zealand (and touched on some of that here), and before the Greens proposal goes any further it would be worth looking carefully at what is done in other countries.

Before concluding

On balance, I still think there is a role for something like a (macro oriented) fiscal council in New Zealand, perhaps subsumed within the sort of macroeconomic or monetary and economic council I suggested here (but perhaps that just reflects my macro background).   And there is probably a role for better-resourcing select committees.  But when it comes to political party proposals, if (and I don’t think the case is open and shut by any means) we are going to spend more public money on the process, I would probably prefer to provide a higher level of funding to parliamentary parties, to enable them to commission any independent evaluations or expertise they found useful, and then have the parties fight it out in the court of public opinion.  The big choices societies face mostly aren’t technocratic in nature, and I’m not sure that the differences between whether individual proposals are properly costed or not is that important in the scheme of things (and perhaps less so than previously under MMP, where all promises are provisional, given that absolute parliamentary majorities are very rare).  If there are serious doubts about the costings, let the politicians (and the experts each can marshall) contest the matter.

I presume Labour and the Greens are still some considerable way from pinning down all the details of how the proposed body would work.  I remain a bit sceptical about the policy costing dimension of the proposal, for reasons outlined at greater length in the earlier post, and suspect that if they do get the unit up and running it will be a distinctly secondary function.

The main area where a fiscal council –  or indeed, a broad macro policy advisory council –  could add value is around the bigger picture of fiscal policy (not just rule compliance, but how the rules might best be specified, and what it does (and doesn’t) make sense to try to do with fiscal policy).

But there are still important caveats.  For example, it is fine to talk in terms of the council having “oversight of government economic and fiscal forecasts”, but quite what level of resource would that involve?  Does the proposal envisage that the core forecasting role, on which government bases its policies, would move outside Treasury?  Even if there was some merit in that, it would be likely to end up with considerable duplication –  since neither the Treasury nor the Minister is likely to want to be without the capability to have their own analysis done, or to critique the work of the fiscal council.  The UK’s experience is likely to be instructive here, but we also need to recognise the small size of New Zealand and the limited pool of available expertise.  Our population –  and GDP –  are less than a 10th of the UK’s.

Again, I think Labour and Greens are moving in the right direction here, so I’m keen to see a good robust institution created, not to undermine the proposal.   The success of such a body over time will depend a lot on getting the right people to sit on the Council, and to keep the total size of the agency in check.   Too large and it will be an easy target for some other future government –  no doubt enthusiastically offered up by a Treasury keen to remove a competing source of advice.  But make it too small, or with too many establishment figures on the Council, and people will quickly wonder what is the point.  As it is, we don’t have a lot of independent fiscal expertise in New Zealand at present (as distinct, say, from specific expertise on eg aspects of the tax system).   I presume that if they form a government later in the year, Labour and the Greens will be looking quickly to the experiences in this area of small advanced countries like Ireland and Sweden.

My other caveat isn’t a specific criticism of this proposal, but rather a more general one. It is always easy to establish new, small, government entities.  Each on its own doesn’t cost much, but they all add up.  Perhaps there would be something to be said for a one-in one- out “government entity budget”, to parallel the “regulatory budget” approach being tried in a few places.  I wonder which entity Labour and the Greens would kill off to make way for a fiscal council?   It would be easy for someone on the more sceptical side of the debate around the role of government, and the incentives/capabilities of government, to come up with a list.  But that isn’t usually where Labour and the Greens are coming from and in time layer upon layer of marginally useful government entities provide lots of jobs for the boys (and girls).  It has been a while since there was a good quango-hunt.  Perhaps we are overdue for another?

What does the OECD really have to offer us?

The Organisation for Economic Cooperation and Development (OECD) is often loosely described as “the rich countries club”.  It isn’t an entirely accurate description –  there are several high income oil exporting countries who don’t belong (as well as places like Singapore and Taiwan), and some countries that are members (notably Mexico and Turkey) aren’t particularly high income.     But it is a grouping of mostly fairly advanced fairly open economies (New Zealand’s been a member since 1973).   And the organisation claims to be able to offer useful advice to countries as to how to improve their economic performance.  I’ve become increasingly sceptical of that proposition, especially as regards New Zealand.

On a biennial cycle the OECD’s Economic and Development Review Committee (EDRC) meets in Paris to review each member country’s overall economic performance, and offers some specific advice both on general economic management issues and on specific topics agreed in advance between the secretariat and the country concerned.  I wrote about the process, which draws on extensive staff work, on the day New Zealand was last reviewed in April 2015.

The next review is almost upon us.  The EDRC is scheduled to discuss New Zealand on 20 April, so the draft text is probably already in the hands of New Zealand government agencies.   The final text will presumably be released in late May or early June.  This year’s agreed special topics are “Increasing Productivity”, and “Labour Markets and Skills”.    The latter topic apparently includes the New Zealand immigration system, and when the OECD team came to Wellington last year I participated in a meeting with them, along with various government agency representatives, on some of the strengths and weaknesses of our system.   Historically, the OECD tends to be very strongly pro-immigration –  without much evidence for its benefits, especially in remote places like New Zealand –  and I expect their treatment this time will again reflect that presumption, probably with some suggested tweaks at the margins.   But, as often, the OECD might be able to present some cross-country data on the issues in interesting ways.

Quite what they’ll come up with to increase productivity could be more interesting.   In many ways, New Zealand is a test for whether the OECD has much useful to say.  For a member that was once among the richest and most productive OECD economies and now languishes a long way down the league table, New Zealand has been a bit of an embarrassment to the OECD.  After all, we did an awful lot of what they suggested 25 to 30 years ago.

I’m writing about the issue because a few days ago the OECD released one of their flagship cross-country publications, Going for GrowthThese documents often contain a lot of interesting cross-country comparative material –  data collection and presentation is one thing the OECD defintely does well.  But they also get specific, and have a couple of pages of economic policy priority recommendations for each country.  Since the OECD  must already have written their full substantive report on New Zealand for the forthcoming EDRC survey, one might have expected that the recommendations for New Zealand would be particularly incisive and well-focused, offering suggestions which, if adopted, would clearly help reverse our long-term underperformance.   As they note, labour productivity gaps between New Zealand and the other advanced economies have continued to widen over the last quarter century.   As the OECD’s own chart illustrates, real GDP per hour worked is now about 37 per cent below the average for the countries in the upper half of the OECD  (these are countries from Luxembourg and Norway at the top, to Italy and the UK at the bottom).

So what does the OECD propose for New Zealand?

  1. Reduce barriers to FDI and trade and to competition in network sectors.   Recommendations:  Ease FDI screening requirements, clarify criteria for meeting the net national benefit test and remove ministerial discretion in their application. Encourage more extensive use of advance rulings on imports and improve the publication and dissemination of trade information. Sell remaining government shareholdings in electricity generators and Air New Zealand. Remove legal exemptions from competition policy in international freight transport.
  2. Improve housing policies. Recommendations: Implement the Productivity Commission’s recommendations on improving urban planning, including: adopting different regulatory approaches for the natural and built environments; making clearer government’s priorities concerning land use regulation and infrastructure provision; making the planning system more responsive in providing key infrastructure; adopting a more restrained approach to land regulation; strengthening local and central government emphasis on rigorous analysis of policy options and planning proposals; implementing pricing to reduce urban road congestion; and diversifying urban infrastructure funding sources.
  3. Reduce educational underachievement among specific groups. Recommendations: Better target early childhood education on groups with low participation in such education. Improve standards, appraisal and accountability in the schooling system.To improve the school-to-work transition, enhance the quality of teaching, careers advice and pathways, especially for disadvantaged youth, and expand the Youth Guarantee. Facilitate participation of disadvantaged youth in training and apprenticeships. Students from Maori, Pasifika and lower socio-economic backgrounds have much less favourable education outcomes than others.
  4. Improve health sector efficiency and outcomes among specific groupsRecommendations: Increase District Health Boards’ incentives to enhance hospital efficiency, improve workforce utilisation, integrate primary and secondary care, and better managed chronic care. Continue to encourage the adoption of more healthy lifestyles.
  5. Raise effectiveness of R&D support. Recommendations: Further boost support for business R&D to help lift it to the longer term goal of 1% of GDP. Evaluate grant programmes. Co-ordinate immigration and education policies with business skills needs for innovation.

The general goals seem fine, in as far as they go.  And some of the specifics seem sensible enough too (others –  more R&D subsidies, government encouragement of “more healthy lifestyles”  –  seem distinctly questionable).    But could anyone with a reasonably in-depth understanding of the New Zealand economy and its performance over the last few decades, really think that that list, even if adopted in full, would really make a material difference in turning around New Zealand’s long-term productivity underperformance?   I’m all for fixing the housing policy disaster, but when the OECD talks of the agglomeration gains that might make possible, have they actually looked at the dismal Auckland productivity performance over a period when Auckland’s population has already grown very rapidly?

It is also quite surprising what they don’t mention.   Perhaps macro imbalances, such as our persistently high real exchange rate, or our (typically) highest real interest rates in the OECD, don’t easily fit in a structural policy document –  although they are significant symptoms that a list of possible structural policy remedies needs to notice.

But the OECD does publish as part of Going for Growth quite a range of cross-country comparative data on various structural policy indicators.  Even then there are puzzling omissions.  There is nothing at all, for example, on immigration policy.    And company tax is also missing.   Here is the data from the OECD website on statutory company tax rates for 2016.

company tax rates

New Zealand is in the upper third of OECD countries –  and with a company tax rate well above that group of countries (from the Czech Republic to Switzerland) at around 20 per cent.   I’m all in favour of reducing FDI barriers, for example, but for many firms who might consider establishing here, the likely tax bill is probaly a more significant consideration.  And I suspect it offers more payoff in improving productivity than the health system, whatever the merits of the specifics they propose there.

It was also interesting that the OECD does not mention our labour laws.    It is well-known that our minimum wage is quite high relative to median wages/labour costs. In fact, the OECD again illustrate it in their indicator pack. This is their chart, and I’ve simply highlighted New Zealand.

min wage OECD

It is a quite a stark picture, but doesn’t seem to be a priority issue for the OECD.  Actually, I doubt altering the minimum wage laws offers very much on the productivity front, but even if one is simply concerned about disadvantage (as they very much seem to be) we know that getting people into jobs is the best path towards longer-term economic security.   One needn’t go to the US end of this spectrum, but places like the Netherlands and Belgium aren’t exactly known as bastions of heartlessness, small government or whatever.

Overall, I think the list still suggests the OECD has very little idea what has gone wrong in New Zealand, and hence has little more than a generalised grab bag of ideas to offer in response –  many no doubt quite useful in their own way, but mostly likely to be tinkering at the margins.

Out of curiousity, I had a look at what they had to recommend for the previous country on the (alphabetical) list –  the Netherlands.  It is an interesting country too.  Productivity –  GDP per hour worked –  is above that for the group of countries in the upper half of the OECD.  Indeed for decades productivity levels in the Netherlands have been very similar to those in the United States.  Per capita income lags a bit behind, because Dutch people on average don’t work long hours each year (although the participation rate is high).    But it is, by most counts, a very successful economy.    Real GDP per hour worked is about 65 per cent higher than in New Zealand.

What does the OECD recommend for them?

  1. Lower marginal effective tax rates on labour income.
  2. Ease employment protection legislation for regular contracts and duality with the self-employed.
  3. Reform the unemployment benefit system and strengthen active labour market policies.
  4. Increase the scope of the unregulated part of the housing market
  5. Increase direct public support for R&D  [even New Zealand spends more on this than they do]

Setting aside the OECD’s taste for R&D subsidies, it mostly seems sensible, plausible, and well-targeted.  They  seem to have a better idea what to offer an already rich and successful country in the heart of Europe, than they have to offer a once-rich now-underperforming remote one.   For us, that is a real shame.

One can only hope that when the productivity chapter of the forthcoming New Zealand economic survey comes out, they can offer a more persuasive grounded set of recommendations as to what might make a real difference in reversing our decades of underperformance.

(For a more optimistic take on the OECD’s recommendations for New Zealand, see Donal Curtin’s assessment.)


In sort of, kind of, half-hearted partial defence of Wellington City Council

That isn’t a stance that comes naturally.   Wellington City Council wastes money with the best of them (convention centres, possible runway extension, bike stands outside our church, and so on –  they even use ratepayers’ money to help fund the New Zealand Initiative) and presides over land-use restrictions that deliver increasingly high house prices.  And then there are more localised gripes – but which have managed to get quite a bit of national coverage –  like the Island Bay cycleway.

It was built without adequate consultation, and after it was built an overwhelming majority of participants in a well-run survey of residents conducted by the Residents Association told the Council they didn’t like it and wanted it gone.  There was never an obvious reason for it in the first place –  The Parade was one of the wider flatter safer streets in Wellington –  but the then Mayor lived in Island Bay and liked to cycle to work.   (It remains part of a grand vision of a cycleway all the way into the city –  key bits of rest of the route currently serviced by roads that are barely wide enough anyway).   And the only bit of the street I’d be a bit hesitant about cycling –  through the shopping centre, with reversing angle parkers etc –  is the only bit where there is no cycleway.  It has been a fiasco all round.  It is still relatively early days, but as someone who is mostly a pedestrian or a motorist, I suspect the overall environment is now more dangerous than it was (not very).  As a pedestrian, one suddenly finds the cycleway merging with the footpath (to get round bus stops).  As a motorist turning out of side streets it is materially harder to see oncoming traffic than it used to be.  And I’m not at all sure how people who live on The Parade, backing out of their driveways, cope.  It would probably matter even more if there were many cyclists, but on a nice autumn morning I just walked the length of the cycleway and didn’t see a cyclist.

The story is back in the news because a local dairy owner has decided to close his business, and blames the loss of short-term parking for a downturn in business (more than a few parks were removed to facilitate the cycleway).  Perhaps so, but I’m just a little sceptical.  Perhaps that is partly because it isn’t clear to me who uses dairies, even when parking is no problem, apart perhaps from school kids buying lollies.   I’m in the neighbourhood all day, and I might have used a dairy twice in a year.  But along the length of the cycleway –  a distance I just walked in 14 minutes –  there are six dairies (including the one planning to close soon) and a full-service supermarket (open from 7am to 10pm every day), for a population of around 7000.  There were only one or two more when I first moved here 40 years ago.  On one corner, two dairies face each other across the street –  and somehow seem to survive.  And actually, the dairy that is to close is the furthest from all the others, and the only one everyone has to pass coming into Island Bay from the city.  It is a little hard to believe that the ill-considered cycleway is the only, or even dominant, factor.  The Wellington City Council is guilty of many things, and a prima facie assumpton that they will be guilty of whatever they are charged with is often safe (don’t get me started on the walkway they currently have indefinitely closed to protect “heritage interests”), but perhaps not this time.

None of which excuses the inaction on the cycleway.  It was kicked beyond the election last year, even after the survey results had been released, and now we are told to expect a decision in six months time.  Meanwhile, of our two local councillors, one is off to become a member of Parliament –  unless perhaps the Greens find a more dynamic candidate, in this one of their strongest party vote seats –  and the other sees his future in Christchurch –  he’s running for Parliament for the Greens in Ilam.   The fear remains that the other councillors, the bureaucrats, and the cycling lobby  –  all keen on a whole network of cycleways –  will just wait things out and the monstrosity will be with us forever.

Agreeing with the Governor

If I go on finding myself agreeing with Graeme Wheeler, there won’t be much point writing about OCR announcements.  But, as it happens, he has only three more to deliver.

I could quibble about a few details in this morning’s announcement, but the only one I wanted to highlight briefly was this proposition

Monetary policy will remain accommodative for a considerable period.

In six months and a few days, the Governor will have moved on.  We’ll then have an acting Governor, with no Policy Targets Agreement, for six months.  And not until this time next year will we have in place a monetary policy decisionmaker, with an agreed target, who can make moderately credible statements about possible monetary policy decisions over the medium-term.    So to be strictly accurate,  that sentence should probably have read something like

“If the forecasts underpinning today’s decision are roughly right, and if my successors have (a) the same target I do, and (b) the same interpretation of that target, and the same reaction function, then monetary policy will remain accommodative for a considerable period.”

But in this post, I’m backing the Governor, and one line I was particularly pleased to see was this one (emphasis added)

Global headline inflation has increased, partly due to a rise in commodity prices, although oil prices have fallen more recently. Core inflation has been low and stable.

I made that point here a while ago, so I was pleased to see the Reserve Bank also highlight the  point.    Here is what I mean, using the OECD’s data on CPI inflation ex food and energy –  the one readily available and consistently compiled core inflation measure.

OECD inflation ex food and energy

I’m using monthly data, to be as up-to-date as possible, and New Zealand and Australia don’t have monthly CPI data.  But the comparable quarterly chart doesn’t look materially different.

I’ve shown two lines.  The first is the median core inflation rate for all individual OECD countries (with monthly data).  But that includes 19 euro countries (plus Denmark) that have only one monetary policy.  So the second line is the median core inflation rate for the distinct monetary policy countries/areas –  ie delete the individual euro area countries, and replace them with an inflation rate for the euro area as a whole.  I’d probably tend to emphasise that measure.

But on neither measure is there any sign that core inflation has been picking up at all.  And although the US has been raising its policy interest rate to some extent, there have been more cuts in policy interest rates in the last 18 months or so (the sort of time it takes policy to work) than increases.

Of course, that is only actual inflation outcomes.  Perhaps there is more inflation just ahead of us –  a story markets seem to have taken a fancy to.

For what it is worth, international agencies still thought there was a negative output gap across the advanced world last time they looked (the OECD thought it was -1.4 per cent last time they updated their published forecasts).

The unemployment picture –  another read on excess capacity and resource pressures -is a bit different.    For the G7 countries as a whole, the unemployment rate is now a touch below the troughs reached at the peak of the last boom.    For the OECD group as whole – even including places like Greece –  it is only around 0.7 percentage points higher than at the peak of the last boom.  For the median OECD country, the unemployment rate now only about half a percentage points above the average for the last boom year (2007).

Here are the unemployment rates for the largest OECD economies

U rates big countries

The unemployment rates have been falling for some considerable time, and there has been no pick up in inflation yet.  For each fall, of course, the respective NAIRUs must be getting closer, but it is probably safer to wait and see that core inflation has actually begun to rise –  especially in view of the low starting level –  than to simply assume that it must happen soon.

Of course, when one looks at unemployment rates what does tend to stand out is how little the unemployment rates in New Zealand and Australia have come down.

U rates NZ and AusIn both countries the current unemployment rate is around 1.5 to 1.7 percentage points higher than it was in the year or so prior to the global downturn.  And neither country was troubled by a domestic financial crisis, nor did they run out of room to use conventional monetary policy.  The monetary policy authorities should have been able to do better.   If I look across the monetary areas in the OECD (again replacing individual euro area countries with the region as a whole), the only places with a worse record on this score –  unemployment rates now compared to the pre-recession levels – are:

  • the euro area as a whole (visible in the first chart above) where they did run out of conventional monetary policy options,
  • Norway, and
  • Turkey, not a paragon of economic management or political stability.

Core inflation measures have been picking up a little here, as they should have after the sharp cuts in the OCR the Reserve Bank had to implement.    But our unemployment record –  at a time when much of the rest of the advanced world has been able to run unemployment rates back near pre-recessionary levels without (yet) seeing signs of core inflation rising –  is one reason why I think the Governor is quite right not to express any bias about the direction of the next change in interest rates, however far away (and delivered by a person yet unknown) that might be.