Not Treasury at its best

On 25 June last year, I wrote to The Treasury requesting

copies of any material prepared by The Treasury this year on regional economic performance, particularly in New Zealand. I am particularly interested in any analysis or advice –  whether supplied to the Minister or his office, or for use internally –  on the economic performance of Auckland relative to the rest of the country (whether cyclically or structurally).

It wasn’t simply a request out of the blue, but was prompted by a speech given a few days previously by the Secretary to the Treasury, Gabs Makhlouf, The Importance of Being Auckland: Strengths, Challenges, and the Impact on New ZealandIn my post on that speech, I’d been quite critical of Makhlouf.

He’d begun his discussion this way

Why do I find this exciting? It’s because high levels of diversity provide dividends including through increases in innovation and productivity.

Auckland’s diversity is particularly critical for our international connections. There’s much more to international connections than trade. It’s the other international flows – flows of capital and people, and the accompanying flow of ideas – which are the key to reinventing trade, and which will lay the foundation for a more prosperous New Zealand in the long-run.

The high number of overseas-born Aucklanders can bring new skills, new ideas and a diversity of perspectives and experiences that help to make our businesses more innovative and productive. And perhaps most importantly, they often retain strong personal and cultural connections to other parts of the world, which opens up, and helps us to pursue, new business opportunities.

Auckland is truly New Zealand’s gateway to the world. It’s not just that there is a big number of companies here doing business internationally. It’s the port and airport linking the country to global markets; and tertiary institutions, researchers and innovators linking us to global knowledge.

To which my response was

Which might all sound fine,  until one starts to look for the evidence.  And there simply isn’t any.  Perhaps 25 years ago it was a plausible hypothesis for how things might work out if only we adopted the sort of policies that have been pursued. But after 25 years surely the Secretary to the Treasury can’t get away with simply repeating the rhetoric, offering no evidence, confronting no contrary indicators, all simply with the caveat that in “the long run” things will be fine and prosperous.  How many more generations does Makhouf think we should wait to see his preferred policies producing this “more prosperous New Zealand in the long run”?

If the Secretary to the Treasury was going to address the economic issues around Auckland, one might have hoped there would be at least passing reference to:

He might also have linked to the recent presentation by Jacques Poot (in a Treasury guest lecture), in which Poot was keen not to sound very optimistic about just how large those economic benefits of diversity really are, or to the work of Bart Frijns – an (immigrant) professor in Auckland (see last sentence of the extract above) –  whose recent work suggests that on some measures, in some contexts, there may be net costs, not benefits at all.

Of course, one can’t say everything in a single speech, but when a credible case could be made that the Auckland-centred model is in serious trouble, it is bordering on the seriously unprofessional to not even allude to any of these sorts of points, even if only to explain why the Secretary interprets then differently than, say, I might.

So I was curious about what background analysis Treasury had been doing, or what advice it might have been providing to the Secretary or the Minister, in support of Makhlouf’s “cheerleading” for the Auckland story.

It turned out that there was none –  or none recent anyway.  But it took some considerable time and effort to extract even that information.

Their initial response was fairly prompt.  It came on 12 July.  Treasury told me that they were “currently updating their analysis and advice on regional economic performance, including Auckland performance” and expected to include this analysis and advice in future strategic documents, including the next Long-Term Fiscal Statement.  Accordingly, they declined to release any material, citing as grounds under the Official Information Act the need to “maintain the current constitutional conventions protecting the confidentiality of advice tendered by ministers and officials”.

I lodged a complaint with the Ombudsman.  Perhaps some “advice” did need to be kept confidential for the time being, but it was hard to believe that the underlying “analysis” could legitimately be withheld.  And then I didn’t think much more about the matter –  the wheels of the Ombudsman’s office often grind exceedingly slowly.

But last week, somewhat out of the blue, I got a letter from Treasury, to advise that

“following the release of our Long-Term Fiscal Statement…… I have revisited my decision and am now able to release the relevant material to you”.

Doing so eight months after the original request, and three months after the release of the LTFS itself, was no doubt just enough to avoid having the Ombudsman rule against them.

And what had all this been to protect?  Well, almost nothing.   It turned out that there was one internal discussion document (and a set of slides covering the same material) prepared for some discussion forum Treasury staff and management were participating in.   There was no advice to the Minister, or to the Minister’s office, at all, so it is a little hard to see how they can have legitimately invoked, as grounds for withholding this material last year, constitutional conventions protecting the advice tendered by ministers and officials.  Perhaps the fact that there was almost nothing was what they wanted to protect, but that isn’t good grounds under the Official Information Act.

For anyone interested here is the document they released (Treasury usually put OIA releases on their website, but this one doesn’t seem to be there yet).

official-information-act-response-auckland-regional-performance-michael-reddell-20160227-2

The document seemed mainly focused on trying to get ahead of potential political pushes for further specific interventions in poorer regions and local authority areas in New Zealand, and there is some interesting material there.   On Auckland, there was little beyond conventional pre-conceptions (these extracts are from various places in the document).

As agglomeration and clustering theory predicts, our more urban services-based regional economies (Auckland and Wellington and to a lesser extent Christchurch) are relatively more productive and generate higher incomes than our more resourve-based regional economies.

Our Treasury preference is usually to encourage or permit the continued concentration of economic activity in key centres (forces of agglomeration) where returns are expected to be greatest.  Resources and activities should be allowed to flow betwen regions over time.  Agglomeration suggests productivity benefits from large diverse cities and clusterng suggests some businesses benefit from being in smaller but specialised cities. This means higher economic performance but spatial differences.

This view was reinforced by the 2010 economic geopgraphy debate, which emphasised the importance of agglomeration (and Auckland especially), and implicitly downplayed the economic significance of “non-agglomerating” areas.

Not a mention of how the gap between Auckland levels of income and those of the rest of the country are small compared to those typically seen between largest cities and the rest of the country in other advanced countries.  And not a mention of how those gaps have been closing rather than widening.  In other words, little attempt to grapple with the specifics of the New Zealand experience at all.

We should expect better from our premier economic advisory agency, both in terms of the quality of the analysis and advice they are presenting, and in complying with both the letter and spirit of the Official Information Act.

And in the meantime, the grand Auckland Think Big experiment rolls on, cheered on by the Secretary to the Treasury.  After 25 years we might reasonably expect our officials and ministers to be able to point to evidence of the success of the strategy.  If it is there, they haven’t found it yet.  More likely, it just isn’t there, and decades of bringing more and more non-New Zealanders to Auckland (even as New Zealanders, net, leave Auckland in modest numbers), looks like a strategy that has unbalanced the economy, and produced few real gains, whether for Aucklanders or the rest us.


Getting the small things right

Readers may be getting bored with a full week of posts on nothing other than Reserve Bank topics.  In truth, so am I.    But here is one last post in the sequence.

Saturday’s Herald featured, as the front page of the business section, an interview with outgoing Reserve Bank Governor Graeme Wheeler.    This seems to have become a bit of a pattern –  the Herald gets access to the Governor the day after the MPS, to provide a bit of a platform for whatever the Governor wants to say.  The interviews are notable for being about as searching and rigorous as, say, the recent Women’s Weekly profile of Bill and Mary English.

The interview allowed the outgoing Governor to “launch the campaign” to become Governor for his deputy (and former Government Statistician), Geoff Bascand.    That shouldn’t surprise anyone.  Then again, it has now been 35 years since an internal candidate was appointed Governor.  Successful organisations – the Reserve Bank of Australia is one example –  are often seen promoting from within.

But my interest in the interview mostly centred on the Governor’s claim that “the economy is in very good shape”, and that we really should be grateful to the Reserve Bank for being a “big part of that outcome”.    I had to read it several times to be sure I wasn’t missing something.   Here was the full excerpt:

Broadly, if you look at where New Zealand is now “in terms of growth, inflation, unemployment rate, current account as a share of GDP, labour force participation and compare all that with a 20 or 30 year average, then the economy is a very good shape”, he says.

“It is puzzling to me why some of the commentators been so critical when the Reserve Bank is a big part of that outcome. We aren’t the whole story by any means, but our monetary policy configurations do have a major impact on the economy.”

In the initial version I read online on Saturday, and in the hard copy newspaper, that “compare all that with a 20 or 30 year average” read “compare all that with a 2009 year average”.    Quite which of them the Governor actually said, or intended to say, isn’t clear.  But either way, it isn’t very convincing.  2009 was the depth of the recession: economies tend to recover from recessions.  Pretty much every economy in the world –  perhaps with the exception of Greece –  has done so to a greater or lesser extent.  It is no great achievement to cut interest rates a lot in a recession.

But lets grant that the Governor meant to refer to comparisons with a 20 to 30 year average (I’ve seen him make such comparisons previously).  How then do his claims stack up?  He lists several indicators to focus on. Of them

  • Per capita growth –  the only sort of growth that really matters –  has been pretty weak this cycle compared to that in previous recoveries and growth phases,real-gdp-pc-aapc
  • Inflation is (of course) low, but then it is supposed to be higher.  The target is centred on 2 per cent –  a rate we haven’t seen for several years –  and was previously centred on 1 per cent, and then 1.5 per cent.  Trend inflation outcomes are the responsibility of the Reserve Bank, but those outcomes have been away from target for some time.
  • The unemployment rate is below a 20 or 30 year average –  although well above the average prior to the mid 1980s –  but then all estimates (including the Bank’s) are that the NAIRU has been falling over that time, and no one claims that that has been because of monetary policy (any more than previous increases were).
  • The current account deficit is certainly smaller than it has been.  But that is mostly because interest rates have been so much lower than had been expected (s0 that the servicing costs of the large stock of external debt have been surprisingly low).  Much of the time, the Governor is more inclined to lament, than to celebrate, just how low interest rates have been, here and abroad.
  • Labour force participation is higher than the historical average, but it isn’t clear why this is unambiguously a good thing.    Work is a cost to individuals as well, at times, a source of satisfaction, but mostly people work to live.  In a subsistence economy, pretty much 100 per cent of adults work.  When New Zealand had the highest per capita incomes in the world, participation rates were lower.

But, of course, even then the Governor has cherrypicked his data.    There isn’t even any mention in this list of disastrously high house prices, or of the household debt stock, let alone of the real exchange rate, or the productivity growth performance, or the weak performance of the tradables sector, or of the large gaps between New Zealand incomes/productivity and those in most other advanced countries.

You might think that those are simply “Reddell hobbyhorse” indicators.   But we know the Governor cares a lot about house prices and household debt, and about the real exchange rate.  And it isn’t that long –  before he became embattled, and seemed to feel the need to become something of an apologist for New Zealand’s economic performance –  since he was talking about exactly the same sort of stuff.

Just a few weeks after he became Governor, he gave a speech in Auckland on Central banking in a post-crisis world . In the opening paragraphs of that speech he counselled

With these assets we should be capable of stronger economic growth. Internationally, and particularly in smaller economies, economic growth is driven by the private sector and its ability to compete on global markets. We need to reverse the slowdown in multifactor productivity growth since 2005 and the decline in value added in our tradables sector. And we need to reverse the shift of resources into the public sector and other non-traded activities.

Productivity growth hasn’t improved –  if anything the reverse – since then, exports as a share of GDP have been slipping, and there has been no sustained rebalancing towards the tradables sector.

t-and-nt-gdp-feb-17

They were the Governor’s words, not mine.

Another couple of months into his term, he gave another interesting speech, this time Improving New Zealand’s Economic Growth.   Back then he seemed concerned about productivity (and the lack of it)

Since 1990 we’ve outperformed many OECD countries on inflation and unemployment. Our inflation rate has been one and a quarter percent below the OECD median and our unemployment rate half a percent lower. But our per capita income has lagged behind and we’ve run large current account deficits. Real per capita GDP growth has been one and a quarter percent, about half a percent below the median and our current account deficit has averaged five percent of GDP – about the 6th largest relative to GDP in the OECD region.

There are two main ways in which our prosperity can improve over the longer run. The first is if the world is willing to pay more for what we produce. The second is by raising our labour productivity – that is by increasing the level of output per working hour. In the short term, we can generate higher income if we increase labour force participation or work longer hours. But we already have a higher proportion of our population in the labour force than nearly all other OECD economies and we work longer hours than most people in the OECD.

and

This is striking given the high international rankings for the quality of our institutions, control of corruption, ease of doing business, and according to the World Bank, the highest per capita endowment of renewable resources in the world.

Chart 2: Labour productivity growth in selected OECD economies, 1990-2011

(Average annual rate)

5124340_files/gw-improving-new-zealand-s-economic-growth-cecc-february-201301.jpg

Source: OECD

So why is our per capita income so far below the OECD median? Partly it’s due to our geographic location and small economic size. Distance and economic size matter a lot even in a more globalised world of trade, capital and knowledge flows, and increasing interdependence. This also partly explains why our export range is concentrated over relatively few products – with food and beverages accounting for almost half our exports. The OECD and IMF believe size and distance, which limit economies of scale and market opportunities, account for around three quarters of the gap in our per capita income compared to the OECD average.

But this is not the whole story. Despite our high international rankings in key areas, the latest World Economic Forum’s Global Competitiveness Report ranks New Zealand’s overall competitiveness at 25th out of 142 countries. Besides market size, we perform poorly on our macroeconomic environment, and especially on our budget deficit and low national savings. But regulatory and performance-related factors also diminish our growth potential. Many of the remedies to substantially improve our ranking lie in our own hands, and groups such as the 2025 task force, the Savings Working Group, and the Productivity Commission, emphasised reforms that can raise our living standards.

He thought then there were three areas governments should focus on

Three areas seem particularly important. The first, is to raise our level of saving and investment, and improve the quality and productivity of our investment.

The other two were to close fiscal deficits, and to lift human capital. On the latter he observed

The bottom income deciles are populated by those with lesser skills, and those who experience prolonged and recurrent spells of unemployment. Addressing these groups would both promote productivity and reduce inequality.

Very little has changed since the Governor gave those speeches early in his term.  The fiscal deficit has been closed, and no doubt the Governor would welcome that.  But in late 2012 and 2013, there was just no sign that he thought the economy was in “very good shape” –  rather it had key pretty deeply embedded structural challenges – and few of the key indicators he cited have changed for the better since then.

Now, to be clear, (and as central bank governors have pointed out for decades) very little of this is down to the Reserve Bank.  Central banks aren’t responsible for  –  and don’t have much influence on trends in –  house prices, current account deficits, productivity growth (labour or multi-factor), the health of the tradables sector, savings rates, participation rates or NAIRUs, let alone human capital and inequality.  So the fact that the economy isn’t in particularly “good shape” –  even if it isn’t doing that badly on some purely cyclical measures – isn’t the Governor’s fault, or that of the Reserve Bank.  What the G0vernor can do is keep inflation close to target, and help safeguard the soundness of the financial system.

Which makes that line of the Governor’s, from Saturday interview, so puzzling

“It is puzzling to me why some of the commentators been so critical when the Reserve Bank is a big part of that outcome. We aren’t the whole story by any means, but our monetary policy configurations do have a major impact on the economy.”

After all, since 2009, the Reserve Bank has twice started tightening monetary policy only to have to reverse itself.  I’m not today getting into the question of how much of that was a foreseeable problem.  Even if none of it was, the fact remained that the Bank twice (out of two times) had to reverse itself.    Neither episode –  tightening and then reversal –  had the sort of major positive impact on the economy that the Governor talks of.  At best, they probably did little damage.  And those episodes aside, the Reserve Bank just hasn’t done much on monetary policy for years.   People –  like me –  have been critical of the Reserve Bank’s monetary policy management because of (a) those reversals, (b) the refusal to even acknowledge mistakes, (c) more recently, almost laughable attempts to rewrite history to suggest they were easing when in fact they were tightening.  And, of course, the persistent deviation of inflation from target, and the concomitant extent to which the unemployment rate has been kept unnecessarily higher than required, or than the Bank’s own estimate would have suggested.  Those outcomes suggested that, on average, monetary policy has been a bit too tight, as well as unnecessarily variable.

Is the aggregate cyclical position of the economy terribly bad?  No, it isn’t.  But it isn’t great either, and the longer-term metrics give even less reason for an upbeat story.  The Graeme Wheeler who took up the job of Governor in late 2012 was better than this.  Back then, he was willing to highlight what he saw as some of the structural problems.  Perhaps it wasn’t his job –  central bank governors don’t need to get into that territory, but he chose to.   If he ventures into such territory, what we should expect is a Governor who calls things straight –  for whom black doesn’t become white just because the Governor himself has himself had a rough few years.  If he no longer feels he can name the serious economic challenges New Zealand still faces, perhaps he’d have been better to keep quiet rather than further undermine his good name with the sort of propaganda that we shouldn’t hope for, but might nonetheless expect, from a political party or lobby group.

Why do I bother, you might wonder?  I was reading this morning a brief piece written to mark the anniversary of the death of  US Supreme Court justice Antonin Scalia, by one of his former law clerks.   The author wrote about “five lessons for living well” that he had seen in the judge’s life.  One of them was

“Be honest in the small things, even if it makes life more difficult”

If our democracy and institutions are to be strong, it is what we should expect from people in powerful public office.    It is too easy to put out “propaganda” and for it to slide past, and for people to nod in acquiescence when they read stuff they don’t know a lot about.  At one level, Graeme Wheeler’s interview doesn’t matter much –  and he’ll be off to pastures new shortly –  but we deserve better, from our journalists and (in particular) from those who seek out and voluntarily assume high public office.

A dynamic and diversified export sector or “alternative facts”?

The Prime Minister went to Auckland yesterday, accompanied by his Deputy and his Minister of Finance, to deliver what is popularly billed as a “state of nation” address at the Auckland Rotary Club.   I’m staggered that the Prime Minister could give such an address in Auckland and not once mention that house price debacle that his government, and the previous Labour government, have presided over, and done little to address.

But the bit of the speech that caught my eye was this

I’m proud that on the other side of the globe from the European capitals I visited a few weeks ago, New Zealanders have built a cohesive and globally competitive country that can provide valuable lessons to the rest of the world.

In recent years, New Zealand has dealt with the biggest financial crisis since the Great Depression, we’ve dealt with devastating earthquakes and we’ve made significant progress on deep-seated social and Treaty issues.

We now have a dynamic and diversified export sector,

In particular the suggestion that we have “built a globally competitive country” and as a result we “now have a dynamic and diversified export sector”.  (I wasn’t too sure about the “valuable lessons” we can apparently offer to the rest of the world, but I’ll leave that aside for now.)

Statistics New Zealand typically advise that the best way to look at longer-term trends in components of the national accounts is to use ratios of the various nominal series.    Doing so avoids deflator problems, and also recognises that prices –  earned and paid –  matter.   Here is the chart showing exports –  and imports –  as a share of GDP.

exports-and-imports-over-gdp

Exports as a share of GDP are now below where they were when the Prime Minister was Minister of Finance/Treasurer in the last days of the Shipley government in the 1990s (and lower than at any time since then, under Labour or National governments).

In a thriving, globally competitive, economy one would more normally expect to see both exports and imports trending upwards as a share of GDP.  For small countries that is even more important than large countries.

Out of curiosity I did dig out the data on export and import volumes and how they’ve grown relative to GDP.  Here is the chart for the last decade.

x-and-m-volumes

Export volumes have certainly increased a little faster than real GDP has, and import volumes more so.  But if the value of what we sell to the world (and then buy from it) hasn’t increased as a share of GDP, it doesn’t look like a particularly impressive story.

And finally, here is the chart I run every so often, showing an estimate of GDP broken down between the tradables sector (primary plus manufacturing plus export of services) and the non-tradable sector (the rest).  And I’ve presented both series in real per capita terms.  It isn’t a perfect proxy by any means, but it tries to get at the idea that domestic production for domestic consumption –  especially in the manufacturing sector – is often exposed to global competition too.

t-and-nt-gdp-feb-17

In real per capita terms, this estimate of tradables sector GDP hasn’t grown in more than 15 years.  The current estimated level is lower than the average for the 2000 to 2007 pre-recession period.

The evidence for this economy being globally competitive is slim at best.  There are no doubt plenty of individual firms doing well, but it doesn’t add up to much, especially as the starting point –  the initial share of exports (or export value-added) in our economy –  was already so low for a country our size.

In part, firms seeking to export –  or produce locally in competition with imports –  have been battling uphill.  The TWI measure of the exchange rate is around 79 this morning –  on the Reserve Bank’s real exchange rate measure only around 5 per cent off the post-float peak.    High real exchange rates can be a welcome thing, when they result from rapid productivity growth and the growing success of New Zealand firms in international markets. The high exchange rate rate then helps share the gains around.  But that simply isn’t –  and hasn’t for a long time –  been the New Zealand story.

I’m not entirely sure why politicians come out and say this sort of stuff (“globally competitive”, “dynamic and diversified export sector”).  It is particularly sad coming from the Prime Minister, who in his early years as Minister of Finance used to make exactly the sorts of points I’ve made in this post in speeches up and down the country: he was particularly fond of a version of the tradables/non-tradables chart.  And the government has long had as one of its targets a material increase in the share of exports in GDP, suggesting that they knew there was something not quite right about New Zealand’s economic performance.

But now, almost nine years in, they seem reduced to simply making up lines like these, that perhaps might feel or sound good, so long as no one actually looks into them.  Doing so discredits the speaker, and perhaps as importantly it further cheapens and debases political dialogue and debate.  Bill English should be better than that.

The underperforming New Zealand economy

Today’s labour market data seem to point again to the underperformance of the New Zealand economy.  Oh, the headline rates of GDP growth haven’t looked too bad –  although they are quite modest in comparison with previous New Zealand growth cycles –  and employment growth has been strong.  But to what end?  Labour productivity looks still to be shockingly weak, yet another year ends with the unemployment rate well above Treasury estimates of NAIRU, and even as core inflation has picked up somewhat (yesterday’s post) wage inflation seems to be about as subdued as ever.  There seems to be something quite wrong with the economic strategy that presides over such outcomes –  and no sign from the major opposition parties that they have anything materially better or different to offer.

Hours worked, as captured in the HLFS, have increased strongly in the last five quarters, up by 6 per cent (adjusting for the break in the series, because of new methodology in the June quarter last year).  There have only been a couple of periods in the 30 year history of the series that have seen growth in hours worked that rapid.

We don’t have GDP data for the December quarter yet, and of course earlier quarters are always subject to revision.  But for the four quarters we do have, real GDP (averaging expenditure and production measures) rose by 4.0 per cent.   In other words, unless quarterly GDP growth for the December quarter is at least 1.9 per cent, we’ll again have had no productivity growth at all during that five quarters of rapid growth in hours worked.  Few commentators I’ve seen think GDP growth was anything like that strong  –  something a bit over 1 per cent seems closer to expectations.  If so, we’ll have had really rapid increases in hours worked and employment, but the economy will have got less productive at the same time.  (And recall that we’ve now had five years of no productivity growth).

In the past, periods when growth in hours worked have been very strong haven’t always seen rapid productivity growth.  There can be good reasons for that, if (on average) lower productivity workers are being reabsorbed into employment for example.  In the early-mid 1990s we had a couple of years of very rapid growth in hours worked, and over that period productivity growth, although positive, was pretty weak.     But over that couple of years the unemployment rate fell from around 10 per cent to around 6 per cent, and the employment rate also rose by around 4 percentage points.

Here is the unemployment rate (four quarter moving average to smooth through some of the quarterly noise, down and up)

u-rate-dec-16  The unemployment is still slowly trending downwards, but the pace is quite excruciatingly slow.  Over the five years in which there has been no productivity growth, the average unemployment rate has fallen from around 6 per cent to around 5 per cent, and over that period Treasury estimates that the natural rate of unemployment (determined by things like demographics, welfare provisions and labour market regulation) has been falling –  and is now around 4 per cent.

So we’ve had:

  • no productivity growth (perhaps even a contraction over the last year)
  • high and only slowly falling unemployment (and for those inclined to glibly respond that 5 per cent unemployment isn’t high, recall that that numbers mean that any one time one in 20 of those people available for wanting, wanting to work and making active efforts to find work can’t find a job).

And what of wage increases?  Unsurprisingly perhaps, there has been little sign of any recovery nominal wage inflation.    A standard response is that wages will inevitably lag improvements in the labour market, but….the unemployment rate has now been falling slowly for five years or so.

There is a variety of different wage inflation measures.   Here are two from the Labour Cost Index –  both the headline published series, which tries to adjust for productivity growth, and the Analytical Unadjusted index which is more like a raw measure of wage inflation.   In both cases, I’ve shown the data for the private sector.

lci

Of course, if one believes this data (in particular the red line) there must have been some continuing productivity growth in New Zealand, even if at a slower rate than previously.  Quite why SNZ finds (implied) productivity growth here, and not in national accounts (real GDP per hour worked) is a bit of a mystery.

The other measure of wage increases if from the QES. In this case, the annual rate of increase in private sector ordinary time hourly wages.

qes-wages

There is some volatility in this series, and I’m not sure I’d want to put much at all on the reported sharp fall-off in hourly wage inflation over the last year, but…….there is certainly no sign of an increase in wage inflation.

It is always easy to look around and find countries that have done worse than New Zealand –  several of the euro area countries spring readily to mind.    But our performance, and the gains for our people, are nothing much to celebrate.  And while, for example, there has been a global slowdown in productivity growth since the mid 2000s, New Zealand’s productivity levels are so far below those of the more strongly performing OECD countries, that there was no necessary reason why we needed to share in the slowdown.  It should, if anything, have been an opportunity for some convergence.  But there has been no sign at all of that.

I don’t find that particularly surprising –  an economic strategy that appears to involve attracting ever more people to one of the most isolated corners on earth, in an era in which connections, contacts, and proximity seem to matter more than ever, all while producing a very high real exchange rate (again resurgent in recent weeks/months), and the highest real interest rates in the advanced world, is simply a recipe for continued long-term underperformance.  One would like to think that the government –  and the Opposition which seems to support very similar policies –  has been surprised. They can’t, surely, have planned on such a bad performance.  But persistent bad outcomes, of the sort New Zealand continues to see, should be prompting some serious policy rethinks, not just more PR about how rapidly employment numbers are growing.


Not many good tidings….

…in the productivity numbers that is.

Statistics New Zealand yesterday released the September quarter GDP data, including the revisions to the quarterly data that stem from the annual national accounts for the year to March 2016 that were published a few weeks ago.    Headline writers focused on the quite high rates of growth for the September quarter, while more sober observers allowed for the 2.1 per cent population growth in the last year and noted that in per capita terms real GDP growth remains pretty subdued.

I dug out the data to see if there had been any productivity growth.   As I’ve noted on several occasions, the labour productivity trend in recent years has been so weak it almost seems too bad to be true.  I wondered if the picture might look better with the new data.

In Australia, the ABS reports an index of real GDP per hour worked as one of the standard suite of published series.  In New Zealand, no such luck.  So I average the two measures of real GDP (expenditure and production) and divide by hours worked from the HLFS.  Unfortunately, Statistics New Zealand upgraded the HLFS earlier this year, and in the process introduced a break in the hours worked series.  There is a step up in hours worked that is partly on account of simply measuring things differently (and probably better).  Improvements in statistics are, of course, welcome but it is a little frustrating that the agency has made no effort to produce an official break-adjusted series.   In the June quarter, hours worked rose by 2.6 per cent.  As real GDP rose by 0.7 per cent, and there has been little sign of productivity growth in recent years, I’m going to assume in the charts that follow that 2 percentage points of that increase in hours was just a result of the change in methodology.  It won’t be quite right, but it doesn’t look likely to be seriously inaccurate either, especially against the measurement challenges and revisions we always face in looking at GDP/productivity.

So here is the resulting measure of real GDP per hour worked

real-gdp-phw-dec-16

And, even with the data updates, there is still no sign of any material productivity growth.  It has been 4.5 years now since this productivity index got to around the current level.

There was plenty of gloomy commentary around the recent Australian quarterly GDP outcome, but in productivity terms  even after a poor quarter (in a series with some noise), Australia continues to pull away from New Zealand.  Here are the two GDP per hour worked series, starting from 2007q4, just prior to the New Zealand (and global) recession and the Australian downturn.

real-gdp-per-hw-aus-and-nz

Our dismal productivity performance really should be getting more attention, and raising more concern, than it seems to.  But today isn’t the day for a long post on the underlying problems and possible solutions.

I’ll be taking something of a break.  There might be a few posts in the next few weeks, but something like a normal flow won’t resume until the week starting 30 January when the kids start going back to school.

In the meantime, in honour of Sunday’s Feast of the Incarnation (aka Christmas) I’ll leave you with this from John Milton’s poem

On the Morning of Christ’s Nativity
Compos’d 1629

I

This is the Month, and this the happy morn
Wherein the Son of Heav’ns eternal King,
Of wedded Maid, and Virgin Mother born,
Our great redemption from above did bring;
For so the holy sages once did sing,
That he our deadly forfeit should release,
And with his Father work us a perpetual peace.

II

That glorious Form, that Light unsufferable,
And that far-beaming blaze of Majesty,
Wherwith he wont at Heav’ns high Councel-Table,
To sit the midst of Trinal Unity,
He laid aside; and here with us to be,
Forsook the Courts of everlasting Day,
And chose with us a darksom House of mortal Clay.

III

Say Heav’nly Muse, shall not thy sacred vein
Afford a present to the Infant God?
Hast thou no vers, no hymn, or solemn strein,
To welcom him to this his new abode,
Now while the Heav’n by the Suns team untrod,
Hath took no print of the approching light,
And all the spangled host keep watch in squadrons bright?

IV

See how from far upon the Eastern rode
The Star-led Wisards haste with odours sweet:
O run, prevent them with thy humble ode,
And lay it lowly at his blessed feet;
Have thou the honour first, thy Lord to greet,
And joyn thy voice unto the Angel Quire,
From out his secret Altar toucht with hallow’d fire.

Not bucking the longer-term trends

I was belatedly reading the speech given earlier this month by the Governor of the Reserve Bank.  His speeches often have had a strong tinge of cheerleading for the government –  either highlighting the positive indicators ministers and the former Prime Minister liked to cite, or highlighting as areas for concern only those aspects that the government itself had been raising (thus, for example,doing things about improving housing supply is regularly mentioned, but never the option of cutting back on the medium-term target level of immigration).

This speech was a little different.    The Governor took the opportunity to note that the current recovery –  itself interrupted by a double-dip recession in 2010 –  has been the weakest (in terms of average GDP growth rates) in New Zealand for many decades.  Under a heading “labour productivity growth has been particularly weak”, he explicitly drew attention to the estimate that “New Zealand’s trend rate of labour productivity growth is in the bottom third of OECD countries”, and also noted just how weak growth in total factor productivity growth has been.  The dismal record should be quite a challenge both for the new Prime Minister and Minister of Finance, and for opposition parties thinking about the policy proposals they will campaign on in the next year’s election.

But the paragraph that caught my eye in the Governor’s speech was this one.

New Zealand’s household net savings rate improved by 8 percentage points in the period 2008 to 2013 (from minus 6 percent to positive 2 percent of household disposable income (figure 5)).  Over this period, New Zealand’s overall savings rate (ie including savings by the business and public sectors) increased by around 5 percentage points, and this has been an important factor behind the improvement in New Zealand’s ongoing current account deficit and the decline in net external liabilities as a share of GDP (this ratio has declined from 84 percent of GDP in 2009 to around 63 percent of GDP currently).

It prompted me to go and have a look at the recent annual national accounts data (which will have been released just after the Governor gave his speech).

It was the comment on the overall national savings rate that surprised me.   Here is a chart of the net national savings rate as a share of net national income.

net national savings.png

There has certainly been quite a rebound in the national savings rate since the recessionary trough in the year to March 2008, but it does look mostly cyclical.  The latest observation is around the same level we saw in the year to March 2005.   There isn’t any sign that overall savings rates in New Zealand, averaging across the cycle, are any higher than they have been on average in recent decades.

Here is a shorter span of history for the household savings rate (also as a share of NNI).

household savings.png

The trough in this series was the year to March 2003, just before the big housing boom of the 00s got underway.   There was quite a recovery in the last years of the economic boom and during the recession and immediate aftermath.  But the steady fall in the household savings rate over the last few years also suggests nothing very different from history.    If the current household savings rate is higher than the earlier troughs, at the same time the government savings rate is lower than it was then.

Here is the chart for the same period of government and private savings rates.  “Private” includes –  and is typically dominated by –  business saving.

govt and pte savings.png

For a variety of reasons, when government savings rate rise private savings rates tend to fall, and vice versa.  The really sustained recovery since 2007 has been in business savings –  a component of savings that is typically too little analysed.

The Governor’s comments focused on changes in the savings rate(s).  But the other side of the equation –  particularly as it affects the interpretation of the current account –  is investment.

Here is the long-term chart of investment (national accounts definition –  gross fixed capital formation) as a share of GDP.

gfcf dec 16.png

Again, as I’ve illustrated previously, we’ve had a cyclical rebound in investment rates.  But it isn’t an impressive rebound.  The latest observation –  this in an economy which the Bank thinks has perhaps a small positive output gap – is well below the peaks in 1976 and 1986, and around the same level as the peak in 1996.   The economy went into the 1990s recovery with a massive overhang of commercial property, so it perhaps wasn’t surprising that overall investment didn’t surge to really high levels.  By contrast, in this cycle earthquakes destroyed quite a lot of commercial, residential and government capital stock –  necessitating a lot of gross fixed capital formation just to restore the capital stock to what it was pre-earthquakes.

In many other OECD economies, a gradual decline in the investment share of GDP over time wouldn’t seem odd, as the population growth rates have been trending downwards.  In many cases those countries now have flat or slightly falling populations, and just don’t need as much new investment to maintain capital/output ratios.    But that isn’t the story of New Zealand.  Over the period of that GFCF chart there has been no trend decline in New Zealand’s population growth and in the last year or two, our population has grown as rapidly as at any time since the 1950s.  This chart is a few quarters old, but it illustrates the point.

world-population-growth

I wouldn’t want to make very much of the narrowing in the NIIP position.  Again, the Governor referred to a trough in 2009 and compared it to the current position.  But the NIIP position tends to cycle, and over 25 years there hasn’t been much change in the trend level.

But if anything, one could run a slightly contrarian position that a better-performing New Zealand economy over the last few years –  one where more firms wanted to invest more –  the current account deficit would have been wider and the negative NIIP position somewhat larger.  Overall, weak investment looks to be a symptom of weak demand –  both domestic and external.  Firms simply haven’t seen many great opportunities for investment and so, even with all the rebuild and repair work, overall investment levels have been pretty subdued.

And it isn’t as if the economy has been fully employed during that period.  The Governor notes in his speech that the unemployment rate is below the 20 year average. But it is above official estimates of the NAIRU and has been for eight years now.  It isn’t as if there has been an inflation problem either: core inflation has been below target for years now.  And the exchange rate has been extraordinarily high.

There are limits to what monetary policy can do, but stimulating demand –  all else equal –  is what it can do; in fact, it is the reason why we have discretionary monetary policy at all.    The data –  current account, investment rate, as well as the inflation and unemployment rates –  suggest that monetary policy should have been doing more over the last few years.  That it hasn’t is a choice the Governor has made, but having made those choices –  consistently mistaken in my view –  he shouldn’t be trying to sell as a virtue one of the key symptoms of the persistent weakness of demand.

Eight (more) wasted years

Perhaps nothing became John Key more than the manner of his departure.  Tired –  “nothing left in the tank” –  and admirably unwilling to go into an election year and lie about his willingness to serve another full term, or to just struggle on, he chose to walk away instead.

It is rare for political leaders to leave voluntarily when they are well, undefeated, and not facing any serious internal challenge.  Harold Wilson (in the UK) and Calvin Coolidge are two who spring to mind.    Enoch Powell’s maxim was that

“All political lives, unless they are cut off in midstream at a happy juncture, end in failure, because that is the nature of politics and of human affairs.”

John F Kennedy and Norman Kirk were examples of leaders cut off in their prime, and reputations shaped for decades by the combination of their short time in office and the unexpected early deaths.

At one level, John Key’s political career won’t have ended in failure.  He remained popular and had had a pretty good chance of leading his party to a fourth term in government next year.  But at another level, so what?  If almost all political careers end in failure, in Powell’s terms,  that includes the careers of many very great men and women.  For each of Bob Hawke, Paul Keating, and John Howard, their careers ended in failure and defeat, but it doesn’t change what they had accomplished over the course of their careers.  The same could be said for Margaret Thatcher, Winston Churchill or Charles de Gaulle.  I might even include Tony Blair and Gordon Brown in such a list.  They left having made a difference. I’m not sure that same can be said of John Key.

There were three election victories, to be sure.  But here are the centre-right (National +ACT) vote shares for those three elections.

2008 48.58 per cent
2011 48.38 per cent
2014 47.73 per cent

Only at the 2008 election did those two parties together have a clear electoral majority (they obtained a tiny majority in 2014, and lost it shortly afterwards in the Northland by-election).   Those vote shares – and those of the National Party alone –  look very impressive in an FPP context, but those weren’t the rules Key was operating under.  Throughout his term he had either small majorities or a minority-government position.  Passing any contentious legislation required cobbling together the numbers among minority parties, and partly for that reason not much contentious was actually done.

In his 1975 election campaign, the then Opposition leader Robert Muldoon stated that if his party was elected his goal was to leave the country no worse than he found it.   That wasn’t how John Key articulated his vision.  In his campaign opening address in 2008 he talked about serious change.

You are looking for a Government that will focus on the issues that matter to you – a Government with a plan for economic recovery, and a Government with fresh ideas and the energy to meet the challenges this country faces.

At this election National is offering exactly that.

I am campaigning on strengthening our economy, on rising to the challenge presented by tough global conditions, and on delivering greater prosperity to New Zealanders and their families

Of Labour’s economic performance he said

It’s a shocking record, and Helen Clark and Michael Cullen should be judged by it.

Promising something different

National’s plan faces the fact that we must lift productivity in this country.

Labour has a dreadful record on productivity and National will do better. ……Labour won’t do that. End of story.

Third, National’s plan recognises that lifting productivity also means removing the bottlenecks in the economy – the roading problems and the creaky communications networks that are holding business back. That’s why National will fix the Resource Management Act and that’s why we’ll invest more in the infrastructure the economy needs to grow.

Fourth, lifting productivity also means encouraging businesses to invest.

The guys in red like to talk about this idea. But let me tell you something. I’ve had a bit more to do with business than them and it’s actually more straightforward than they think.

The number 1 reason that private companies invest is because they are profitable and feeling positive about the future. All the R&D credits in the world won’t cut it if companies aren’t making any money. We have to get the fundamentals right first.

And

…we must grow our economy faster.

I know we can do it.

You want to know why? Because I’ve actually worked in the world of finance and business. Helen Clark hasn’t. I’ve actually picked up a struggling business and made it grow. Helen Clark never has. And I’ve actually got stuck into a business, trimmed its sails, and delivered some profits to its shareholders.

And that’s what I am determined to do for this country.

I was always a bit of a sceptic on John Key, but during that election campaign –  in the middle of a recession and with the international financial crises as backdrop – the aspirations  he spoke of occasionally resonated.  The National Party has now taken down the link to the economic speech Key gave just a few days before the 2008 election but –  naive as I perhaps was –  I actually found this passage quite inspiring, and had it pinned above my desk at The Treasury for the following year or two.

I came into politics because I believed New Zealand was underperforming economically as a country. I don’t think it’s good enough that so many New Zealanders feel forced to leave our country each year to seek higher wages in Australia. I don’t think it’s good enough that our average incomes lag so far behind the rest of the world. And I think it’s unforgivable that the Labour Party has done so little to address these fundamental challenges.

I believe that a very big step change is needed in our economic performance to ensure New Zealand can make the most of its considerable potential. Growing the economy of this country continues to be my driving ambition. I stand before you today ready to deliver on that ambition for New Zealand.

You have my personal commitment that if I am elected Prime Minister in eight days’ time I will work tirelessly over the next three years to deliver the stronger economic future our country deserves.

I don’t doubt that he has worked tirelessly over the last eight years, but to what end?

There has been no “very big step change” in our economic performance.  What is worse perhaps, there has been no serious attempt to bring about such a change.   The 2025 Taskforce’s prescription was dismissed –  from some Caribbean island where the Prime Minister was –  the night before its report was released.  And if he didn’t like that prescription there was no sign of any energy being put into finding a package of measures he really believed would make a difference.  Worse still has been the sheer dishonesty of the last few years in which the Prime Minister repeatedly asserts that New Zealand is doing very well by international standards, and is somehow the envy of the advanced world.  Only a few months ago we had the nonsensical claims that he was remaking New Zealand as the Switzerland of the South Pacific, or the frankly rather offensive proposition (to all those struggling in that market) that Auckland house prices were just what one expects in a successful global city –  when all the time, Auckland’s GDP per capita has been falling relative to that in the rest of the country (and when the government knows it has been making little or no progress in freeing up land use restrictions).  And for all the talk of international connections etc, there has been no nationwide productivity growth in the last few years, and exports as a share of GDP are, if anything, a bit lower now than they were in 2008.

Of course, over eight years in office almost any government is going to do some worthwhile things.  When Malcolm Turnbull last year talked to wanting to emulate the Key reform programme, I managed a brief list of worthwhile reforms.

But on the other hand, I noted this list

  • Higher effective corporate tax rates
  • The debacle of the earthquake-strengthening legislation
  • The continuing debasement of our skills-based immigration system, both in the way it is administered and in formal announced policy.
  • New overlays of financial market regulation
  • The re-establishment of direct government controls over who banks can and cannot lend to
  • The continuation of a regime of “corporate welfare”, including for example the Sky and Tiwai Point deals, and the smell that the Saudi sheep deal gives off
  • The degree of central government control of the Christchurch repair project, involving both wasteful projects (some of which may not finally go ahead), and the way central government has artificially boosted land prices and impeded the prompt redevelopment of the central city.
  • The continuing apparent decline in the rigour of public sector policy advice, and in the use of robust cost-benefit analyses in underpinning policy decisions.
  • Increased first home buyer subsidies.
  • Undermining housing affordability with mandatory insulation etc requirements for rental properties
  • Continuing increases in minimum wages, from very high levels (relative to median wages) at a time when unemployment is quite high, and policy was supposedly oriented to getting people off welfare.
  • Heavy investment in the newly state-repurchased loss-making Kiwirail

As Eric Crampton notes, the new government regulations that killed off ipredict now mean we don’t even have functioning predictions markets to follow in the wake of the Prime Minister’s resignation.

Of course, some credit is due to the government for returning the budget to balance, or even modest surplus.  It isn’t a trivial achievement, especially against the backdrop of the Canterbury earthquakes, but equally when you have benefited from (a) high terms of trade, (b) low interest rates, (c) rapid population growth which in the short-term tends to raised government revenue more than expenditure, and (d) unexpectedly slow wage inflation, and (e) some very big spending programmes from the outgoing previous government that had not yet become firmly entrenched, it was all a little easier than it might otherwise have been.  And important as maintaining fiscal balance is, it isn’t the sort of structural reform that generates the very big step changes in economic performance that John Key talked of.

The Prime Minister would also no doubt note the reduced outflow of New Zealanders to Australia.     As I’ve noted here previously, there is a lot of year-to-year volatility in those figures, but the average outflow  of New Zealanders has been lower over his term than over the nine years of the Clark-Cullen government.   That would have been encouraging if a reflected a sustained narrowing in the income/productivity gaps between New Zealand and Australia.  As it is, it seems to reflect higher unemployment rates in Australia and a recognition that the position of New Zealanders moving to Australia isn’t alwasy very secure if things don’t turn out well.  As for productivity, those gaps have only continued to widen over the Key years (and especially the last few years).

gdp-phw-nz-vs-aus

Of course, relative to other advanced countries the years since 2008 have not been especially bad in New Zealand.  There have been plenty of countries that have done worse, and plenty that have done better.  We’ve been middling at best and that is probably about the least we should have expected as –  through some mix of good management or good luck –  our incoming government in 2008 inherited neither a fiscal nor a financial crisis.

I haven’t touched much on the  debacle that is the housing market.  It didn’t feature in that 2008 campaign  launch – probably house prices were falling at that point of the recession. But in many parts of the country – including our largest city – the issues of unaffordability are so much worse now than they were then. Turning around our long-term productivity performance might seem really hard. Doing something effective to reverse the inexorable climb in real house prices just wouldn’t have been that hard – between land use law reforms, and easing back on the immigration-led population pressures until new policy frameworks left the housing market better able to cope. But, in fact, there has been almost no serious reform, and a generation of young families are increasingly shut out of home ownership. It is inexcusable. And perhaps the worst of it is that there was never any sign that the government was willing to go down fighting, to spend serious political capital – and perhaps to fail in the attempt nonetheless – to make a real difference. That isn’t leadership. At best it is followership.

I could go on.  About, for example, the suspension of property rights following the earthquakes, about the weak regard for the institutions of our democracy, or –  mundanely –  about the fiscal and moral failure that the big increase in (already high) prisoner numbers over the term of this government represents.  But I’m sure you get the drift.  It has been eight largely wasted years –  building on at least the previous nine largely wasted years –  in which none of the big structural economic challenges New Zealand  faced has been even seriously addressed.  On not one of them can the government show serious progress and on some –  house prices most noticeably –  things are now even worse than they were in November 2008 when John Key spoke of his goal of securing a very big step change in economic performance.  He has held office, and left at a time of his own choosing.  But to what end?  In that sense, surely, his political career ends in a failure much more indelible than that  of a mere electoral defeat or internal coup.

The Productivity Commission’s story

Some months ago I ran a post about some of various attempts to explain New Zealand’s decades-long relative economic decline, and to propose remedies that might reverse this performance.  The first major piece along these lines that I’m aware of was by the Monetary and Economic Council in 1962.  Since that was the year I was born, and economic outcomes now, relative to those in other countries, are worse now than they were then, despite all the various policy reforms and all the ink spilt in trying to make sense of the situation, I find that all rather depressing.  A lifetime, and more, of relative economic decline.

In that earlier post I noted that the Productivity Commission, or more particularly its Director of Economics and Research, Paul Conway, had been at work for some time on a “narrative” of New Zealand’s economic underperformance, offering some combination of diagnosis and prescription.      Earlier versions have been presented at various conferences and seminars here and abroad, and this week the finished product was released.  (In the interests of full disclosure, I should note that the Commission paid me to provide some comments and suggestions on a relatively advanced draft of the paper, imposing no  restrictions on me writing about the finished product.)

The paper, Achieving New Zealand’s Productivity Potential, is issued under Paul Conway’s name.  There is no disclaimer, of the sort often seen on public sector agency research, that the paper represents only the views of the author and not necessarily those of the institution.  I asked Paul about the status of the paper, and he suggested that my description, that it was his paper but that the Commission was “not unhappy with the content”, sounded about right.

The paper is well worth reading, and should be read by anyone with a serious interest in these sorts of issues.    It should be reasonably accessible for most potential readers, and –  at least by Productivity Commission standards – at 80 pages it is quite short.    There are lots of interesting charts, and a variety of interesting issues/possibilities are dealt with (including some of the arguments I’ve been raising).  It is a balanced and fair-minded report, and a really useful contribution to the debate that needs to be had.   Even if the Prime Minister apparently no longer cares much about it – the recent statistics are just too bad for political comfort – productivity growth is the basis of any future long-term prosperity prospects.

The paper isn’t the last word on the issue by any means.  That isn’t just meant as an observation that I disagree with some of it.  As Conway notes, there are many issues where not enough research has been done, whether by academics, core policy agencies, or bodies such as the Commission.  Some of the paper is inevitably a bit speculative.  One goal of the paper might be to stimulate further debate, and prompt a demand for more serious research in a number of areas.

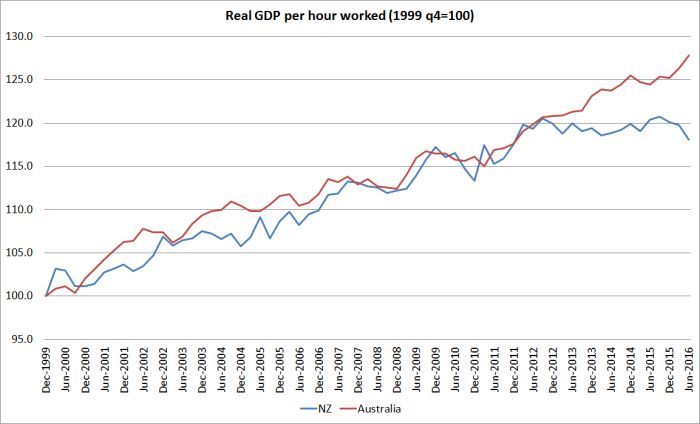
The Commission appears to be keen to be read by the government and its acolytes.  That is perhaps understandable –  only this week, the Prime Minister was dismissing out of hand theTreasury’s long-term fiscal projections, and much the same fate befell the 2025 Taskforce a few years ago.  But on my reading, the desire to not immediately lose all readers from the current government has led them to over-egg the pudding in a few places, in writing up the story of the last few years.  It isn’t central to the story, but the suggestion that New Zealand has materially closed the income gap to other advanced countries in recent years just isn’t supported by robust data, and praise for the Business Growth Agenda and regulatory reform both seem to go beyond the substance of what has been achieved.   There is at least an arguable case that the quality of regulation has deterioriated further in recent years.  Where it counts –  productivity –  at best New Zealand has not lost more ground relative to other OECD countries in the last decade or so. But the large gaps simply aren’t closing.

Even though he began his career at the Reserve Bank, these days Conway’s focus has tended to be on microeconomic issues, and often on firm-level research.  New Zealand is particularly well-positioned for such research, because of the creation by Statistics New Zealand of the Longitudinal Business Database, which enables (a small tightly controlled group of) researchers to conduct studies using anonymised detailed data on individual businesses.  Various researchers, at Treasury, Motu, the Commission etc, have produced a series of interesting papers looking at various aspects of firm behaviour in New Zealand.  Some more results in that vein are included in Conway’s narrative paper.  Indeed, this firm-level approach dominates the early part of the paper –  he argues that “this approach puts firms at the centre of the analysis”.

Interesting as the results of these papers often are, I’m less convinced that the firm level analysis is very helpful for understanding long-term trends in overall economic (and productivity performance).  Some of that may just be about short runs of available data.  Thus, the paper begins with some international evidence about the differential labour productivity performance of leading and laggard firms over the last 15 years or so.  There is a big difference.   The Commission produces some evidence suggesting something similar for multi-factor productivity in New Zealand.  But fascinating as that is, we have no way of knowing whether it is normal behaviour, or whether something unusual and new has been going on in the last 15 years.  And, at least on this score, we don’t even know whether New Zealand has been doing more or less well than other advanced countries, even over this relatively short period.  My concern has been that the availability of the data –  itself a wonderful thing –  is shaping the research agenda more than is really warranted.   Perhaps that is inevitable –  researchers will follow data, as water flows downhill –  but even if so, we need to recognise that the questions that data can help answer aren’t necessarily the ones policymakers should be most concerned with.

None of this is to suggest that firms aren’t important.  Most market economic activity takes place in firms.  But firms, and managers and workers within them, respond to incentives, and should typically be presumed to do so in a rational way, that best serves their own interests.    That includes choices to enter the market, to expand or cut back, or to leave it.  Or simply never to set up at all.    After the 50 or so years of our relative decline, it is likely that the structure of our economy, and the firms within it, look quite different than if a more successful path had been found.  And firm-level analysis simply can’t look at the firms that never came into being –  the exporting firms, for example, that might have developed if repeated aspirations to lift the export share of GDP (as in most other advanced countries) had been met.  So, it isn’t entirely clear to me what we learn, that sheds light on overall productivity performance, from an analysis of the firms that happen to be here now. The firm level data, for example, suggest that the labour productivity performance of our leading firms is perhaps 30 per cent below that of advanced country peers.  But that is, surely, just what we would expect.  GDP per capita is –  roughly –  30 per cent below that in many other advanced countries, and firms (and workers) will adjust so that, at the margin, resources earn their marginal product.  Production structures will, typically, look different in poorer countries than in richer ones.

And so one of my criticisms of the Conway/NZPC paper is that while it is strong on highlighting symptoms, it is much weaker on analysing and understanding incentives (eg the reasons why firms, and governments, behave as they do).  There is a tendency in the firm-level literature to treat firms as the cause of the problems –  firms don’t invest enough in R&D, aren’t very good at management or what ever –  without taking as a prior (perhaps to be tested) that individual firms and the people within them typically make decisions that appear rational, and indeed (on average) optimal for themselves.  There is sometimes a sense that if only firms were as smart as the researchers studying them, the problems would be solved.  The Conway paper largely avoids that tone, but it is still weak on the incentives/opportunities issue.    If, as one study suggests, New Zealand firms’ management capabilities really are weak –  on some measure –  why has that happened?  What makes it rational for firms to ‘under-invest” in such capability?  Is it, perhaps, that what counts as high level capability in these surveys is, in fact, more of a luxury consumption product, that tends to accompany –  rather than independently cause –  economic success?  I’ve previously posed similar questions about R&D.   My own story –  unproven – tends to be that firms would be likely to invest more in (genuine, not just classified for tax purposes) R&D, if the overall business environment (expected returns) were less unfavourable.  Similarly, business investment in New Zealand (especially that in the tradables sector) probably isn’t low because businesses are badly run, or because business people are failing in some duty to their country, but because the expected risk-adjusted returns to much higher levels of investment just haven’t been there.

Another concern about the paper is that, for all the interesting paragraphs (and charts), I still came away from it uncertain quite how the author (or the Commission) would summarise the story.  For example, as between the various firm-level “failures” and the big picture macro environment issues,  there is no overall summary that gives me a good sense of which issues they think were really important, and which are rather less so, in explaining how we got to the poor outcomes we have today.  The same is true of the way ahead: what initiatives have the potential to make a real and substantial difference and which, while perhaps nice to have, probably don’t matter that much.   I suspect there is still a tension in the author’s own mind.  His own micro-orientation comes through strongly in the final paragraph of the whole paper.

The broad policy considerations for lifting productivity offered in the paper highlight the importance of regulation that promotes knowledge diffusion into and throughout the economy and increased competition to improve resource allocation. Synergistic investment in skills, innovation and organisational know-how (including managerial capability) and other forms of KBC [knowledge-based capital] are also important. Flexibility, openness and receptiveness to new technology are also key and carry important implications across a range of policy areas.

This is a quite different tone than comes through at the start of the document (Foreword, Key Points, and Introduction).  But more importantly, it has a strong whiff of “more of the same”, even though Conway reproduces the OECD’s chart that suggests that on a standard OECD set of micro-structural policies, New Zealand should already be much richer and more productive than it is.     And it doesn’t really engage at all with the sense in the second half of the paper (which I think the author comes to perhaps rather late and a little grudgingly, or which he perhaps just struggles to fit with his firm-based focus) that macroeconomic conditions –  whatever has caused persistently high real interest rates in particular –  may, in fact, be a material part of the overall story of why the economy has systematically skewed away from growth in the tradables sector, and why it has managed such weak overall productivity growth for such a long time.

In fact, Conway comes a long way towards the view I have been espousing in recent years that the best explanation for persistently high real interest rates (relative to those abroad), which best fits other relevant stylised facts such as the persistently strong exchange rate, is a series of (insufficiently recognised/understood) demand shocks (see discussion on pages 39 and 40).  He also recognises the likely connection between these persistently, and unexpectedly, high real interest rates and the way in which the real exchange rate has stayed high, even though productivity differentials have suggested that we should have seen a material depreciation in the real exchange rate.   Nonetheless, when it comes to discussing the overall economic performance, and particularly the policy path forward, the real exchange rate tends to get only passing mention.  By contrast, I think it is likely to be central to the story.  It is a key part of the business environment that firms considering establishing or investing here have to take into account, and over which they have no control.

For my money, Conway also underemphasis the importance of New Zealand’s extreme geographic isolation.  He notes OECD research that suggests distance represents perhaps a 10 per cent penalty on New Zealand’s GDP per capita, and recognises that –  in some ways counterintuitively –  distance may, if anything, be more of problem/constraint now, especially in knowledge-based industries, than it was in decades gone by.  But I suspect he doesn’t take the issue sufficiently seriously.  On my reading of the paper, most of it would be almost exactly the same if New Zealand was conveniently located in the Bay of Biscay, rather than in a remote corner of the South Pacific, distant from markets, suppliers, key networks etc.  The continuing natural resource base of the overwhelming bulk of our exports doesn’t get a mention either, even though it might raise questions about whether New Zealand is a natural place to put ever more people –  ever more people exposed to the “tax” of distance –  if we hope to generate top tier first world living standards for New Zealanders.

Perhaps somewhat relatedly, there is a lot of discussion in various places of the potential challenges, including for individual firms, that being a small country –  a quite different point from being a distant one –  might involve.  Small domestic markets, and the inevitable limits on the amount of competition in, eg, domestic services markets are real factors facing people considering investing here.  And yet, it was puzzling that throughout the paper there were very few systematic comparisons across small advanced economies.  After all, evidence tends to suggests that small countries have not, in fact, achieved less productivity growth than large ones.  And it is a well-known stylised fact that small countries engage in much more international trade (exports and imports) than large ones do.  Thus, while a firm in a small country might face the “need” to move into exporting earlier than a peer in Japan or the USA might, and face hurdles in doing so, actually the evidence suggests that they do it, and do so in ways that, taken together, generate high incomes and high levels productivity for their home nations.  On my read, being a distant country is a problem –  and one we can do nothing to change –  but being a small country isn’t.  Keeping on trying to become a slightly bigger, still very distant, country doesn’t look like a path to success.  If, in fact, it is, the case isn’t made in the Conway/NZPC paper.

In fact, on that score, I was pleasantly surprised by where the author has got to on immigration policy.   My impression is that his bias, and that of the Commission, would naturally tend towards favouring non-citizen immigration –  it is, after all, fairly standard OECD orthodoxy.  But, as I have consistently argued, the issue has never been a high-level issues of first principles –  at some times and in some places, immigration may benefit all those involved, movers and natives – but one that requires a specific assessment in the New Zealand context.

But as Conway notes

It is difficult to conclusively assess the impacts of migration on the economy.

On the demand side

More broadly, and as discussed in Section 4, Reddell (2013) argues that demand-side pressures driven by strong migration inflows are part of the reason for high real interest and exchange rates in the economy, which supress investment and encourage resources into the low-productivity non-tradables part of the economy.

While

On the supply side, migration may generate small productivity increases via agglomeration.

Note the “may” and “small”

And

A supply of high-skilled migrants may also lift productivity in other ways, including improvements in the skill composition of the labour market, diversity effects and knowledge transfer.

And while they note that, relative to other OECD countries, our immigrants aren’t that lowly-skilled, the picture isn’t all rosy either

Recent evidence from the OECD’s Survey of Adult Skills shows that the skill level of the total overseas-born population in New Zealand is higher than for the overseas-born population of any other OECD country (Figure 5.8). This indicates that the migration system has done comparatively well at attracting high-skilled migrants. However, migrant skills are still lower than the skills of the New Zealand-born population, suggesting that migration inflows may be part of the reason for small decreases in the average quality of workers outlined in Section 3.

(Note that, as I have written about previously, the same OECD survey shows that our native workers are among the most highly-skilled in the OECD.)

Before concluding

Although up-to-date research on the impact of migration on employment and wages is lacking, it is possible that recent inflows of low-skilled migrants have restricted wage growth and the employment of low-skilled New Zealanders. In turn, this would encourage a reliance on cheap labour by some firms and industries. In conjunction with any macroeconomic effects on real interest and exchange rates, this may suppress investment and productivity improvements, and work against efforts to increase the employment of lower-skilled New Zealanders.

The Government’s objectives around migration for labour market purposes should be clearly focused on improving the skill composition of the workforce to improve international connection and the flow of new technology into the economy. New Zealand is currently a very attractive destination internationally and policy needs to use that advantage to target very highly skilled and well-connected migrants. Any reduction in the total number of migrants coming to New Zealand as a result of this sharper focus may help address New Zealand’s macro imbalances outlined in Section 4.

I couldn’t really disagree  (but anyone who read only the Key Points or the Conclusion wouldn’t have sensed that there might be an issue in this area).

One last substantial issue also relates to labour.  For a couple of decades now, at least since the labour market liberalisation in the early 1990s, there has been a story put around that perhaps our labour productivity growth (and MFP?) was lagging because we had put in place highly flexible labour markets which were able to absorb many people (typically lower productivity people) who would simply miss out on jobs in many other countries.  If so, society as a whole might be better off, even if measured average productivity was a bit lower than it might otherwise be.  There is quite a bit of that sort of flavour in the Conway/NZPC paper.  Indeed, it even pops up in the call-to-action Conclusion of the entire paper.

The paper argues that New Zealand needs to shift from a development model based on increasing hours worked per capita to one in which productivity growth plays a more important role in driving growth in GDP and incomes per capita.

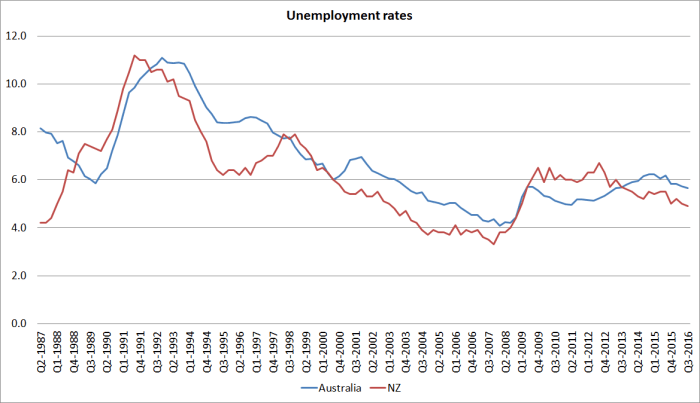
It is certainly true that average hours worked per capita are higher than in the median OECD country.  And employment as a share of the adult population is higher here than in the median OECD country too.  But that was true decades ago too.  Our HLFS data only go back to 1986, but that isn’t such a bad starting point –  it was before the bulk of the reforms of the late 80s and early 90s had taken effect, and before the very large, but temporary, disinflation and structural change increase in the unemployment rate occurred.    In fact, New Zealand’s unemployment rate in 1986 (4.2 per cent) wasn’t much lower than the current unemployment rate.

But how do we compare against OECD countries?

employment-oecd

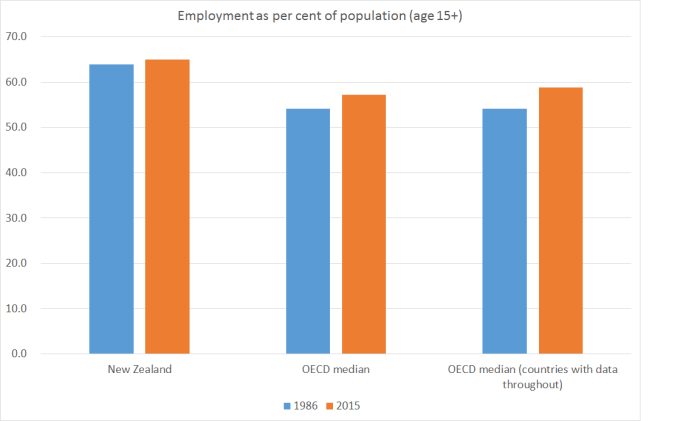
Our employment rate has increased slightly over the 29 years to 2015, but  the median employment rate in other OECD countries has increased a little more than that in New Zealand.  Increased labour participation/employment rates cannot be part of the explanation for why over that same period we have continued to lose ground against other advanced countries, whether one looks at GDP per hour worked or at total factor productivity.    And while it is hypothetically possible that the high level of the employment rate might be depressing the level of productivity, it is worth remembering that the three OECD countries with higher employment rates than New Zealand (Iceland, Sweden, Switzerland) also have higher GDP per capita and GDP per hour worked than New Zealand does.

There are plenty of other aspects of the paper I could write about, and I could touch on some of those here in more depth.  One or two I might come back to next week.  But to close, I would note that I was struck by this line from the final paragraph

With low productivity so entrenched in New Zealand, lifting this presents a monumental challenge for policymakers, business owners and workers.

Unlike most of the rest of the paper, it presents business owners and workers as part of the problem.  But I don’t think the paper offers any evidence to that effect.  Instead, we should generally assume that business owners and workers respond rationally to incentives, and to the climate they face.    Governments shape so much of that climate.    On my telling, governments have (perhaps unintentionally) consistently skewed the economy away from paths that could have allowed much better productivity and GDP per capita outcomes.

The issues are important and the paper is a valuable contribution.  I encourage people to read it, and hope it stimulates some more debate on how New Zealand might best, in the paper’s closing words, achieve its productivity potential.
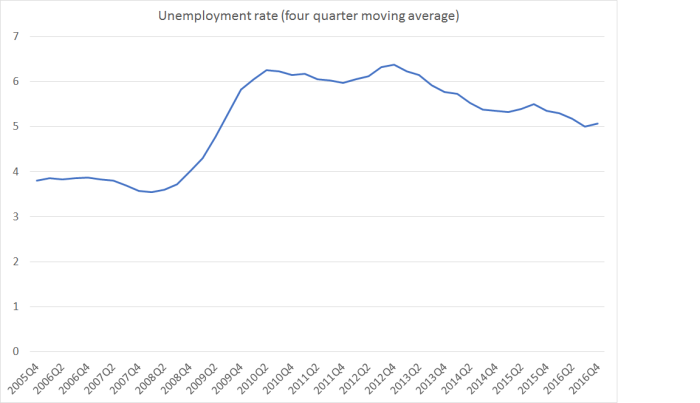
 

Weak productivity growth: can composition effects explain it?

One of the charts I’ve run a few times in the last few months has had a bit of extra coverage in the last few days.

real-gdp-phw-to-q2-2016

It is a pretty straightforward chart (although it would be a little easier if SNZ followed the practice of the ABS and reported the series routinely, rather than leaving it for people to calculate).  I simply averaged the expenditure and production measures of real GDP, and divided the results by the total number of hours worked (from the HLFS).  And real GDP per hour worked itself is a pretty standard measure of labour productivity.

The interest, of course, has been in the now four years or so of no growth in labour productivity.  On the face of it, it is a pretty poor performance and tends to act as something of a counterpoint to a focus by the government (and its business and media cheerleaders) on headline GDP numbers –  which are high largely because the population has been growing so rapidly, rather than because resources are being used more productively.  Productivity is, in the long run, almost everything when it comes to improving material living standards.

I would add a few caveats around the chart, some of which I’ve made here before.  The first is that the very final observation should be heavily discounted or ignored.  SNZ introduced a revised HLFS methodology in June, which has resulted in a step up in the number of hours recorded (perhaps by around 1 to 1.5 percentage points).  At some point that might be reflected in a slightly higher level of GDP, but for the moment there is just an inconsistency.  (And, of course, there is always some quarter to quarter volatility in the data too.)

The second caveat is the old warning that when a number looks particularly interesting it might well be wrong.  Four years of no productivity growth at all is not unprecedented here or abroad (on current data, for example, GDP per hour worked in the UK now is only around 2007 levels) but….these series are prone to revision, and while they could be revised either up or down, it shouldn’t greatly surprise us if the picture for 2012 to 2016 looks a bit different when we review the data a few years hence.

The big revisions tend to happen as a result of the annual national accounts.  Statistics New Zealand gets a lot more detailed data, produces full annual data once a year (including revisions to earlier years), and then updates the quarterly series that have already been published.  The annual data for the year to March 2016 are out later this month, and the revised quarterlies will presumably be available with the September quarter GDP release next month.  Expect changes (including in the chart above).

But for now, the data is as it is.  Bernard Hickey gave the chart some prominence, with the editorial comment “We’re just pumping more low wage workers in the economy and working more hours”, and observing “Jobs soaked up by net migration & more >65 yrs working”

That prompted Eric Crampton of the New Zealand Initiative, writing on his Offsetting Behaviour blog,  to produce a post asking whether compositional changes in the labour force might account for some or all of the weak productivity growth in recent years.  As he quite rightly notes, if a lot of very unskilled people started working lots more hours (in total), while higher skilled people worked the same number of hours, at the same real output, average real GDP per hour worked would fall even though no one individually was less productive.

First, Eric noted that the number of people on welfare benefits has fallen quite a bit over the last few years.  If –  as seems reasonable –  those people had been of below average productivity, that might tend to lower overall productivity somewhat.

But here is my problem with that story.

working-age-benefits

Working age beneficiary numbers have certainly fallen over the last few years, but they rose a lot during the recession.  There is seasonality in the data so I’ve only shown one observation per annum (June), but in June this year the share of the population of working age on welfare benefits was almost exactly equal to the share as the recession was getting underway in 2008.  People moving on and off benefits might affect average labour productivity to some extent, but absent any sign of an upward surge in productivity over, say, 2008 to 2010 it is difficult to believe this effect explains much of the recent absence of productivity growth.  (And, of course, the decline in beneficiary numbers doesn’t appear to have been in the faster than in the five years leading up to 2008).

Eric also includes a graph showing changing employment rates for different age cohorts, observing

The youngest workers are least productive. They hugely dropped out of the labour market with the changes to the youth minimum wage, but that decline’s since reversed a bit. There’s been a long trend growth in hours worked among older workers, but typical wage patterns over the lifecycle have wages flattening out from the early 50s or thereabouts. Big increases in employment rates among cohorts with lower than average productivity, or at points in the life cycle where wage profiles (and presumably productivity) flatten out, will both flatten or worsen GDP per hour worked.

What to make of that?  Here is a chart of the changes in employment rates for each age group, both since 2012 (when productivity seems to have gone sideways) and since 2007, just before the last recession –  and it isn’t a misprint/error; we’ve had no change in the employment rate over the full period from 2007 to 2016.

employment-rates-by-age

Over the last four years, the least productive age group (15 to 24) had the largest increase in employment rates,  and the 65+ employment rate has kept on growing quite a bit.  But….employment rates for 25 to 44 years olds increased quite a lot too (more than the over 65s).    And if we take the full period (Sept 07 to Sept 16), we’ve had a big drop in the employment rate for the lowest productivity age group.  That fall was, of course, concentrated in the first half of the period, but there was no obvious corresponding surge in average productivity at that time (granting that one never knows the c0unterfactual).

And by New Zealand standards, there is nothing very obviously unusual going in the 65+ employment rates.  Between 2007 and 2016 the 65+ employment rate rose by 8.7 percentage points. In the previous nine years, it has risen by 8.1 percentage points.

Perhaps one could dig deeper (if the data existed) and the impression might change, but it isn’t obvious that the changing age composition of the workforce can explain four years of no labour productivity growth.

Sometimes people suggest that perhaps our labour market is performing so much better than those of other advanced countries which might in turn explain the poor productivity growth.   But here is a chart showing employment rates for New Zealand, Australia, and the median OECD country.

oecd-empl-rates

There might be something in the story relative to Australia over the last few years.  But comparing New Zealand with the OECD median, our employment rate fell about as much as that median did during the recession, and has rebounded only slightly more since.  Compare New Zealand and the typical employment rate just prior to the recession and almost half of OECD countries have had more of an increase than (the slight rise) New Zealand has had.

Eric also suggests that we need to think about the role of immigration

And, obviously, net migration’s increased over the last few years. New workers getting settled in New Zealand might take a bit to find their feet as well, while still being better off than they were before.

Just two thoughts.  First, around half the huge swing upwards in net inward migration has been the result of the sharp decline in the number of New Zealanders leaving.  They won’t have taken “a bit of time to find their feet”.    Second, for the other migrants, there might be something to the story (although there hasn’t been much variability in the number of actual residence approvals) through, for example, the increased number of foreign students working and people on working holiday visas.  But….the New Zealand Initiative and other business lobby groups can’t really have it both ways. They often tell us it is imperative that we have the sort of immigration policy we have now, because (for example) New Zealanders just can’t, or won’t, do the work (at a price firms can afford). There is a strong hint in that sort of argumentation that immigrants are on average actually quite highly productive relative to natives (even though the data show that for most immigrant groups it can take decades for the earnings to reach those of similarly qualified, similarly experienced New Zealanders).

I wouldn’t rule out the possibility that the compositional effects resulting from immigration are part of the explanation for the latest productivity slowdown (although we didn’t see something similar when Australia had its huge surge) but….if the Initiative is right about the general economic payoff to high immigration, we should be expecting a pretty big lift in average labour productivity (the more so to make up for four years of no growth) really quite soon.

One other lens on the composition issue is offered by our own official annual productivity data (for the “measured sector” rather than for the whole economy).   SNZ produces both labour productivity and multi-factor productivity estimates, and they also produce both series using both total hours worked and an estimate that attempts to adjust for the changing composition of the labour force.   The latter isn’t precise by any means, and won’t pick up all the sorts of issues that have been touched on in this post, or Eric’s, but they are just another angle on the question.  The MFP numbers are valuable because they help get round the question of whether, say, labour productivity is just poor because firms have substituted away from capital towards abundant labour.  Any such substitution would be less troubling if the result was showing strong MFP growth.

Unfortunately, the most recent data are for the year to March 2015.  In the labour productivity data, SNZ weren’t detecting any sign that a worsening average quality of the labour force was explaining the productivity slowdown – they reported much the same improvement in the average quality of the labour force as in earlier years.  And here is the MFP chart.

mfp-measured-sector

On this measure, of labour-quality adjusted MFP, there has been no productivity growth at all since around 2006.    There is some modest growth over 2012 to 2015 (a bit over 1 per cent over three years).

Where does all this leave us?

I remain a bit uneasy about the prospects the data could be revised, but then data revisions are always a risk.  But if the average real GDP per hour worked data are roughly right – and there really has been no average labour productivity growth for perhaps four years now –  I think we should be more inclined to believe that it is telling us something about overall economic underperformance, than that it is simply, or even largely, reflecting compositional changes in the labour force. To repeat:

  • the share of working age welfare benefit recipients has fallen gradually over the last few years, but then it rose in the previous few years, and there was no obvious associated productivity surge,
  • over the last few years the employment rates of the low productivity young age groups have risen, but not noticeably faster than those for, say, the rather large 25 to 44 age group.  Over 65s employment rates are rising more than those for other age groups, but that change has been underway for many years.  There was no obvious associated productivity surge (at least in the reported data) when youth employment rates dropped sharply.
  • there is nothing in cross-country comparative data suggesting employment rate changes here have been unusual, in ways that might help account for unusually weak productivity growth here.
  • compositional effects resulting from increased immigration of non-citizens (especially  working students and working holidaymakers) could be part of the story (averaging down real GDP per hour worked, even if no one individually is less productive), although it would be worth testing that story against other episodes in other countries.  If higher immigration is playing a role in dampening productivity growth, I suspect it isn’t mostly a compositional story, but one about overall pressures on domestic resources, which have contributed to holding up real interest rates (relative to those in other countries) and the real exchange rate.
  • and overall MFP growth –  whether SNZ estimated for the measured sector, with some labour composition effects accounted for, or the Conference Board’s estimates that I showed the other day – also seems to have been weak to non-existent.


What’s good for Australia is good for New Zealand

But that is not what the FTAlphaville blog would have its international readers believe.

It is always interesting when serious foreign media write about New Zealand.  Sometimes there are useful perspectives we just don’t see.  Then again, when they get things wrong about things you know about, it leaves me wondering about the coverage of things I don’t know so much about.

Yesterday, the Financial Times’s Alphaville blog ran a piece by Matthew Klein headed “What’s bad for Australia is good for New Zealand”.   Klein seems interested in New Zealand and has written a few other posts in recent months.  In this one he draws on a recent speech by Reserve Bank Assistant Governor, John McDermott, but what is wrong with this post is almost entirely the author’s own work.

He begins with this Reserve Bank chart of the Bank’s estimate of the rate of potential output growth for the last 15 years or so.

NZ-potential-output.png

Potential output estimates have changed quite a bit as we have moved through time (and actual past estimates have been revised to some extent).  The Bank published a useful paper on estimating potential output and the “output gap” a couple of years ago.   The biggest single factor explaining fluctuations in potential output growth over time has been swings in population growth –  very strong around 2003, very strong over the last year or two, and much more subdued in between.  Changes in trend productivity growth also matter, but they are harder to detect.   But that slowdown has been real –  population growth in the last year or two has been at least as fast as it was in the early 2000s and the Bank’s estimate of potential output growth is much lower than it was then.  And as Paul Krugman helpfully reminds if, if productivity isn’t everything, in the long run it is almost everything.

But Matthew Klein seems impressed by those 2.6 per cent potential output growth rates –  much stronger than they were a few years ago –  and seems unbothered whether that is the result of more people, or of more productive use of people (and other resources). The difference matters.

Klein’s story is that the Chinese (demand-driven) hard commodity boom was a terrible thing for New Zealand, and we are now reaping a windfall from the end of that boom.

China’s changing investment strategy has produced a windfall for New Zealand — through the unexpected channel of clobbering the Australian mining sector.

Now I suppose there could be some channels through which the end of that commodity boom might have helped New Zealand and New Zealanders.  We import some of those hard commodities too (although of course, we do export some and look what became of Solid Energy).  To the extent that slowing Chinese growth might have contributed to lower oil prices, we benefit from that.  But these aren’t at all the channels Klein has in mind.  On his telling, we have done well because Australia has done badly.  And that seems inherently unlikely given that Australia is the largest trading partner for New Zealand businesses, and the largest source of foreign investment in New Zealand.

But Klein’s story is one in which New Zealanders fled for greener pastures in Australia when commodity prices boomed, and stopped doing so when commodity prices fell.  He runs this chart.

nz-emigration-to-aus-vs-aus-usd-commod-prices

Note that (a) it shows only the flow of New Zealanders to Australia, not the net trans-Tasman flow, and (b) it shows only Australian commodity prices, not the relative Australia/New Zealand prices.

Here is a longer-term chart showing the relationship between the net trans-Tasman migration flow (NZ and Australian citizens) and the relative terms of trade (Australia’s divided by New Zealand’s).

transtasman-tot-and-migration

Over decades there have been big cyclical fluctuations in the net migration flow across the Tasman.    Allowing for the fact that our population is much larger now than it was, say, 25 years ago, the peaks and troughs don’t seem to have become larger than they were.   And most of the time, there haven’t been big changes in relative commodity prices to explain the migration fluctuations.

Generally, a better story explaining the trans-Tasman flows over recent decades would seem to be:

  • in typical years there is a fairly large net outflow from New Zealand to Australia (material living standards are simply higher there),
  • when unemployment rates in Australia are very low, the outflow is higher than usual, even if unemployment is low here (job search across the Tasman is easier than usual, and those wages are higher).  In 2007/08, for example, the unemployment rate in Australia was the lowest in decades, as it was in New Zealand, and New Zealanders still seized their opportunities,
  • when unemployment rates in Australia is very high that net flow dries up –  people are reluctant to leave existing jobs when the job search across the Tasman is likely to be longer and costlier (as we saw in 1991),
  • and when Australia’s unemployment rate is lower than New Zealand’s –  which doesn’t happen often – it again makes it very attractive for New Zealanders to go, especially if New Zealand’s unemployment rate is still on the high side.  The largest such gap in the last couple of decades was 2010 to 2012, which saw large scale outflows of New Zealanders resume.

Since then, of course, the unemployment rate in Australia has risen, and that in New Zealand has fallen. In both countries, unemployment is uncomfortably high, and above the respective estimated NAIRUs.  Perhaps it is a little surprising that the net outflow of New Zealanders has, for now, come back to around zero, but there has also been a lot more publicity in recent years about the relatively insecure position New Zealanders can find themselves in in Australia if things don’t go well.  But it would still be surprising if when both countries have unemployment rates are back at the respective NAIRUs there wasn’t typically a large net outflow of New Zealanders resuming.  After all, there has been no progress at all in closing the productivity gaps.

relative-u-rates


No doubt the hard commodity boom, and associated domestic investment boom, did contribute to the relatively low unemployment rate in Australia over 2010 to 2012.  But macro policy (especially monetary policy) also plays a big part in deviations of the unemployment rate from the level the underlying regulatory settings might deliver (the NAIRU).  In New Zealand, for example, the inflation outcomes quite clearly illustrate the monetary policy was tighter than it needed to be over that period.  Some of that was only clear in hindsight, and the earthquakes also muddied the water, but we didn’t simply have to live with such a high unemployment rate for so many years (which reinforced the incentive for New Zealanders to leave).

But, to stand back, perhaps the more important question to ask is why Klein thinks New Zealand is better off simply because the net outflow to Australia has temporarily ended.

After all, New Zealanders going to Australia presumably do so because they think the opportunities are better there (and most objective measures of material living standards suggest they are right).  If opportunities deteriorate in Australia –  cyclically or structurally –  that isn’t a gain for New Zealanders, but a loss.  Fewer of them are, for now, able to take advantage of the opportunities across the Tasman.  It would be different if there were New Zealand specific positive productivity or terms of trade shocks  that meant that prospects here were improving faster than they had been previously.  But there is just no sign of that: as just one indicator, there has been no growth at all in real GDP per hour worked in New Zealand for around four years.

Of course, it might count as a gain if there was some sort of community goal to simply increase New Zealand’s population as fast as possible.  One sees those sorts of arguments in various countries from time to time –  there was a particularly daft Canadian example the other day  – but unless New Zealand is gearing up to defend itself from a military invasion from Antartica, the only good case for pursuing a larger population is if doing so makes us economically better off (higher productivity and all that).  And there is simply no evidence it has, or does –  whether in past decades, or in the latest population surge.

And all this is before reverting to the point that New Zealand firms trade more with Australian firms and households than they do with those in any other country. Australia is New Zealand’s biggest export market.  And so when Australian income growth tails off rapidly, as it has in the last few years, it isn’t very propitious for New Zealand firms hoping to increase their sales in Australia.  Weaker income growth in target markets is generally thought to be bad for the sellers (and their country) not good.

Here is a chart showing the net migration outflows for a longer period.

net-migration-charts

I’ve shown a variety of measures of trans-Tasman flows, and one of all NZ citizen flows everywhere.  They are all highly-correlated, as trans-Tasman flows almost always dominate the overall movements of New Zealand citizens.  There have been three times in the nearly 40 years for which the citizenship data have been available when the net outflow of New Zealanders has temporarily abated:

  • around 1983, when Australia was in recession and its unemployment rate was over 10 per cent,
  • in 1991, when both countries had a severe recession and both countries’ unemployment rates peaked around 11 per cent,
  • and in the last couple of years.  It is unusual in that neither country has been in recession, but both countries have had unemployment rates above the respective NAIRUs, in both countries income growth is much weaker than it was (particularly so in Australia) and in both countries (as in much of the advanced world) productivity growth has disappointed (most especially in New Zealand).

Not one of those occasions could be considered good news stories for New Zealand or New Zealanders.  Over the last 40 years, net outflows of New Zealanders to Australia have been something of a release valve –  Australia gave them opportunities New Zealand could no longer provide.  Unless and until New Zealand really begins to turn itself around structurally, anything that disrupts that outflow is more likely to be bad for New Zealanders than good.

Klein concludes his piece thus

As long as New Zealand is capable of boosting domestic spending without relying too much on household borrowing, admittedly a nontrivial challenge, this puts the country in an enviable position compared to much of the rest of the rich world. Policymakers should enjoy it while they can.

Given that household credit has been growing at almost 9 per cent in the last year, mostly reflecting very rapid increases in already high house prices, and that there has been no productivity growth for years, all while the unemployment rate has lingered above the NAIRU, I’m not at all sure what Klein thinks policymakers should be enjoying.  Perhaps write-ups like his – while they last –  but there doesn’t seem to have been much in the story for New Zealanders in recent years.

Here is the productivity growth comparison with Australia.  If anything, the latest relative deterioration seems to coincide with the end of the Australian commodities boom. I doubt that relationship is really causal, but it certainly doesn’t seem to help Klein’s story.

gdp-phw-nz-vs-aus

In general, what is good for the economy of our largest trade and investment partner will, almost always, be good for New Zealanders too.  That is how trade, and open markets, work.