Services exports and economic performance

A couple of pieces I saw yesterday got me thinking again about New Zealand’s services exports and our economic performance.

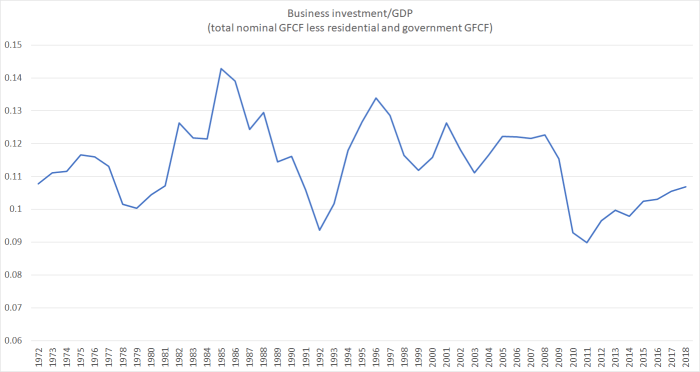
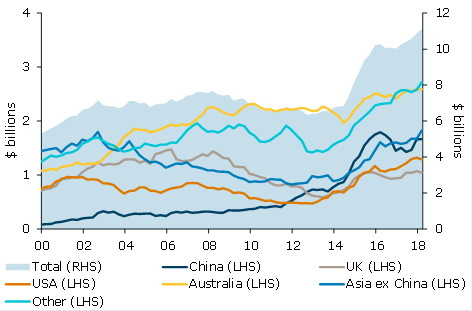
On the one hand, there was an interesting ANZ report on tourism, which included this chart.

Chart of the week

Spending by international visitors has seen impressive growth in recent years.

International visitor spend by country

tourism

Source: MBIE

And then there was speech on the MFAT website by Catherine Graham, their Economic Divisional Manager.  MFAT doesn’t publish many speeches, so it was interesting to see a bit of an economics angle, even if  it was infected with the government of the day’s propaganda.  Perhaps that was inevitable to some degree in a speech by a public servant, but gratuitous endorsement of the Provincial Growth Fund didn’t seem strictly required in a speech notionally on “small state diplomacy”.

There was a certain breathlessness to the speech

All countries and regions face technological mega trends that are consequential to businesses and governments and affect decisions. Digitalisation, artificial intelligence and automation will increasingly affect wage and employment levels, in developing as well as developed countries. The key difference from the past is that the change – driven by computing power – will occur at an exponential, rather than linear, rate. 

Maybe, although the best guess remains that people who want to work will continue to be able to do so.  Markets adjust like that.  And global productivity growth shows no sign of such a dramatic transformation (for the better).

Also from the breathless side was this

Non-state actors such as the major e-commerce platforms (think Amazon and Alibaba) and the social media giants (think Facebook, Instagram and Google) are each on their own much bigger economically than New Zealand (and many other countries’ economies). How do we navigate our relationships with them as a nation state?

This seems mostly (a) meaningless or (b) wrong.  For example, on checking I learned that the market capitalisation of Facebook was US$390 billion, and its annual revenues were less than US$50 billion.  On no meaningful metric is it bigger than New Zealand, but even if it was there is a fundamental difference between a company and a nation state.  For better or worse, Facebook could be regulated out of existence almost overnight.

But the line that caught my eye, and prompted this post, was a couple of paragraphs later

Continuing to create and leverage smart ideas will be essential for New Zealand’s agricultural sector to keep delivering value to the economy and address broader societal and environmental challenges. Elsewhere in the economy, New Zealand’s success in weightless exports – such as software development, services embedded and embodied in physical products, and the creative arts – are growing apace. It is likely that this trend will be supported by ongoing technological advances.

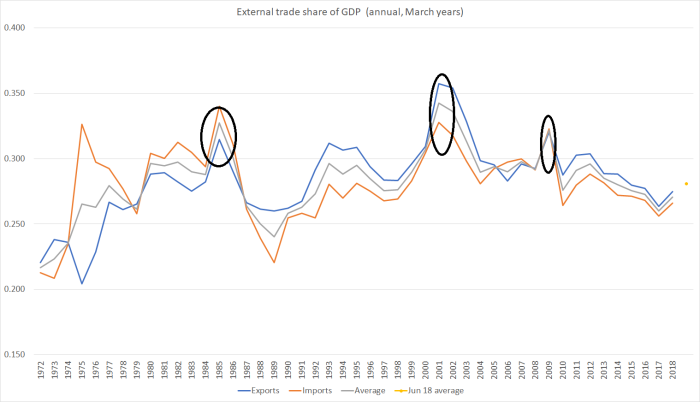
You’d have thought that a senior economics person in our foreign affairs and trade ministry might have thought it worth mentioning that exports as a share of GDP peaked (in modern times) 18 years ago, or that there has been no growth in the real per capita output of the tradables sector in the same period.

But what about those “weightless exports” specifically?  Here is the time series of New Zealand’s services exports for the last 30 years.

services x nov 18

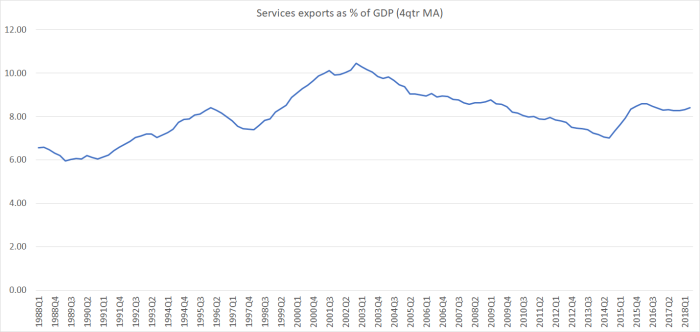
The 1990s looked quite good, indeed the peak wasn’t even until as late as 2003, but since then it has mostly been downhill.   There was a bit of a pick-up a couple of years ago, but even that doesn’t look to be going anywhere in particular.  The services export share of GDP is currently at a level first reached in 1996.  This is success?

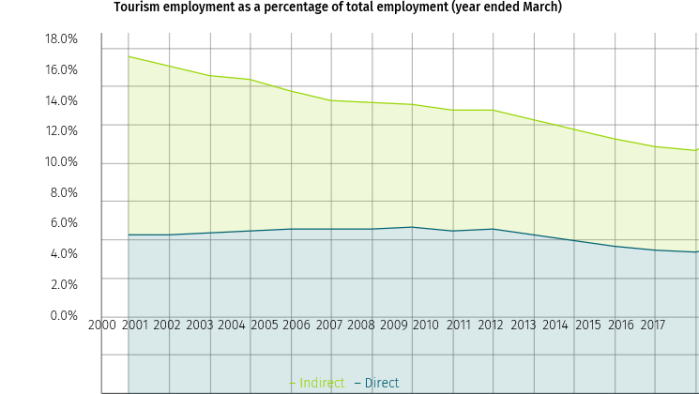
That ANZ chart I started the post with looked quite impressive.  Nominal series over long periods of time often do.  But MBIE now has a nice tourism data dashboard (there is a migration data one coming), with some useful summary charts.  Here are a few of them

tourism mbie3

tourism MBIE 2

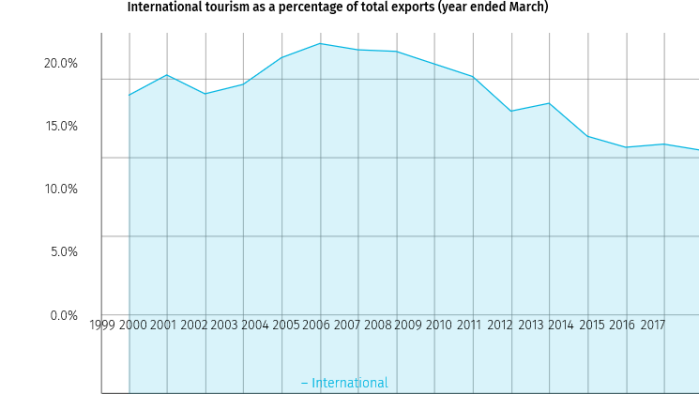
and, as a share of GDP –  direct and (estimated) indirect contributions

tourism MBIE 1

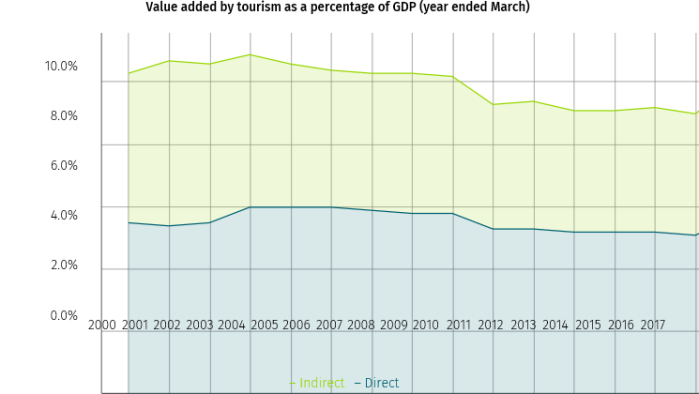
(UPDATE: A careful reader points out that these charts, which I directly downloaded from the dashboard, have not translated correctly.  Anyone wanting the correct pictures should go to dashboard itself (link above) and click on the “Overview” menu and then “Economic Contribution”.   As represented above the charts don’t capture the pick-up in tourism in the last couple of years.)

And tourism is by far the largest component of our “weightless exports”.    We all know there are specific services firms doing well, either selling abroad directly or (as Ms Graham notes) with their services embedded in other goods exports, and on the other hand we have the film industry (kept alive on massive direct public subsidies) and the export education industry (aided by substantial implicit subsidies, bundling immigration and work access provisions to the sale of educational services).  The bits that are doing very well, standing on their own feet, just have to be very small relative to the size of the economy, and to the scale of the New Zealand economic challenge (closing those huge productivity gaps).

How do we do by international comparison?

Here are exports of services as a share of GDP for the small OECD countries (I’ve left Ireland and Luxembourg off the chart, but –  for various reasons –  their services export shares are “off the charts” high).  Small countries is the relevant comparator here, as countries with large populations naturally tend to have rather lower foreign trade shares.

services x nov 18 2

Services exports from New Zealand have been shrinking as a share of GDP, and our services export share of GDP was low to start with.   This century to date, only three of these small OECD countries have had more of a fall in the services exports share of GDP than New Zealand has.   And all three of them –  Czech Republic, Slovakia and Estonia –  have in any case managed much faster productivity growth than New Zealand over that period.

Our economy isn’t doing well, no matter how much bureaucrats and politicians like to pretend otherwise, and regardless of whether one focuses on the “weightless” bit of the economy or the rest of it.  We do quite well at employing our people, but then wage rates and productivity are now so modest by advanced country standards –  gaps that simply aren’t closing –  that more people feel the need to work.

And strangely, it seems that MFAT’s Economic Divisional Manager has some inkling of this as she ends this particular part of her speech thus

I strongly believe that earth will never be “flat”, as Thomas Friedman claimed, and that geography remains, to a greater or lesser extent, destiny. Digitalisation is not causing the end of geography as a key determinant of prosperity. Industry clusters, international connections and trade, knowledge exchange and IP transfer are all positively correlated with geographical proximity as well as prosperity – in other words, they are much easier for large countries and countries with land borders to achieve. The catch-22 for small, isolated countries is that they are also the very conditions essential to overcoming the disadvantage of geographical distance. This is a huge challenge for New Zealand, both in terms of international policy but also domestically – currently we see the government tackling this challenge through regional policies such as the Provincial Growth Fund.  

Except that it isn’t some sort of “catch-22”.  It is a constraint that New Zealand officials and politicians need to finally get real about.   If – natural resource based opportunities aside – the best opportunities in the world arise from being in close proximity to lots of other people (as markets, skills networks or whatever), then trying to grow New Zealand’s population as a matter of policy –  lots more people in an unpropitious location –  looks crazy.  Many of the people who come would have been better off to have gone somewhere else (if they could).  And the challenge facing the typical longstanding citizen (native or otherwise) –  to manage top-tier global incomes and living standards – is simply made tougher with each new person our governments bring in.  That is not because of access to jobs (that is a straw man non-argument –  you observe full employment in poor, rich and middling countries) but precisely for the sorts of reasons that Ms Graham of MFAT identifies (even if she apparently has not thought fully through the implications of her observation).

Europe’s economic performance

A commenter on yesterday’s Brexit post raised the question of how Europe (EU, euro area or whatever) had done overall relative to the rest of the advanced world.   The question sparked my interest, not just about the last 20 years or so (since the euro was created, and the comparison in yesterday’s post) but about somewhat longer spans of history.

At around the turn of the 20th century no one would have doubted that Europe dominated the world geopolitically, and it no longer does that.  That geopolitical rise was built on technology and associated economics, but just because the geopolitical moment has passed doesn’t necessarily mean the economic one has.

But who to compare Europe with?   Relative to the situation 100 years ago, some east Asian countries (in particular) have caught up considerably.  In most respects that is to be welcomed, and doesn’t tell one anything particularly enlightening about the performance of western Europe.   And some (most?) of the European countries that aren’t in the EU are nonetheless in agreements with the EU that mean that in many respects the policy regimes are similar.

And so here I’ve focused on a comparison with the European “offshoots”, notably the Anglo-shaped ones (the United States, Australia, Canada, and New Zealand), but with some reference also to Argentina, Chile and Uruguay.  Prior to World War One, Europe may have been the geopolitical centre of the world, but individuals in the typical offshoot countries enjoyed a better material standard of living than their peers in western Europe.

europe 1

The first two columns are the group of 11 western European “established” euro area member countries in yesterday’s post, and a subset of those that I’ve got interested recently (France, Germany, Belgium, Netherlands, and Denmark) which today have much the same level of average labour productivity as the United States.

In 1913, the Anglo countries were top of this particular economic heap, and the western European countries weren’t much different than average living standards in Argentina, Chile and Uruguay.  In 1929 and again in 1955 (allowing some time for recovery from the war) the picture still wasn’t so different.  The five top European countries were doing better and the UK a bit worse, but average GDP per capita in the 11 European countries group was only about 10 per cent higher than those in the Uruguay, Argentina or Chile group.

And here is the same chart for 2017, using Conference Board data.

europe 2

It doesn’t take too much study to see where the (relative) decline has been centred: the European offshoots and the UK.  The picture is most vivid for the southern cone countries in Latin America, but isn’t less real for the Anglo countries.  It isn’t that, as a group, they’ve been surpassed by continental western Europe, but that western Europe has caught up. (Since this isn’t a New Zealand-centred post, we will quickly pass over the way those countries now outstrip New Zealand.)

But what about some time series charts for more recent periods?  In this chart I’ve shown the same two European groupings relative to the median for the Anglo offshoot countries (US, Australia, Canada, and NZ) using OECD data which start in 1970.

europe 3.png

(I don’t quite know what was going on around 1990, although I guess it is probably about the recession in many of the Anglo countries).

Over the full period since 1970, Europe has gained ground relative to the Anglo offshoots, on both groupings.  But there is, of course, a big divergence in the two series in the last decade or so.   For the top-5 north European countries, performance has remained pretty strong.  The median of those five countries now has average per capita incomes almost equal to those of median Anglo offshoot country (and, as it happens, the Europeans work fewer hours per capita to achieve that outcome).  But for the wider group, things have gone badly into reverse –  the influence of the poorly performing tail (Greece and Italy in particular, but also Spain and Portugal).

What about a similar chart for productivity?   The OECD doesn’t have labour productivity data for the whole period for Austria and Greece, so in this chart those two countries drop out of the comparison.

europe 4

It is a somewhat different picture.  The cylical effects large drop away, but (not unrelatedly) so does the marked difference between the two groups of euro-area countries over the last decade.   On this measure, Europe’s labour productivty growth has fallen behind that of the Anglo offshoots grouping over the last decade (although not in the first few years of the euro).  But perhaps the bigger story remains just how much average productivity in Europe has improved relative to that in the Anglo offshoots world over the whole period since 1970.  It is a huge relative gain for (western) Europe.

And what of a simple comparison between the leading group of European industrial countries and the US?  After all, if Europe has its laggard, the Anglo world has New Zealand (and Canada).  Here’s that chart.

europe 5

It is interestingly different.  Relative to the US, these leading European countries did poorly last decade.  But the underperformance hasn’t continued into this decade, despite the euro-area crises, even if little of the ground has been made up again.  But again, taking the longer view, surely the bigger story is one of the improvement in Europe’s relative performance since 1970.

And of course, amid all of this there has been no mention of the rest of Europe, the bits that spent decades in the Soviet orbit, and weren’t beacons of prosperity prior to that.    Many of those countries have been making progress in catching up with the Western European leaders even as, over longer runs of time, western Europe has been catching up with the (former) Anglo leaders.

And as one final chart here is snapshot of Conference Board estimates of the levels of labour productivity last year.

europe 6

Five of the top six are European, even if Singapore is almost at the heels of the European leaders.  (Ireland, Luxembourg, and Norway have higher numbers again, each with their own idiosyncrasies.)  Below Singapore, I’ve just put in a few countries out of interest –  China as much because on my walk this morning I listened to a podcast interview with a former European politician convinced that by 2038 China will dominate the world, and that this will mostly be a good thing.

Europe has had its good and its (very) bad times in the last 100 years or so, but when one looks at the data as a whole it is hard not to think that in economic terms Europe’s performance (and especially that of the northern European top tier) relative to the rest of the advanced world has increasingly been as good as it has been at any time since the New World was really opened up to trade and settlement.    By contrast, over the last 100 years or so, of the New World countries only the US has more or less managed to hold its own matching or exceeding the leading group (per capita income and productivity) of European countries.

For New Zealand, Uruguay, Chile and Argentina –  and even Australia –  (the Antarctic Rim countries) it all seems to have proved just too hard.

On Poland and economic performance

Next week we mark the 100th anniversary of the end of World War One.   Whatever else –  good and ill –  the resulting peace process ushered in, it led to the restoration of an independent Poland.   I was reading an article the other day by a British writer, resident in Poland, reflecting on 100 years of (renewed) Polish independence, which in turn prompted me to dig out some economic data.

My own reflection on Poland is that it is hard to think of a place in the western world (say, present day EU, other bits of western Europe, and western European offshoots – eg New Zealand, Australia, Canada, US, Argentina, Chile, Uruguay) that wouldn’t have been preferable to live in over the last 100 years or so, at least as judged by material criteria.   Perhaps if you were German, you have to live with the guilt of World War Two, but most of Germany was free again pretty quickly.   Romanians and Bulgarians might have been poorer on average, but they largely escaped the worst horrors of the German occupation.  To its credit, Bulgaria managed to largely save its Jewish population, while the Polish record was patchy at best.  With borders pushed hither and yon, and not a few abuses of other peoples (notably ethnic German) post-war, sanctioned by the state, the place then settled into 40 years of Communist rule.   There is a lot to admire about Poland, but I wouldn’t have wanted to live there any time in the 20th century.

In economic terms it has always been something of a laggard.   Here from Angus Maddison’s collection of data are estimates of real GDP per capita for 1870 and 1913 for the UK, France, Germany, the territory that was Polish, and New Zealand.

poland 1

Real GDP per capita in Polish territory (mostly ruled by Russia) was about a third of that in New Zealand.

The Maddison database has annual data for Poland from 1929 (excluding the period of the war), and that ratio of Polish GDP to New Zealand GDP seemed to show no real trend whether pre-war or in the communist years, averaging just a bit more than a third.

poland 2

Relative prices – including the purchasing power parity exchange rates used- matter quite a lot in these cross-country comparisons across time.  So not too much should ever be put on any particular levels estimate.  The Maddison database only comes forward to 2008 and the most widely used current numbers are those from the OECD.  On their calculations, at the end of communism Poland was a bit better off (say, relative to New Zealand) than in the Maddison numbers.  Polish GDP per capita in 1990 is estimated to have been about 44 per cent of that in New Zealand.

Here are the OECD estimates for the period since.

poland 3

On OECD estimates, Polish real GDP per capita hit 75 per cent of that in New Zealand.

Here is the OECD estimates for real GDP per hour worked (for which there are no longer-term historical estimates, but we can safely assume the ratio was very low on average –  perhaps averaging 35 to 45 per cent –  in the century prior to 1990.  In 1993, when the Polish data start the ratio was 43 per cent –  almost exactly the same as for real GDP per capita.

poland 4

Last year, Poland’s labour productivty reached 82 per cent of that of New Zealand.

All of which is clearly very good for Poland.   And it clearly isn’t just that they’d thrown off the shackles of communism: as the earlier charts show, Poland had been a laggard in the 19th century, and in the first half of the 20th century.

But, of course, part of the good news in these charts is a reflection of New Zealand’s own poor long-term performance.

Here are the latest OECD labour productivity (real GDP per hour worked) estimates for the same group of countries as in my first chart above.

poland 5

Last year, for the first time, Polish real GDP per hour worked passed 50 per cent of that in France and Germany.  100 years ago, of course, both France and Germany would have lagged well behind both the UK and New Zealand.

Perhaps Poland will go on to achieve much greater convergence with the other big European economies in the next few decades – we can only hope so –  and yet one can’t help wondering whether the leaders of a newly independent Poland wouldn’t have been rather disappointed if they’d been told that 100 years on their successors and fellow citizens would still be achieving only half the output per hour of the French and Germans.

Then again, they’d probably have been astonished to learn that 100 years on they’d be managing 82 per cent of average New Zealand productivity (and even 63 per cent of that of the British –  leading global power a century ago).

Hard to think though how disbelieving our own leaders would have been 100 years ago if they were told how far we would have fallen relative to these other countries, notably including Poland.     With none of the excuses –   wars, shifting borders, genocide, or decades of communist rule.

I might have a look at the data for a few of the other post World War One emergent countries later in the month.

No plan, but not much sign of aspiration either

There was a not overly good article in the Financial Times yesterday marking the first anniversary of the Labour/New Zealand First (and Greens) government.   Among its odd features was the final sentence which reported the suggestion from political scientist Bryce Edwards that the Prime Minister “is now seen as an icon of good family values”.   Really?  By whom?  The FT’s journalist also claimed that the Prime Minister had achieved “near-celebrity status” abroad.   If that were true I’m not even sure it would be a good thing, but is it?  I read pretty widely internationally and I don’t see much sign of it.

But the primary focus of this blog is still economics, and what really caught my eye was this comment from a former ANZ chief economist:

“I’d give the coalition an A grade for aspiration due to their ambitious reform agenda,” said Cameron Bagrie, founder of Bagrie Economics. “But the problem is they haven’t got an economic plan in place yet.

I’d certainly agree with the second sentence (no plan).  But Cameron Bagrie seems to be far too charitable is his talk of an “A for aspiration”, let alone the puzzling talk of an “ambitious reform agenda”.

Sure, ministers occasionally run the line about building a more productive and sustainable economy, with occasional suggestions of shifting the “growth engines” of the New Zealand economy.  But after only a year it has already become nothing more than a cliche, recycled in speeches and press releases, signifying almost nothing, and with no sign of any passion or serious aspiration underpinning it.

And it really doesn’t mark them out from most of the decades of governments that have gone before them, since the problems  –  and underperformance – of the New Zealand economy first started to become apparent, back in the 1960s.  All of them talk about producing something better and then, after they’ve been in office long enough, start pretending that there really isn’t a problem after all (John Key, you may recall, resorted to talk of “quality problems” –  dreadful congestion, and unaffordable house prices.)   There is talk of a more outward-orientation to the New Zealand economy, of a stronger productivity performance, of closing the large gaps that have opened with the older OECD countries.  And then, in most cases, almost nothing happens.  Governments occupy office, and then leave it, and the fundamental failures aren’t addressed.   Housing is a more recent utter failure than productivity –  only really dating back 25 to 30 years –  and again governments talk about how things will be different, but do little of much substance, and never show any evidence that they care much.  To date, the current government doesn’t look materially different on that count.

Has anyone heard rhetoric from the Prime Minister or her ministers about getting house prices back down again –  to perhaps three times income that looks to have been a longer-term norm?   They won’t even say the words, let alone suggest that have a well-researched carefully thought out plan (economic and political) to make it happen.   There is nothing specific either to their talk of a more productive economy –  no benchmarks to which we can hold them to account, no nothing (and indeed things like the oil and gas exploration ban, and net-zero targets that will likely make it much harder to pursue such goals –  if the government were actually serious about them).   There is no sense of open alarm (which a new government could afford, responsibility for those outcomes not yet resting with them) at five years of very little productivity growth –  even though productivity growth almost alone underpins prospective improvements in material living standards –  let alone the decades of relative underperformance that has helped give the outcomes the government probably does care about more (eg child poverty), and the decades-long exodus of New Zealanders to Australia.  If there is “aspiration” –  as Bagrie suggests –  around economics it seems to involve using just enough of the right words to get and hold office.

I wrote the other day about the vacuous nature of the new Business Advisory Council (and a Herald columnist had some other criticisms which mostly rang true). The Prime Minister talked up the Council when she first launched it, but which seems more likely to be a sop to the (upper end) business community than a sign of, or source of serious ideas for, any serious commitment to a much better economic future.  There isn’t a plan –  that much is obvious.  But there is also no sign of a serious aspiration –  the sort that shapes how the government operates in its determination to give concrete form to a better future –  either.  Sadly, that doesn’t mark them out from their predecessors.

What if they really were serious?  Well, of course, then they’d have used the long years in Opposition rather better.  That is water under the bridge now.   But even now they could be looking seriously for some better, more compelling, answers.

Business leaders aren’t typically the place you would be looking to find those sorts of answers –  an economy is, in crucial ways, not like a company.   Economists, for all their faults, are much more likely to be able to help in getting to the bottom of the problem, and identifying policy measures that have a serious prospect of making a real difference.  There are stories and proposed solutions around.  I’ve been developing one, and arguing it here, for some years, but I’m not alone.  Paul Conway at the Productivity Commission has also developed sustained analysis and arguments about the productivity failure –  in some areas, his analysis overlaps with mine and in others not.  If the leadership of the key government  agencies –  Treasury and MBIE –  is beyond hope, there are still individuals in Treasury (in particular) who have thought hard about, and written on, some of these issues.  There are people like David Skilling, now based offshore but formerly at Treasury and the New Zealand Institute, and the academic Phil McCann.  There would, no doubt, be others who would invest in the hard thinking and analysis if a government were to show signs that it was really serious about New Zealand doing better.

I’ve argued for years that what is needed is a serious contest of competing narratives –  credible, well-documented, stories, well-grounded in the specifics of New Zealand’s situation and experience that explain New Zealand’s underperformance and how any policy proposals fit in to such a narrative.   Probably no one story or set of proposals will get everything right, but the active contest of ideas and arguments is a big part of the way in which we could make progress towards a deeper, and shared, sense of what has gone wrong and what could –  and should – be done in response.

But, of course, there is no sign that the Prime Minister or the Minister of Finance, or the leaders of her coalition/support parties, care.  There is no sign that they have anything like the sort of aspiration –  on matters economic (including housing) –  that the Financial Times reports Cameron Bagrie suggesting they have.   That is beyond a shame, and more like a disgrace –  like their predecessors, people who hold office and yet do little or nothing, presiding over a continued relative decline of a country once the most prosperous on earth, that once –  and not that long ago –  had affordable housing for its people.

The void where an economic strategy should be

During the week, rather lost amid the Jami-Lee Ross claims and counter-claims (how did a major party have the indecency to keep on rapidly promoting the man when their hierarchy clear knew at least a couple of years ago –  and kept quiet about – his character?  Unless of course, the main required quality for a National MP is now fundraising –  often of the most questionable kind –  not character or legislative/policy skills) the Prime Minister announced the membership of her Business Advisory Council.

This is the group

Prime Minister’s Business Advisory Council members

Christopher Luxon (Chair)                  Air New Zealand
Peter Beck                                                Rocket Lab
Barbara Chapman                                 Professional director
Jacqui Coombes                                   Bunnings
Anna Curzon                                           Xero
Andrew Grant                                        McKinsey & Company
Miles Hurrell                                          Fonterra
Bailey Mackey                                        Pango Productions
David McLean                                        Westpac
Joc O’Donnell                                          HW Richardson
Gretta Stephens                                     Bluescope/NZ Steel
Rachel Taulelei                                      Kono
Fraser Whineray                                   Mercury

And the terms of reference are here.

Here is how the Prime Minister’s statement begins

Prime Minister Jacinda Ardern has announced a diverse cross section of leaders from the business community will form her Business Advisory Council to advise the Coalition Government as it works on building a productive, sustainable and inclusive economy that improves the wellbeing of New Zealanders.

And here is how she was talking a couple of months ago when the Council was first foreshadowed.

“The Council will provide a forum for business leaders to advise me and the Government and to join us in taking the lead on some of the important areas of reform the Government is undertaking,” said Jacinda Ardern.

“The Council will report to me on opportunities it sees and identify emerging challenges. It will bring new ideas to the table on how we can scale up New Zealand businesses and grow our export led wealth.

“I want to work closely with, and be advised by, senior business leaders who take a helicopter view of our economy, who are long term strategic thinkers who have the time and energy to lead key aspects of our economic agenda.

Perhaps all the people on her group are very able at what they do.  Perhaps many are even good at thinking about the implications for their own businesses of specific technical advice.

But not one of them seems to have the background or skill set that suggests they have anything more to add to fixing New Zealand’s woeful economic underperformance –  over multiple decades –  than, say, the first 100 people in the Wellington phone book.

Drawing on old article from Paul Krugman, when this Council was first announced I wrote a post about how a company is not a country, and the skills that equip someone to run a company bear little or no relationship to those involved in identifying the economic failings, and appropriate remedies, for a country.

Expertise on economic management, and the particular confounding challenges the New Zealand economy faces, just aren’t the sort of thing that tends to be fostered in the course of a corporate career.   Many of these people might have been superb marketers, exceptional operations managers, corporate finance whizzes, smooth operators around the edges of regulation and the tax system, and have risen to assume overall responsibility for (by New Zealand standards) fairly large organisations. They are absolutely vital skills, and business roles done well are a big part of how, in pursuing the interests of shareholders, society is also made better off.   But those skills bear no resemblance to the issues involved in addressing long-term economic underperformance.  For a start, the things businesses have to take as given are precisely the sorts of things governments often can vary, and (as Krugman eloquently notes) the sorts of constraints even a large business faces are very different from those an entire economy faces.   And so on.

It is great that these individuals care about New Zealand’s economic performance, but there is no particular reason to believe that in general they will have more useful perspectives to offer than the average moderately-educated voter chosen from the phone book at random.  Running a business no more equips you to provide useful advice on economic policy more generally (as distinct perhaps from specific bits around your industry) than it does to, in Krugman’s words, write great poetry or make military strategy.

What isn’t clear is whether the Prime Minister genuinely expects this group to make a difference –  successfully identifying the key issues governments need to address –  or is simply buying a bit of time and goodwill with the big end of town in the hope that something will turn up.   One interpretation would suggest extreme naivete and the other a quite cynical approach.  Take your pick which you think is worse.  Perhaps it is just wishful thinking?  But whatever the answer, a year into the government’s three year term, there is no economic strategy, nothing that anyone credibly thinks will lift our long-term productivity underperformance, successfully reorient the economy outwards.    For a short time perhaps any goodwill around the creation of this council will paper over the void…..but a void it is.

Meanwhile,

  • the level of productivity is flat or even falling,
  • the export and import shares of GDP have been falling,
  • in per capita terms, the tradable sector of the economy hasn’t grown at all this century.
  • (and if we want to talk “inclusion” there is no sign of a structural fix to the housing o or urban land supply market),
  • while we are left with a structurally overvalued real exchange rate and the highest average real interest rates in the OECD.


Sluggish productivity growth and financial crises

There has been some interesting material around recently on how many advanced economies (in particular) have undershot over the last decade or so the trends they appeared to be on previously.  Paul Krugman had an interesting column a couple of weeks back, and then the IMF had a whole chapter in their  latest World Economic Outlook on “The Global Economic Recovery 10 Years After The 2008 Financial Meltdown”.   Martin Wolf summarised and illustrated some of that chapter in his FT column last week.  Much of this work attempts to associate (causally) subsequent disappointing economic performance with the financial crises of 2008/09, something I’ve long been a little sceptical of.    The IMF also highlights that countries that didn’t have a financial crisis have shared in the underperformance.

I might come back to the IMF material (in particular) later but reading it prompted me to check out some New Zealand data.

As context, here is some OECD data for labour productivity (real GDP per hour worked) for the G7 countries as a group.

G7 productivity

The trendline shows what might have happened if the trend growth to 2005 had continued.  The gap at the end of the period is equivalent to a productivity shortfall of around 15 per cent.    Note that this productivity slowdown was clearly underway well before the financial crises.

And here is the New Zealand data.  Here I’ve used quarterly data, all the way up to 2018q2.

nz productivity

But this time the trendline extrapolates the trend in the actual data up to early 2012.  Because up to about that time there was no particular sign of a change in the trend. (And thus between 2005 and 2012 we actually did a little better than the G7 as a whole).

Over the six years since 2012, the gap between the actual data and the trendline translates back to a shortfall of about 8 per cent.  Real GDP per hour worked now would be around 8 per cent higher than it actually is –  with all the attendant implications for wages, consumption possibilities, and even government revenue – if that pre-2012 trend had been sustained.  And the pre-2012 trend had been pretty weak –  mostly we’d still been falling behind the rest of the advanced world.

It is always possible that much of the recent productivity shortfall will be revised away –  SNZ have, over the years, delivered some significant changes in history at times.  But I’m not aware of any particular reason to expect significant revisions (in any particular direction), so we simply have to work with the data we have.

As the G7 countries didn’t have a financial crisis in 2005, we didn’t have one in 2012.  In fact, we hadn’t had a systemic financial crisis at all since the late 1980s, and the localised (severe in the sector, but small economywide) finance companies crisis had been centred back in 2007 and 2008.  For New Zealand, there simply isn’t a plausible story in which financial crises –  domestic or foreign –  can explain our dismal productivity performance over the last half decade or more.    Neither the timing, nor the stylised facts around the New Zealand financial system, fit.

There are reasons why for countries at the productivity frontier a major financial crisis could impair domestic productivity growth even in a country that did not itself have a domestic financial crisis, but that isn’t a very relevant story here, New Zealand average productivity being so far below that in the leading group of countries (where productivity is about two-thirds higher than in New Zealand).

I’m not sure I have a fully compelling explanation for why New Zealand has done so poorly since around 2012 (my standard story encompasses several decades of persistent gradual  –  cumulatively stark  – underperformance, and period since 2012 looks –  on current data –  to have been unusually bad).   Perhaps the earthquakes, and the subsequent diversion of resources to a lot of vital, but low productivity, repair and reconstruction work is part of the story (as we knew from day one, in economic terms it was a nasty non-tradables shock that wasn’t going to be helpful).  Then again, the peaks of that work are now well behind us, and productivity growth has yet shown signs of improving.  Perhaps the strong terms of trade have been part of the story –  not stimulating business investment, which has been persistently weak, but boosting incomes and perhaps crowding out other stuff.  The real exchange rate –  not an exogenous influence –  got back to pre-recession levels from about mid-2011.   And, of course, the very sharp and substantial turnaround in the net immigration numbers –  also mostly not an exogenous development –  was getting underway from later in 2012.

Whatever the full explanation, the symptoms (eg weak business investment, shrinking exports and imports as a share of GDP) should be worrying, the outcomes (productivity, and thus potential incomes) are dreadful –  building on earlier decades of underperformance –  and the explanation can’t credibly lie in financial crises, domestic or foreign.

And nothing serious is being done about addressing this failure, by the last government, by the present one.  And The Treasury –  principal adviser to the government on such matters –  seems much more interesting in its Living Standards Framework and esoteric (and sometimes convenient) concepts of “wellbeing” than in actually advising on remedying the New Zealand productivity failure.

nnn

Not much business investment

Yesterday’s post was prompted by looking at the export and import data in last week’s GDP release.   Today’s is prompted by looking at the investment data.

The latest quarterly data wasn’t that interesting in itself –  business investment fell a bit, but from quarter to quarter there is quite a bit of noise, and not much can be read into a single quarter’s data.

But here is a longer view on a proxy for business investment spending as a share of GDP (total gross fixed capital formation less residential investment less government investment spending), using the annual data back to the year to March 1972. The latest quarterly observation is almost exactly the same level as the final (annual) observation on the chart.

bus investment sept 18

Years into the recovery, after several years of very rapid population growth, business investment as a share of GDP has crept back up to levels that are only higher than seen in past recessions.  And by international (OECD) standards, business investment as a share of GDP has been low in New Zealand for decades.  It is consistent with the story numerous analysts have highlighted over the years: one of the proximate symptoms of our long-term economic underperformance is that firms haven’t found it worthwhile to invest more heavily here.   The last few years look as if they simply reinforce that story.

(And that isn’t, of course, because we have too many houses for our people.  If anything, we have too few, so when people –  like the Minister of Finance –  talk of shifting investment from housing to other things, while not changing anything about population growth, it is meaningless or worse.)

That first chart, which I’ve shown previously, is the flow –  each year’s new investment as a share of total GDP that year.  But this chart uses the stock figures: SNZ’s net capital stock (total less residential less government) relative to GDP.  That takes account of depreciation, and also of the changing growth rate of the population.

bus cap stock

The business capital stock (as estimated by SNZ) hasn’t been growing relative to GDP for over 40 years.  Over most of the last decade that ratio has been shrinking (and although these data are available only to March 2017, it seems unlikely anything in the last 18 months will materially alter the picture).  Businesses –  as a whole – simply haven’t found it attractive to invest and grow here.

The government is very keen on promoting R&D spending, rushing to put in place new and bigger subsidies without much evidence of having thought much about why it might not be attractive to profit-maximising firms to spend more here.

R&D is included in both the annual new investment spending shown in the first chart above and in the net capital stock data shown in the second chart.   SNZ don’t provide a breakdown between government and private components, but for what it is worth I found this chart interesting.

R&D capex

If anything, R&D spending seems to have been holding up quite a bit better than overall business investment and the business capital stock.  Which tends to reinforce my doubts about why more taxpayer money should be thrown at this type of spending.  Overall R&D spending might be quite low by advanced country standards, but so is business investment more generally, and so is foreign trade.  My hypothesis is that all three things are related, and that there is no obvious reason (and no analysis the government has advanced) suggesting that the root cause of the problem is insufficient subsidies for R&D spending.

On a completely different note, tomorrow I’ll take a lot at the latest from the Reserve Bank: Adrian Orr and the tree gods.


Once were traders

For small countries in particular, foreign trade is a key element in economic prosperity.  Firms in your country develop products and services that people abroad want, and that enables your citizens to consume from the wider range of products and services the rest of the world has to offer.  It isn’t just final products, but trade in intermediate goods and services (inputs to other production) also enables specialisation and the general gains from trade.

Foreign trade wasn’t always important in the islands of New Zealand.  For the centuries after first settlement there was none.  And (although not solely for that reason) the people –  Maori –  were poor.   In modern New Zealand, foreign trade has been critical: 100 years ago there was a widely cited claim that New Zealand did more foreign trade per capita than any other country.  Hand in hand with that, we were among the countries with the highest incomes per capita.

But no longer, on either count.

The latest quarterly numbers out last week did show an uptick in both exports and imports as a share of GDP.  But here is the chart back to 1972 –  annual data, plus the latest quarterly observation.

external trade share

The foreign trade share has been, at best, static for almost 40 years (in most countries they’ve been increasing).  The last few years have seen the trade share the weakest for almost 30 years (and the late 80s construction boom).  I’ve highlighted the only three occasions when exports and imports have averaged 30 per cent or more of GDP: the year to March 1985, the years to March 2000 to 2002, and the year to March 2009.   What was the common feature of those years?   It wasn’t the stellar success of outward-oriented businesses.  It was the (unexpected) severe weakness in the exchange rate: the devaluation of 1984, the period around the end of the dot-com boom when US interest rates were high, and New Zealand (and Australian) dollars were unattractive, and the international financial crisis (and extreme risk aversion) of 2008/09.   Based on the rest of the set of New Zealand policies, those low exchange rates weren’t sustainable, and there was a relatively quick rebound.

What of other advanced countries?

Big countries tend to do less foreign trade (share of GDP) than small countries.  That is no surprise, as there are many more markets and opportunities for specialisation (gains from trading) close to home.  Here are the OECD countries that in 2016 (last year with complete data) had exports and imports averaging less than 30 per cent of GDP.

Australia 21.0
Chile 27.8
Italy 29.0
Israel 28.2
Japan 15.6
Turkey 23.4
UK 29.1
USA 13.3

Of them, Italy, Japan, Turkey, the United Kingdom and the United States are big countries and big economies.    You’d expect to find them on this table, and if anything the anomaly is Germany, with a foreign trade share now in excess of 40 per cent of GDP.

Of the remaining countries, there are

  • Australia, with five times our population,
  • Chile, with more than three times our population, and with the second lowest labour productivity in the OECD (beating only Mexico), and
  • Israel, which isn’t much larger than New Zealand but which –  as I’ve highlighted here previously –  has a similarly lousy productivity growth record.

And all, in one form or another, with severe disadvantages of distance.

There has been a tendency in some circles to excuse New Zealand’s low foreign trade shares by citing distance, but simultaneously a reluctance to take seriously what is implied by that limitation.  If the opportunities for foreign trade from this remote location don’t look particularly good, isn’t there something deeply illogical (or worse) about continuing to use policy (as successive governments have done for last 25 years) to drive up our population –  more people in an unpropitious location?  All the more so when adopting that policy approach also involves driving the real exchange rate up, away from where it would likely settle otherwise.  Not all New Zealanders suffer in the process –  if you run a business geared, in effect, solely towards population growth you may well flourish –  but New Zealanders as a whole have.

For all the occasional talk about rebalancing the economy (from both main parties, at least when they first take office) none of it seems to take any serious account of this constraint.   Which is only set to become more seriously as –  relative to other countries –  the opportunities here shrink with the apparent determination to pursue net-zero emissions targets.  Planting (lots more) is unlikely to be a path to sustained prosperity or higher productivity.

These days, New Zealand’s per capita foreign trade will among the lowest in the advanced world.   Among the rich countries, only (very big) Japan and the United States will be materially lower than us.  It isn’t a mark of a successful economy.  But neither government nor opposition have any real strategy –  or interest? –  in turning things around.

A picture in continuity

Here is a summary chart of the real GDP outcomes for the June quarter (expenditure and production), the hours outcomes (QES and HLFS), and the implied change in labour productivity (real GDP per hour worked), taking the average change in hours worked from the average growth in real GDP.

GDP q2 1

There was quite a bit more activity all round, but it took a larger percentage increase in labour inputs (hours) to get the published percentage increase in output (GDP).  In other words, labour productivity fell: not just the growth rate, but the level.

Here is the same chart for the previous quarter.

GDP q2 2

It was worse: less GDP growth, but also an even larger fall in GDP per hour worked.   Productivity growth for the first half of the year was -0.65 per cent.  That isn’t an annualised number, but an absolute change; a significant fall.

Perhaps you think this just shows how dreadful the new government is.  Here is the same chart showing the cumulative growth rates for the last six months of last year (in blue) and the first half of this year (in orange).

GDP q2 3

To me, the similarities are (much) more striking than the differences.    Importantly, the level of labour productivity fell in both halves.

Looked at from a productivity perspective –  and that really is where one should focus, especially when the unemployment rate is not too far from the NAIRU – it is a pretty dreadful performance.    Of course, simply looking at two six month periods on their own doesn’t tell one much, but nothing in these data is inconsistent with the poor productivity record for some years now.

And neither the last government nor this one appears to have any serious ideas for, or any serious interest in, fixing this failure.


An age of diminished expectations?

The Westpac McDermott Miller consumer confidence survey results are out this morning.  To the extent they get any media coverage, no doubt the focus will be on the headline result.  Here is the summary chart.

westpac 1

In Westpac’s words

Consumer confidence fell sharply in September, taking it to its lowest in six years.

There probably isn’t much predictive value in these results for actual economic data, but I find the results interesting in their own right: how people generally are feeling about their economic fortunes and the economy more broadly.  After all, respondents aren’t just the “ideological enemies” of the government.

The Westpac results don’t seem out of line with the most recent Colmar-Brunton poll (taken six weeks ago) in which respondents are asked a single question.

“And do you think during the next 12 months the economy will be in a better state than at present, or in a worse state?”

colmar brunton

The public no longer seem very optimistic at all.

But in some ways I was more interested in the longer-term trends in a couple of the sub-components of the Westpac index.   For example,

westpac 2.png

People are now less optimistic about improvements in their own personal position than at any time in the last 30 years outside periods when the economy was already in the midst of a recession (and materially lower than in the fairly shallow 1997/98 recession).  And look at the contrast between confidence levels from say 1994 to 2007 (across two different governments) and those now.  It looks a lot like a fairly steady trend decline.

And then there is the question about the longer-term prospects for the economy itself.  Respondents might not know much analytically about the issue, but their perceptions are interesting nonetheless.

westpac 3

The latest observation isn’t startlingly bad (and there was that sharp –  but brief – dip a couple of years ago) but look how diminished expectations are now (last three years or so) relative to the entire history of the series.  There are individual quarters that are weaker (though note, not in the 2008/09 or 1997/98 recessions) but in thirty years there has been no three year period where medium-term optimism has been weaker than over the last three years (under National and Labour governments).   And this pessimism isn’t tied to the last recession –  look how upbeat people briefly were in the couple of years after the recession ended.

(The medium-term picture is less bad in the ANZ’s consumer confidence survey, (which has a much shorter run of data) and it would interesting to know the precise question asked, to help understand that difference.)

Then again, in an economy that has managed very little labour productivity growth in the last five or six years, and none at all in the last three years, perhaps it shouldn’t surprise.

real GDP phw jul 18

In an economy where the promises of economic reform decades ago came to little  (for younger readers, that is the then Minister of Finance back in 1989/90)

caygill 1989 expectations

And where none of the political parties – especially not National or Labour that have led all our governments – seem to care much if at all, or have any serious proposals for turning around the continuing decades of underperformance, isn’t the public quite rational in being much less optimistic than they were?

A more interesting question is why they/we don’t find a way of demanding something better.