In yesterday’s post I included this chart of multi-factor productivity growth data for the 23 advanced countries the OECD produces estimates for.

One always has to be a bit careful about MFP estimates, which are only as good as the model (and labour and capital input estimates) used to calculate them. But when I looked at the OECD labour productivity growth data – same countries, some period – the picture was strikingly similar.
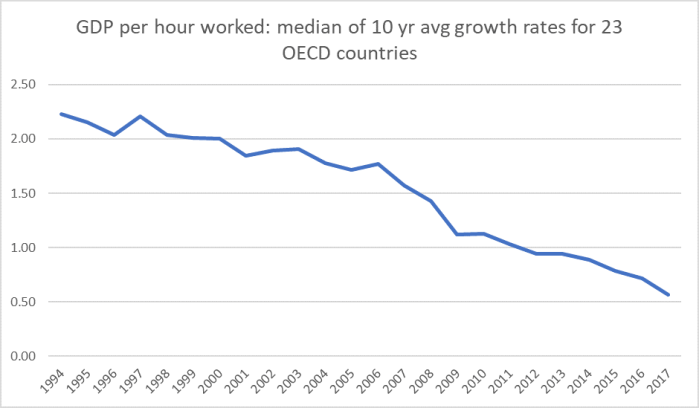
There is, perhaps, more of a suggestion that productivity growth was already slowing before the events of 2008/09, but still a fairly sharp fall-off in the last decade as well.
I used 10 year average data in these charts because (a) Lord King appeared to be focusing on the pre and post crisis periods (it is now roughly 10 years since the crisis), and (b) because, at least for some countries, there is quite a lot of year-to-year noise, which probably only signifies measurement error. But out of interest, here is what those lines look like calculated as five year averages.

There is some sign of a bit of a rebound in productivity growth, especially for MFP. But (a) most recent periods are probably prone to revisions, and (b) even the latest observations are nowhere near the growth rates being recorded 15 or 20 years ago.
Over the most recent five year periods, New Zealand ranked 4th to last for labour productivity growth, and simply last for MFP growth. We managed 0.0 per cent average annual growth in labour productivity (on this measure) over the five years. By contrast, the median average annual growth rate for labour productivity over that period for the eight former eastern bloc members of the OECD was 2.3 per cent.
The OECD MFP data begin in 1984. That just happens to be when the decade of far-reaching economic reform began in New Zealand. When that reform process started New Zealand was already lagging badly behind the advanced members of the OECD: the OECD doesn’t have MFP levels data, but in terms of real GDP per hour worked, ours in 1984 was only about 75 per cent of the median for the 25 countries for which there is data. The reform process was supposed be about catching-up again. (There are a few people who will dispute that last claim, suggesting that it was only really about ending the decline or even slowing it. But even if some of those individuals really were pessimists even then – perhaps because they think the reforms were not nearly far-reaching enough – it was not the way the story was sold, whether by local politicians or international agencies. Here was the Minister of Finance in 1989.)

So how have we done since 1984? On MFP growth
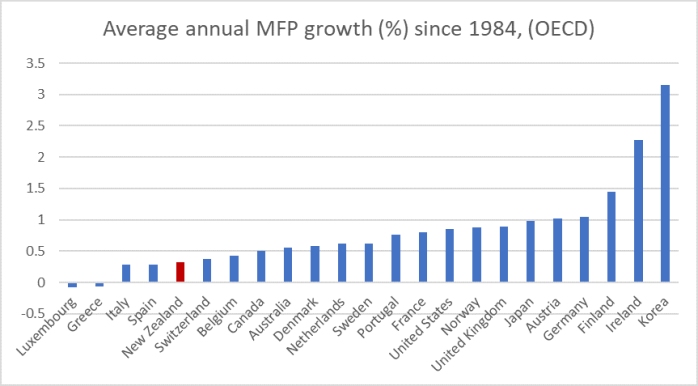
There are (a few) countries that have done worse than us, but not many (and not mostly ohes that represent much to boast about). You’ll either recall, or have read about, the rank inefficiencies in the New Zealand economy in 1984, But since then we’ve lost ground relative to the typical other advanced OECD countries.
It is only one estimate. Labour productivity – GDP per hour worked – is less model dependent and thus a bit more reliably estimated.
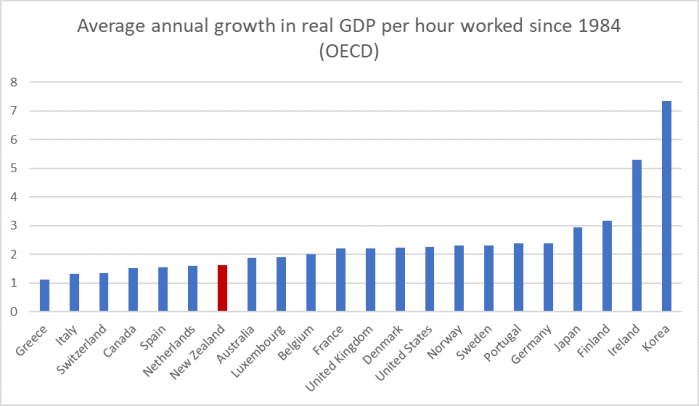
We do a bit less badly on this measure. But the median of these advanced countries – already materially richer/more productive than we were – managed average annual growth of 2.2 per cent per annum over this period while we managed only 1.6 per cent annum. Over 35 years, that amounts to drifting a long way further behind. We are now about 65 per cent of the GDP per hour worked of the median country for which the OECD has data for the whole period.
And one last chart: labour productivity growth since 2000 (when there is data for all of them) of the former eastern-bloc countries and New Zealand.
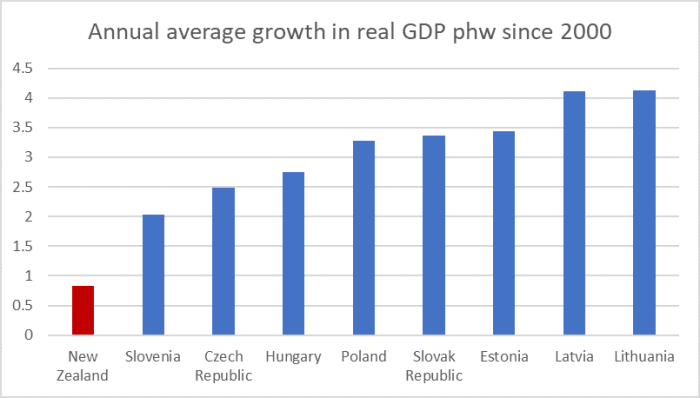
All of these countries were not-very-market-at-all Communist regimes in 1984 (three weren’t even separate countries). Three of the eight now have average productivity levels equal to or exceeding New Zealand (and the worst only lags us by about 15 per cent). But their growth rates are still much faster than ours.
I’m not here to refight the wars over the broad direction of the reforms New Zealand undertook from the mid 80s to the mid 90s. Most of those reforms were sensible – although I’d nominate three important exceptions. But the fact remains that, appropriate or not, decades on we have made no systematic progress on convergence and catch-up, and are actually drifting ever further behind.
But is there any real sign either of our major political parties care, let alone be willing to identify and initiate changes that might finally turn things around? Not that I can see.
There are global problems and failings – where this post began – and we can’t do anything about fixing those. But we could – and should – be doing much better for our own people, starting (as we do) already so far behind.

I think you are missing what market actually is. There are 2 key elements of market behaviour.
1. The market will buy the cheapest product available with a similar product quality or perceived similar product quality
2. The producer will seek to make the most profit out of products that the market accepts ie price the highest and cost the lowest to achieve maximum profit.
The communist regimes in the past were rigid with central authoritarian decison making. But they have learned that if you control every aspect of human decision making then you have logistical failure because communications can’t flow fast enough to respond to market needs. All they have done is removed central government controls over business decisions to meet market needs for products and instead provided funding and subsidies towards where businesses wants to go.
LikeLike
Out of curiosity, which 3 reforms do you consider not-sensible?
LikeLike
Reopening large scale immigration
The RMA – in effect if (arguably) not intent (most of those involved apparently saw it as effective liberalisation
The tax treatment on savings (shift to the TTE model, almost alone in the world)
(With time I’m sure I could find more I disagree with, but the broad thrust – stabilisation and liberalisation – was in the right direction, and often implemented well – eg the broad GST base.)
LikeLiked by 2 people
One strategy would be to identify a wealthy benefactor, someone interested in the long term survival of the country, who is willing to fund the development of the policy proposals, supporting modelling (done properly), and reaching out to a younger generation of politicians and bureaucrats who could conceivably be in power in 10-15 years. The current crop have given up on achieving anything.
LikeLike
Sounds a lot like what Gareth Morgan has tried to do.
LikeLike
Other than killing cats, leaving at least 5 investment properties vacant because tenants dirty his carpets, using his Universal Super to buy a Harley Davidson each year, setting up TOP but refusing to lead and then making what appears to be direct attempts to influence TOP leaders decisions with threats to cut party donations, what has Gareth Morgan done?
LikeLike
Perhaps just all of the most transformative innovations are in the past?
https://www.nber.org/papers/w18315.pdf?new_window=1
With regard to the New Zealand experience, you have previously shared OECD data that suggests the New Zealand labour force has strong capabilities in problem-solving in technology-rich environments (or something similar). Wouldn’t this indicate that the labour component of the New Zealand MFP conundrum is at or near the frontier? (perhaps even in theory rather than practice – and why anecdotally skilled kiwi expats seem to do quite well overseas).
This might be a bit of long bow to draw but what proxies could be used for the relative productive capacity of one labour force versus another?
Hypothetically if the New Zealand labour component is near the productivity frontier then wouldn’t it suggest that the (relatively bigger) issue in New Zealand is the capital component? Which would then merit the question of what is being done to support New Zealand businesses in investing in/or adopting capital (processes, equipment etc.) that is at the frontier? (i.e. accelerated depreciation, lower business taxes, credit guarantees for capital equipment purchases, R&D support etc.).
Your observation that we are so far behind the frontier now should mean that if we were to have an aggressive (i.e. pull out all the stops, maximise the incentives) approach to encouraging businesses to invest in capital then we would ‘close the gap’ with the frontier in due course?
As it is won’t the cycle of underinvestment continue and the problem compound?
LikeLike
Remember Rocketlab, a NZ company previously, now with 8 successful mission space launches from Gisborne? NZ design and manufactured rocket electron engine using the rocket casing based on the carbon fibre tech of the Team NZ Americas Cup races? Oh yes it is now owned by the Americans who paid a cheap $100 million to own the only privately owned space launch facility in the world in NZ. The US company is now worth more than several billion.
ACC paid at least 10 times the original purchase price to now buy into a small percentage of Rocketlab. The funny thing is NZ government provided the first $99,000 research grant to launch Peter Beck’s quest. What concerns me is that the government does not maintain any ownership rights by providing this original seed money?
LikeLike
But then again the government subsidises farming with customs border controls, DSIR reserach and will spend a billion in disease control with no ownership rights.
LikeLike
RE: multi-factor productivity growth data for the 23 advanced countries the OECD
The drop off since 2008 is hardly surprising. The value of money has fallen leaving many zombie companies operating that wouldn’t exist with normal interest rates. Uber & WeWork to name a couple.
LikeLike
But at most that can only be a reinforcing factor, since interest rates are themselves v low for (ill understood) reasons.
LikeLike
Interest rates as low as there is so much debt (money) in the world & thus money has a low value. The world has borrowed future consumption to a massive extent.
LikeLike
I’m not persuaded it is enough of a story. After all, if that were all (or most) there must be lots of great new investment opportunities just waiting for new (unindebted) enterprises to take up. But there isn’t much sign of that. And it isn’t as if interest rates are materially higher in countries where there isn’t huge levels of debt.
And so I’m left searching for a story that is more grounded in changing real fundamentals – things that mean there aren’t great new investment opportunities (the way most MFP gains are actually realised).
LikeLike
“lots of great new investment opportunities just waiting for new (unindebted) enterprises to take up”
There are great new investment opportunities & large MFP gains but its very sectorised. Take Apple & Samsung for example.
“And so I’m left searching for a story that is more grounded in changing real fundamentals – things that mean there aren’t great new investment opportunities (the way most MFP gains are actually realised).”
1) The investment opportunities are being taken up by Uber et al (zombie companies) which are producing low or negative returns (-ve productivity) – they are simply being funded through sales hype and a chase for returns.
2) In the huge US market debt funding is also going into stock buybacks which does nothing for increasing productivity
3) There is considerable money going into property (UK, Aust, NZ & now US again). Most of it is simply bidding up land prices which is totally unproductive.
Also I have concerns about:
a) Whether the way GDP is measured properly captures the productivity gains of us all running around with computers (smart phones) in our pockets.
b) GDP as a measure. It doesn’t by any means capture total social welfare benefit gains
LikeLike
Just on a couple of those: physical investment (that puts pressure on interest rates) in tech companies is fairly small (incremental capital to output ratios appear to be lower than was the case a few decades ago).
I totally agree that GDP isn’t a welfare measure, but as for measurement there have been a fairly wide range of papers in recent years that suggest, fairly conclusively, that mismeasurement isnt the explanation for the productivity growth slowdown. Consistent with that, nominal GDP growth (with fewer measurement problems) has also slowed.
LikeLike
Two issues: why have the developed countries stopped increasing their productivity and the second issue why has NZ failed to keep up.
Increasing productivity is equivalent to acceleration; the western world has reached a good speed and needs go no faster; the things we want are available and attainable. In the past only the wealthy owned a horse and books now even beneficiaries have vehicles and phones capable of accessing all recorded knowledge. There is a discussion to be had about distribution of the wealth but I know my grandparents if alive would look at my family’s lower middle class lifestyle in Auckland with astonished wonder. There is also a loose link between our high productivity and our destruction of our ecosystems and the planets finite resources. So the issue of declining world productivity is a matter of intellectual curiousity only.
The second issue is important; NZ is trailing behind and that means in a globalised world that our most energetic are leaving NZ. I am advising my most successful daughter to look for work overseas. But it is not just the graduates with work experience who are leaving; I know of a handful of relatively unqualified Kiwis who have chosen to work in Australia – their one common attribute: highly responsible hard workers
.
There is little reason why New Zealanders should produce less per hour than the French. The only obvious difference I could detect was the French take long lunches of very good food. As per a previous comment whatever is wrong with NZ productivity it will not be put right by some magic bullet but it might if like our nations rugby it was the central focus of our society and especially our politicians.
My contribution to the debate which barely exists on other than on this website is to restrict all entries on our honours list to those who have proven to be world leaders: so a few sportsmen, fewer scientists, very few businessmen/women and no politicians.
LikeLike
The french have factories to automate. We do not.
LikeLike
There is considerable money going into property (UK, Aust, NZ & now US again). Most of it is simply bidding up land prices which is totally unproductive.
I think a large part of issues around GDP per head and GDP growth relates to property and housing in particular.
Whilst these numbers maybe a bit rough consider the following;
The RBNZ says the NZ residential housing stock is valued at $1,131,286 or $1.131t at June 2019 verses a GDP of around $300bn or 3.7x GDP
Compare the US numbers again possibly a bit rough US housing stock is valued at around $25.8t verses GDP of around $21t or 1.22x GDP
NZ housing investment is way out wack and serious policy adjustments are need to address the issue, unfortunately change is unlikely to happen until we are confronted with a crisis.
LikeLike
NZ Housing stock might be worth $1.13 trillion but it does not represent monies going into property. It is a market valuation ie what the market is prepared to pay not what the market has paid.
LikeLike
In addition, for every buyer there is a seller.
If anything, given our population growth, there has been too little real investment in (building new or extending) houses.
LikeLike
The housing stock value is a combination of two parts the construction cost of new stock and the value of existing stock, this value is established by market by transactions which involve real money i.e cash and debt. We buy and sell a lot of housing many of theses transactions are driven by speculation. The point I am making is NZ invests of high percentage of the national income into housing at the expense of other productive enterprises, sure we all need a house but at the end of the day it’s essentially largely non productive consumption, and yes immigration is part of the equation, some research questions the actual long term benefit of this much of his immigration.
The existing rules make it very difficult to build large scale affordable housing, we get the opposite.
Earlier posts by Michael have made reference to the reasons for our inflated house prices, the RMA, planning regulations, land available etc. House inflation might make the owners richer but not the nation relative to the rest of the world.
LikeLike
Colin, Sales agents commissions last year was approx. $1.5 billion. Say that represents 4% which makes the total residential buy and sell approx $39 billion. As Michael says there is a buyer an a seller therefore the transaction volume is half which is $19.5 billion a year actually invested but for most people they are trading an existing house which is a non funds transaction.
NZ Net Disposable Income is around $180 billion and total GDP is around $280 billion.
Residential housing trading only represents 10.8% of NZ net disposable Income and 14% of total GDP.
I think you are exaggerating residential housing as an issue. Our problem is under investment in housing rather than over investment. People do not sleep on the streets, in cars and in garages because of over investment in housing.
LikeLike
I am looking at a 6 unit development development in Otahuhu. Connection to public sewerage is available which is good but the closest public storm water access point is 30 metres away and across a main road which I have to seek permission from NZ transit to dig up a public road and hold up traffic. I estimate the public storm water extension I have to pay is $100k which I have to complete and gift to Auckland Council. This is because Auckland Council has not invested in public drains, they make the developer pay for a public service which my neighbours can connect for free. This fee is on top of the extra Development Levy which could be another $100k.
LikeLike
Last graph: watching video with Helen Clark Aljazera. … ” lead a period of high economic growth 1999 to 2008
LikeLike