Yesterday’s short post – which countries were rich or highly productive in 1900 and which are now – wasn’t really about New Zealand at all (it was an article about the US and Argentina that prompted me to dig out the numbers). But it prompted a question about New Zealand from a reader that sent me off playing around with the relevant spreadsheets again.
The question was along the lines of when were we at our economic peak (relative to other countries) and, given that we no longer are what it might have taken, in terms of different growth rates, for us to match the leading group now.
As a reminder, for historical periods the standard collection of reference data is that by the late Angus Maddison. He collated estimates of real GDP per capita for a wide range of countries. The numbers are only as good as the estimates made by the researchers Maddison drew from. Perhaps they could be improved on – some researchers have tried for individual countries – but for now they are still the standard starting point. For more recent decades, I prefer to use real GDP per hour worked estimates (which will tell more about an economy’s productive performance, the wage rates it will support etc), either from the OECD or the Conference Board (the latter for a much wider range of countries).
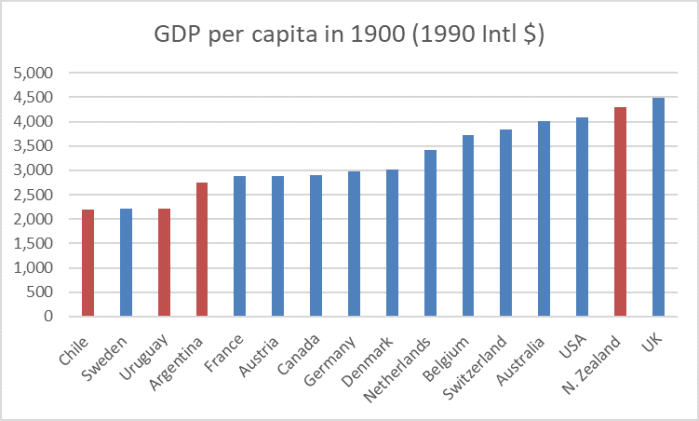
My first chart yesterday was the top group as at 1900 – a date chosen just as a nice round number.
The top five countries on this chart were the top five pretty much all the way from about 1890 to just prior to World War Two. Here is how New Zealand did relative to (a) the median of those five countries, and (b) to the country that would emerge after World War Two as the clear leader, the United States.
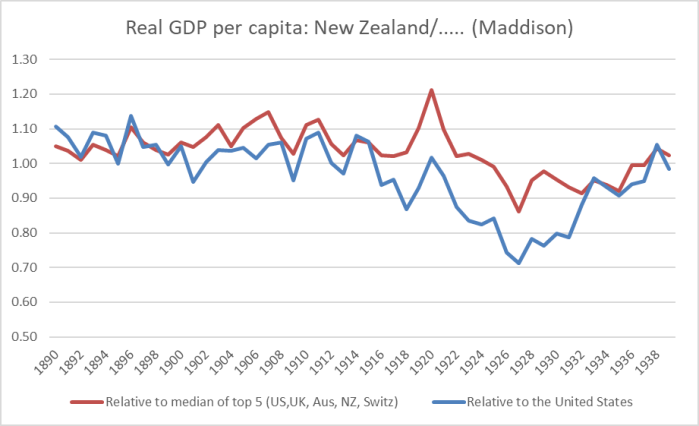
There is a bit of noise in the year-to-year estimates (particularly those for New Zealand), so I’m not putting any weight on that 1920 peak, But abstracting from year to year noise the picture is reasonably clear. Relative to this group of countries – highest incomes anywhere at the time – New Zealand did just fine in the quarter-century to the start of World War One. We were, there or thereabouts, right up with the very richest. On these estimates, the number one slot moved around among the UK, the US, New Zealand and Australia.
Wars are dreadful things. But they tend to be relatively less bad for countries producing food and wool, and not facing any physical destruction to their own country. Even better perhaps for distant neutrals, as the US was until mid-1917.
New Zealand’s relative decline in the 1920s is notable (and not inconsistent with a story I’ve run for some years, about the lack of any really favourable idiosyncratic productivity shocks favouring New Zealand based industries, of the sort we’d had in the 30-40 years prior to World War One).
But perhaps what is interesting is the recovery – especially relative to the United States – in the 1930s. In 1939, for example, we were basically level-pegging again with this top group of countries – a touch behind the US (No. 1), a touch ahead of Switzerland (No. 2).
Was everything then fine as late as the start of World War Two? I’d argue not. First, business cycles matters and don’t always run in phase across countries. The United States, in particular, was very slow to recover from the Great Depression. Here is the unemployment rate
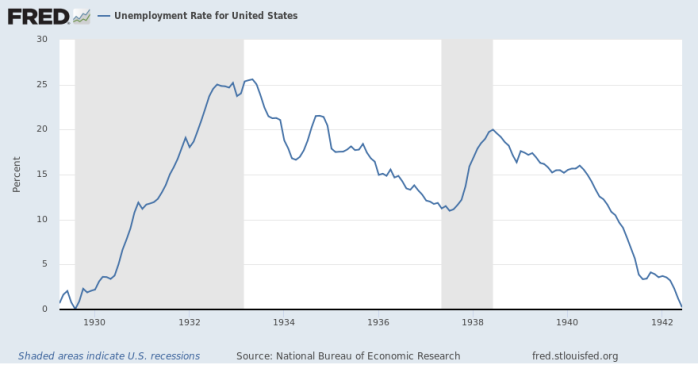
That is an unemployment rate in excess of 15 per cent at the end of the 1930s. In New Zealand, by contrast, the unemployment rate had been under 6 per cent as early as the 1936 census and the numbers registered as unemployed dropped away very sharply in the following few years, especially in 1938.
I was reading the other day an academic volume The Macroeconomics of Populism in Latin America, and was rather struck by the parallels between New Zealand in the late 1930s and some of the Latin American case studies (from the 70s and 80s). Most of those experiences ended very badly. New Zealand authorities were running very expansionary policies in the late 1930s which certainly boosted GDP and employment in the short-run, but culminated in the imposition of extensive foreign exchange controls at the end of 1938 and would almost certainly have ended in a highly public debt default in 1939 or 1940 if we hadn’t been – as it were – “saved by the war” (first, the British desire to avoid serious ructions in the run-up to the war, and then the intensified demand for our primary exports etc once the war began).
Consistent with that story is that after the war, when all three economies were pretty much fully employed – and none had been directly physically affected by the conflict – New Zealand’s GDP per capita was well behind (10-20 per cent depending on the precise year and country) those of Switzerland and the United States. Our heyday really had been the pre World War One period.
The second strand of my reader’s question really related to how far behind we now are.
Here was my second chart from yesterday, showing the top-20 real GDP per hour worked countries (from the Conference Board database) in 2018.
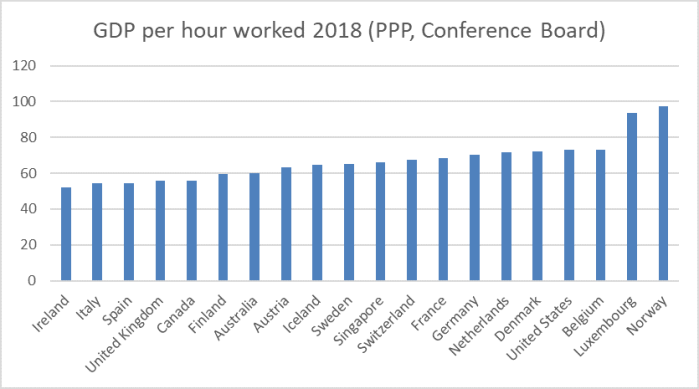
I’m happy to set aside Norway (markedly boosted by oil/gas) and Luxembourg (city state with some material tax distortions) and focus on the next group of countries (Switzerland to Belgium) I’ve highlighted here in various posts. On this measure, the median real GDP per hour worked exceeds that of New Zealand by 68 per cent.
New Zealand implemented a huge range of policy reforms in the late 1980s and early 1990s. The aspiration was to make material inroads on closing the gaps that had opened between New Zealand and the OECD leaders. Sadly, the gap has actually widened. 1990 is a common starting point for comparisons – not only was it well into the reform period, but it was just prior to the New Zealand (and other advanced country) recession of 1991, so comparisons are not messed up but that particular cyclical issue. In 1990, the median of that group of seven leading OECD countries was “only” 56 per cent ahead of New Zealand.
But what if things had been different? How much more rapid productivity growth (than we actually experienced) would we have to have had since 1990 to have caught up with this leading bunch? That is 28 years. We”d have needed productivity growth that was 1.85 percentage points faster on average, each and every year.
Would that have been possible? Who knows. 28 years seems a bit ambitious. But I did have a quick look at the data for some emerging OECD countries. Over the last 20 years or so, these countries have had productivity growth rates (on average over that long period) in excess of 1.85 percentage points above those of the median of that “leading bunch” of OECD countries: South Korea, Lithuania, Poland, and Slovakia.
Would it have been possible for us? Who knows? Would it be possible now, for the next 25 or 30 years? I don’t know. Personally, I’d be a bit surprised if we could close the gap that quickly, or fully. But for now we are still going backwards (relatively)…..as we have, more or less, for 100 years. And there seems no great sense of angst, unease or urgency among any of political parties, or the economic establishment.
What a diminished legacy for the next generation.
