Wages and profits

There was a story buried deep in the Dominion-Post this morning that caught my eye.   The heading was “Profits up as wages stand still“,  and the article was prompted by the release yesterday by Statistics New Zealand of some summary results from the Annual Enterprise Survey.

In their media release yesterday, SNZ –  true to their apparent policy of accentuating the positive – was at pains to highlight the increase in profits over the 2015/16 year.   Overall, operating profits in the business sector had risen by 8.6 per cent –  rather faster than the increase in nominal GDP.

But it was this chart in the SNZ release that caught my eye

profits AES

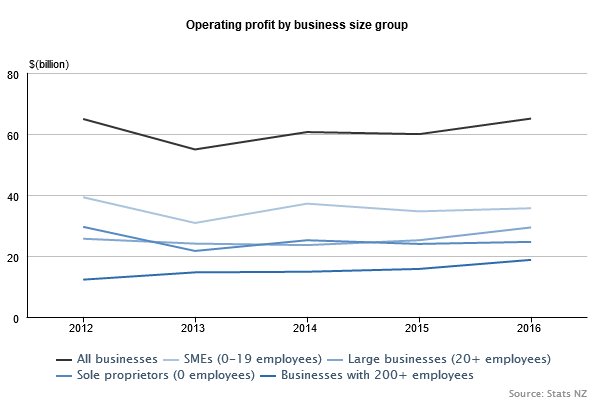
Profits had certainly increased quite a bit  in 2015/16, but look at that top line.  Total profits in 2015/16 were no higher ($bn) than they had been in 2011/12, and yet over that period nominal GDP had increased by just over 17 per cent.  On this measure, profits as a share of GDP would have fallen quite a bit over those four years.

In the Dom-Post article,  the journalist had juxtaposed the increase in profits over the last year with the very weak increase in wages, at least according to the Quarterly Employment survey.  Lobby group representatives were quoted in a fairly predictable way.

Council of Trade Unions economist Bill Rosenberg said the statistics were more evidence that the share of income going to wages and salaries was falling.
“That indicates wages are not keeping up with what the economy’s income could actually afford.”
The share of income going to wages in New Zealand was low internationally, he said. “To see it fall further is very disturbing. It is an indication we are a low-wage economy.”

and

Kirk Hope, chief executive of BusinessNZ, said the increase in company profits meant jobs were more secure.
It was also positive for “the many thousands of New Zealanders”, including Kiwisaver investors, who now owned shares and who would be receiving increased dividends, he said.
“Wage growth is not the only responsibility companies must address.
“A proportion of company profits must be reinvested to safeguard the future existence of the company; without that investment there will be no ability to maintain or grow jobs.”
Business profits can jump around significantly from year to year, but even taking a longer-term view, Statistics NZ figures show they appear to be greatly outstripping pay rises.

And when the journalist did take a long-term perspective, he looked at profit increases since 2009, and compared them to wage increases since then, even though 2009 was the worst of the severe recession, and profits are typically much more cyclically variable than wages.

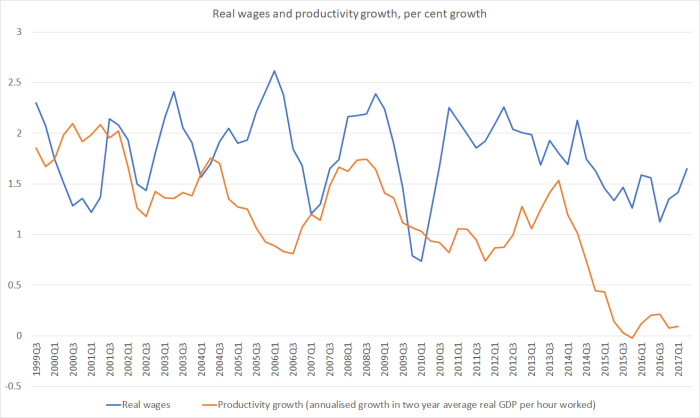
But, as I noted in a post the other day, if one uses the more-stable and better-constructed Labour Cost Index measures, it looks as though real wages in recent years have been materially outstripping the (non-existent) productivity growth.    Real wage inflation hasn’t been high in absolute terms, but it has been a lot faster than any gains in productivity.

real wages and productivity growth

In the wake of that post, I’d also gone back and dug out from the national accounts the data on the wages and salaries (“compensation of employees”) share of GDP.    The data go all the way back to 1972.

COE

Broadly speaking, the national accounts suggest that the labour share of GDP has been increasing for almost 15 years now (the latest data are the year to March 2016).    Even from the peak of the last boom (year to March 2008) to now, the labour share of GDP has increased a bit further.

And it isn’t because more people are working more hours.   Here is a chart of hours worked per capita.

hours per capita

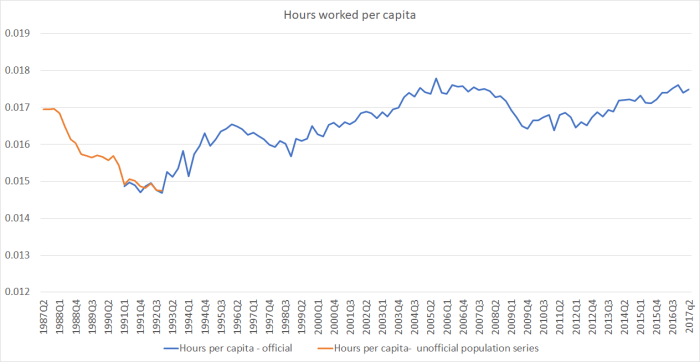
Total hours worked per capita are still slightly below the previous cyclical peak.   To the extent that the labour share of GDP has been increasing, it looks to have been a result of relatively good (relative to productivity) increases in wages.

As for profits, they are (more or less) the inverse of the labour share of income: they’ve been falling over the last 15 years.

Overall economic performance remains dismal, redeemed only by the strength of the terms of trade.  But relative to that disappointing performance –  weak productivity growth, growth skewed to the non-tradables sector –  labour (as a whole) doesn’t seem to have been missing out.

Land prices on the developable fringe of Auckland

It is now pretty well-recognised that local authority zoning decisions can materially affect land values, creating an artificial scarcity in developable land and driving up the price of such land relative to the price land would otherwise command for alternative uses.    The best-known empirical study on this effect around Auckland (and the metropolitan urban limit in particular) was by Grimes and Aitken, summarised as follows:

We capture the impact of the MUL boundary on land prices by separately allowing for land which is: (i) well inside the MUL boundary,(ii) just within the boundary, (iii) sitting astride the boundary, (iv) sitting just outside the boundary, (v) sitting just a little further beyond the boundary, and (vi) sitting well beyond the boundary. We find a boundary land value ratio of between 7.9 and 13.2 (i.e. land just inside the MUL is worth around ten times more per hectare than land just outside it)

In a well-functioning liberal market, one might normally suppose that developable land on the periphery of an urban area would trade for around the value of that land in its best alternative use – typically agriculture.   If it went for much more than the agricultural use value, most farmers would be well-advised to sell, and they would do so until the prices in the alternative uses were more or less equalised.   The median sale price of dairy land is around $50000 per hectare.

Everyone knows that that is not remotely how things are in our highly distorted market.  But sometimes concrete examples bring home the point more starkly.

The other day a reader who knows something about property sent me a copy of a real estate agent’s newsletter on recent land sales in Dairy Flat, an –  as yet –  largely undeveloped area between Albany and Whangaparoa/Orewa, which is apparently classified as a “future urban zone”.    As my reader noted, the area does not yet have wastewater connections, so in his words “it is ages from development”.     Here were the sales in  July.

Total price ($) Parcel size (hectares)
1950000 1.557
1478000 1
2450000 2.493
2976000 3.189
1250000 0.303
1950000 0.9809

The average price of this land was $1.266m per hectare.

In our subsequent exchange, my reader noted that the value of this land for agricultural purposes might not be much more than $30000 per hectare.  He went on to point out that not that long ago 3800 hectares of forest land –  a little further inland than Dairy Flat, but similar terrain and a similar distance from central Auckland – had sold for $1700 per hectare.    In other words, the preferentially-zoned Dairy Flat land was selling as 750 times the price of the forest land.

Perhaps $1.266m per hectare doesn’t sound too bad.   But this is the unimproved value of the land –  none of any relevant earthworks have been done, no suburban streeets been formed, no development levies incorporated.  Even the holding costs for the few years until development actually occurs won’t be trivial (at, say, a low end estimate of a 10 per cent per annum cost of capital).  By the time tiny suburban sections are being sold to potential residents, they will have to be very expensive to cover the costs of someone now paying $1.266m per hectare.

And most of this “value” is simply added by politicians and bureaucrats drawing lines on a map.  It is obscene, and unnecessary.  It continues to skew the game against the young and those on relatively low incomes and/or limited access to credit, in favour of those who already have, or who can lobby councils to draw the lines in suitably limited places.

And, although I don’t have a time series of this sort of data, it doesn’t speak of any confidence among those actually buying and selling land right now that the next government –  of whatever political stripe – will make much difference in sorting out the shameful disgrace that is the New Zealand housing and urban land market.    I’ve long been sceptical, but these people are putting real money on such a call.  Perhaps they’ll be wrong and lose the lot.   But what reason is there to believe that is likely, when not one of our major political figures will even suggest that much lower house and land prices would be a desirable outcome towards which their party would be working?