Having written last Friday on some of the differences in unemployment rates by age cohort, I got curious about the HLFS data broken out by ethnicity. I’ve never paid much attention to it – much of the data hasn’t been published for long, and my main interest has always been macroeconomics (the whole economy, rather than specific outcomes for particular subgroups).
But many of the ethnic differences are stark. Here, I will mostly focus on those between those identifying as European and those identifying as Maori.
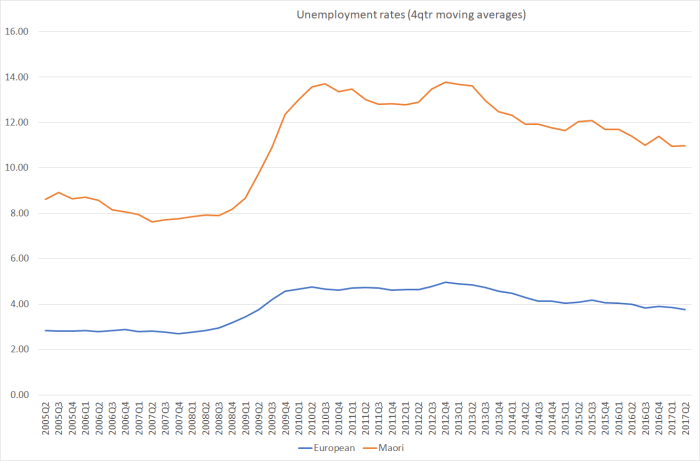
Take the headline unemployment rates for example (the longest run of data I could find on Infoshare).
or the underutilisation rates
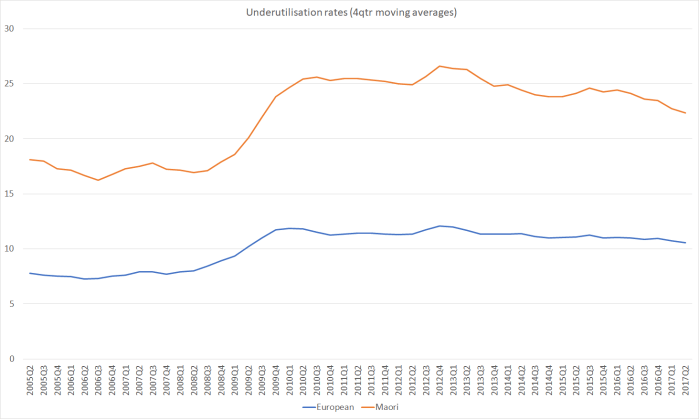
The European numbers are bad enough – 10.5 per cent of the labour force underutilised – but the Maori numbers are astonishing. 22.4 per cent of the Maori labour force underutilised is a sad reflection of (probably) a whole series of failures. Perhaps because the numbers are so large, the gap between the Maori underutilisation rate now and that prior to the recession is visibly stark.
As I illustrated last week, labour market characteristics differ quite a lot by age cohort, and the Maori population is, on average, quite a bit younger than the the European population (both because of higher birth rates and because of lower life expectancy).
But even when one looks by age cohort, the differences between Maori and European outcomes are stark. Overall labour force participation rate of Maori and Europeans aren’t so very different – on average over the last three years, 67.2 per cent of working age Maori were in the labour force, and 70.2 per cent of Europeans. But here are participation rates by age cohort for the two ethnic groups.
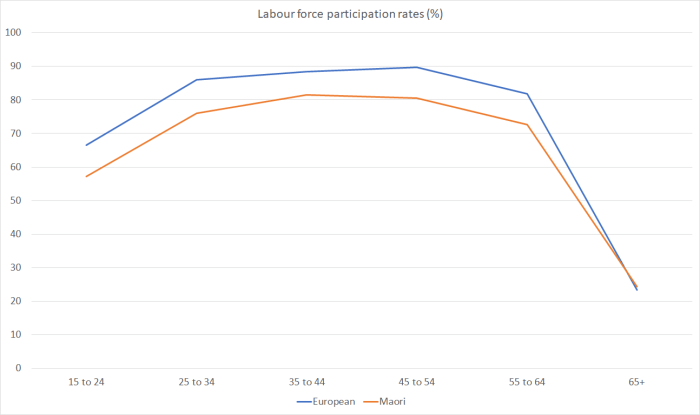
In every cohort, except the 65 plus group, the European labour force participation rate is materially above that for Maori – on average by almost 10 percentage points. I’m not sure what to make of the 65 plus group, where Maori and European participation rates are almost equal. It may be, at least in part, a reflection of greater Maori relative poverty (less success in building up wealth over earlier years).
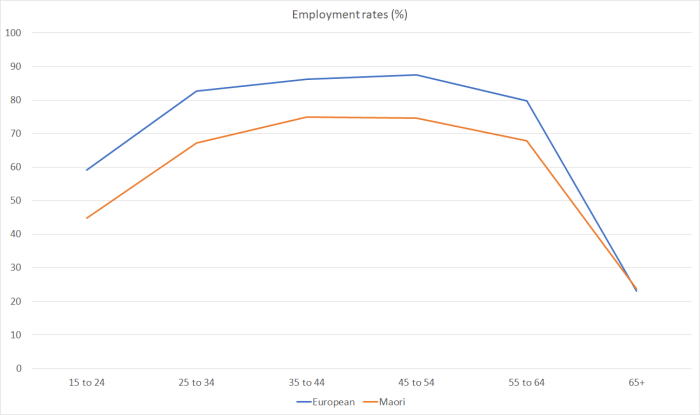
The picture is even more stark if one looks just at employment rates (given that Maori unemployment rates are higher).
Focusing in on young people, here is what the data show people aged 15 to 24 are doing (again averaged over the last three years).
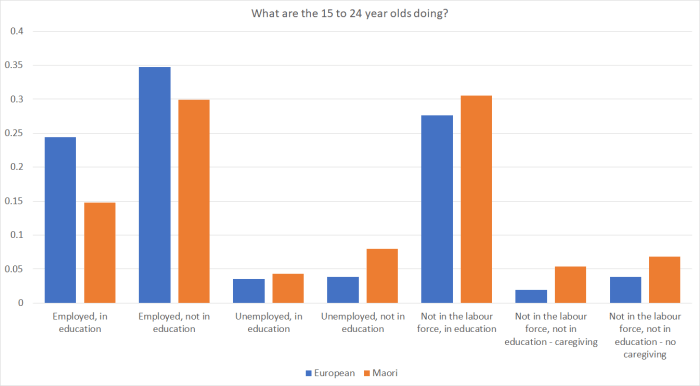
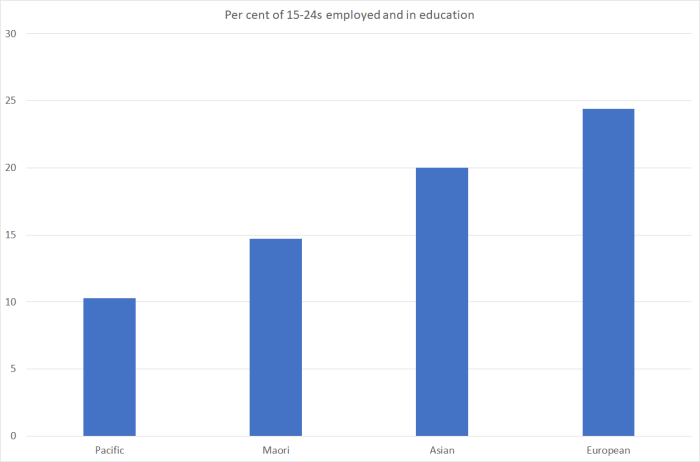
Interestingly, a slightly larger proportion of the the Maori young population are in education and not simultaneously in the labour force than is the case for young Europeans. Perhaps the most visible difference on that chart is the first set of bars – the much larger proportion of European young people simultaneously working and studying than for Maori. Here is a chart (over the same three years) of that one component for each of the four ethnic groups SNZ reports the results for.
I did notice the difference in the “not in education, not in the labour force – caregiving” proportions. Here is that chart for each of the four ethnic groups.
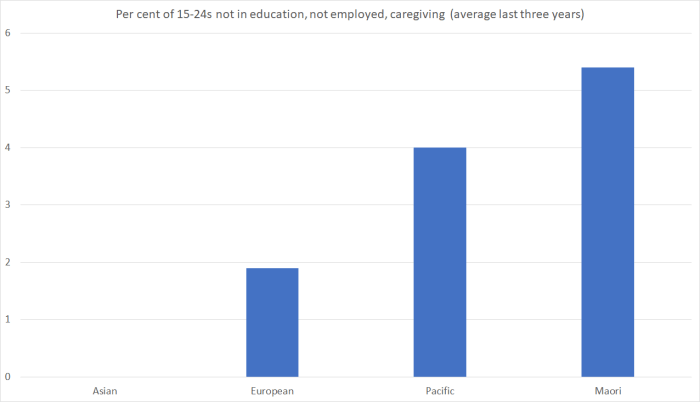
SNZ reports no (statistically significant) numbers of young men in this category. In other words, around 11 per cent of young Maori women are engaged in full-time caregiving (presumably mostly for young children), doing no study or even an hour’s paid work (the HLFS criterion) a week. By contrast no (statistically significant numbers of) young Asian women are.
I’m not going to attempt to hypothesise about why the differences in these various charts (or various others in the data) exist. But none of the gaps strike me as things simply to be relaxed about. Says he who is – contentedly – not in the labour force, not in education, and is caregiving children.
