I had things more interesting (at least to me) to write about today, but I heard the Minister of Finance on Morning Report talking up the alleged strength of the New Zealand economy, noting that we were now – in some way or another – doing what south-east Queensland had done previously, becoming all that we always wanted to be, and so New Zealanders weren’t fleeing the country any more. He was careful not to suggest that the diaspora is coming home – they simply aren’t, and haven’t at any time in the 40 years since the large trend net outflow began. As if it is somehow relevant to current New Zealand immigration policy debates – and recall that immigration policy is about non-citizens – he and others keep telling us “but they could”. It can happen. It did to some extent in Ireland, but it happened there after they structurally transformed their economy and successfully lifted their productivity performance. There is no sign of such a successful transformation here, whether under this government or the long run of its predecessors.
I’ve run this cartoon before
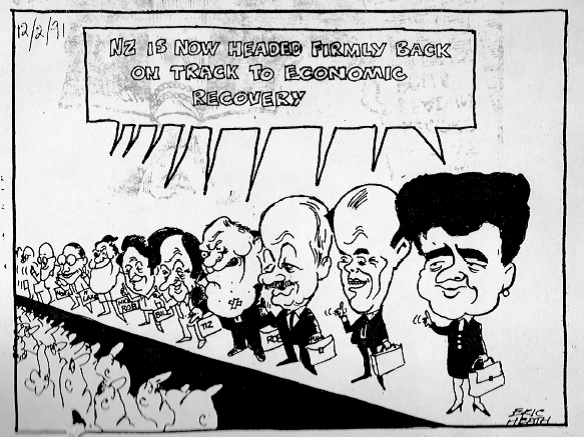
As I noted, since this was first run in early 1991
…. we’ve had Bill Birch, Winston Peters, Bill English, Michael Cullen, and Bill English again, and although we’ve had plenty of cyclical ups and downs, never at any time have we looked like successfully or sustainably reversing our relative economic decline.
And now we can add Steven Joyce to the list.
But what about those net migration flows to Australia that the Minister was talking about?
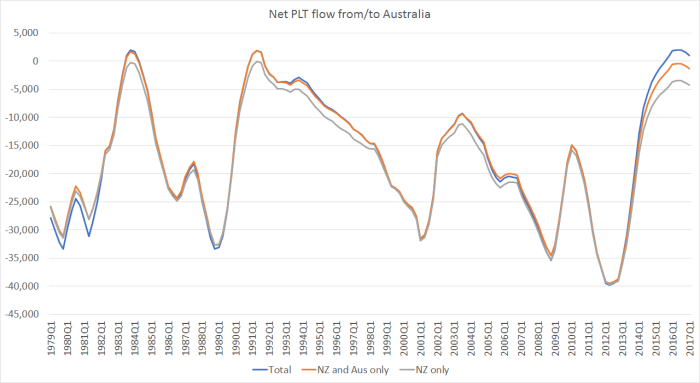
Going back 1978/79, I’ve shown three different measures of net outflow here:
- New Zealand citizens only
- New Zealand and Australian citizens (the group not requiring specific approval to move trans-Tasman)
- all citizenships
Mostly the patterns are all but identical, and dominated by fluctuations in the movement of New Zealand citizens. That makes sense: New Zealanders are free to move, and New Zealand has been materially poorer than Australia throughout this almost 40 year period. And over that period, there is no very obvious change in the trend – just large average outflows, but very large cyclical fluctuations in those net outflows.
It is interesting that right at the end of the chart there is some divergence. Over the last year, for the first time in 40 years, there has been a net inflow of around 2000 non New Zealand/non-Australian citizens from Australia. I’m not quite sure why that is, but it is broadly consistent with the theme of this post. Given a choice between going to Australia or staying in New Zealand, not many people tend to go when the Australian labour market is weak. Over the last 12 months, a net 4206 New Zealanders left for Australia, but that is a lot lower than the average of around 25000 in a typical year.
In that chart above there have been five episodes when the net flow to Australia (on any of the measures shrunk a lot for a period). The peaks were around:
- 1982/83
- 1991
- 2002/03
- 2009/10
- the present.
And here is a chart of Australia’s unemployment rate.
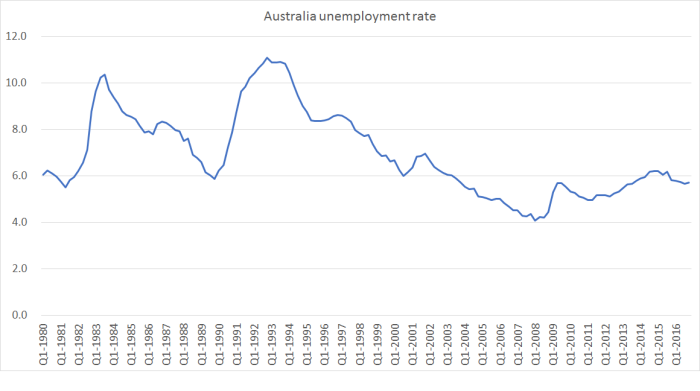
It shouldn’t be any great surprise that all those temporary reductions in the net outflow to Australia coincided with periods of increased unemployment in Australia. If anything, the Australian unemployment rate looks more important as an explanatory factor than, say, the difference between the New Zealand and Australian unemployment rates. In 1991, for example, both countries had very high unemployment – and at present both countries have unemployment rates well above pre-recession levels.
The greater importance of the Australian unemployment rate shouldn’t be a surprise. New Zealanders don’t need to have a firm job offer, or advance approval, to move to Australia. They can do so “on spec”, looking for work once they arrive. But a typical person will be much less likely to take that risk if the search process in Australia is going to be long and arduous and might fail altogether. And the risks have increased over the years, as Australian first tightened access to welfare for New Zealanders living in Australia, and then as people become more aware of the rather limited entitlements New Zealanders have there, even if they have been in Australia for some years.
It isn’t a mechanical relationship of course. And the Australian unemployment rate now – at around 6 per cent – is a lot lower than it was in those 1983 and 1991 peaks. But since the wage gaps between New Zealand and Australia haven’t narrowed at all, and the productivity gaps have continued to widen, it seems only prudent to assume that as and when the Australian labour market improves, the net outflow to Australia will resume in something like full historical numbers.
In the repeated burble from the government about the alleged strength of the New Zealand economy, it is often overlooked that while our unemployment rate is not high in absolute terms it is still well above what we experienced pre-recession, and more so than is the case for most other advanced countries that have control of their own monetary policy. And Australia is in much the same position,
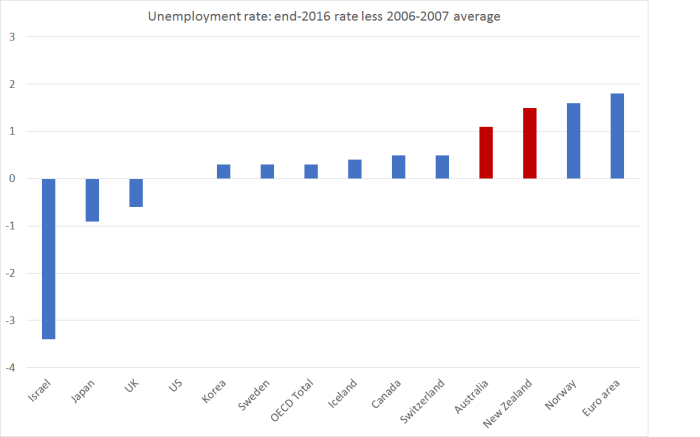
And even most of these countries largely ran out of conventional monetary policy room. Neither New Zealand or Australia did. Neither labour market is that strong. Against that backdrop it shouldn’t really be surprising that the outflow to Australia has temporarily slowed. It doesn’t reflect any credit (or discredit for that matter) on our government. It looks like mostly a cyclical issue in Australia. An easier stance of policy by the Reserve Bank of Australia – which would have been warranted with inflation persistently below target – would probably have seen rather stronger outflows even over the last couple of years.
UPDATE: Just to reinforce the point about Australian unemployment, here is an ABS chart from a few months ago highlighting how their underemployment measure has not fallen even as the official unemployment rate has.
Graph 1, Unemployment and Underemployment rate, November 1980 to November 2016
