I have to spend the morning on the gruesome business of trying to make progress in unpicking 20 years of mismanagement of the Reserve Bank pension fund, dating back in some cases almost 30 years. So this morning’s post will be short.
First, the latest update of my quarterly chart of real per capita tradables and non-tradables GDP. Regular readers will recall that this is a rather rough proxy – first developed by the IMF when they were highlighting New Zealand imbalances more than a decade ago. For these purposes, the tradables sector is the primary and manufacturing components of production GDP, plus the exports of services from expenditure GDP. The rest of GDP is treated as non-tradables. Both series are indexed to 100 in the first quarter of 1991, which is when the official quarterly population series begins.
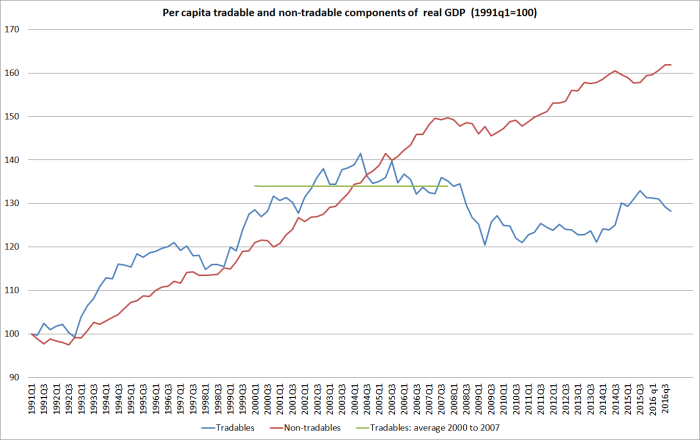
It isn’t a pretty picture. There has been no growth in real per capita tradables sector GDP (on this proxy) for 17 years. The peak in the series was in 2004, and if anything it has been trending down since then. A year or two ago, it looked as though some sort of rebound was underway – all those tourists and foreign students – but even some of that growth has been reversed in the last few quarters. Successful economies – ones that catch up with the leaders, which record strong productivity growth – tend to be those with relatively fast-growing exports, and strongly-performing tradables sectors. A reasonable interpretation of what has gone on is that whatever factors led to the exchange rate being so persistently high – since around 2003/04 – will have accounted for the weak tradables sector performance.
Once upon a time, while I was at Treasury, we had someone do similar charts for a wide range of OECD countries. I’ve only done one for Australia. Here is what it looks like – same definition, based to the same date as the New Zealand one, and on the same scale.
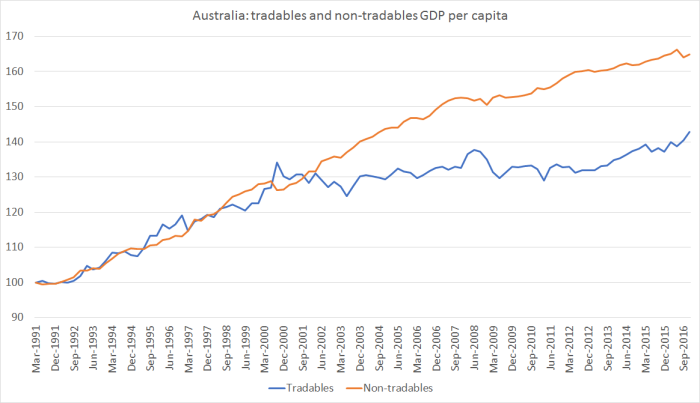
Australia didn’t see much growth in real per capita tradables sector output over the 2000s. In a way, that wasn’t surprising. They had a huge terms of trade boom, which gave them more income to spend, without needing to produce any more tradables to sell abroad. And they also had a massive business investment boom – increasing future production capacity in the minerals sector – which will have squeezed out tradables sector production during the investment phase. But over the last five years, growth in real per capita tradables GDP has resumed again – even growing a bit faster than the non-tradables sector. Perhaps (but only perhaps) there is some connection with the divergent labour productivity performance in the two economies in recent years.
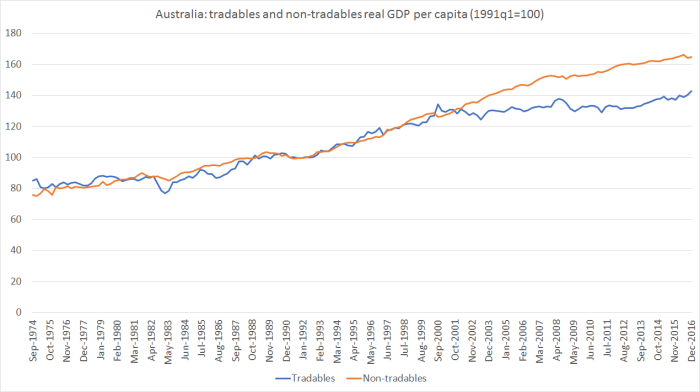
And for anyone wondering if the performance in the 1990s, when tradables and non-tradables production more or less kept pace, was unusual, in Australia (but not in New Zealand) there is the data to do the tradables/non-tradables GDP chart all the way back to the mid 1970s. Here it is.
The sort of pattern we’ve seen – 17 years of no per capita growth in the tradables sector – doesn’t look like the sort of feature one expects in a successful economy, poised to catch up with the rest of world, reversing decades of relative decline. Sadly, of course, New Zealand hasn’t been such an economy. On current policies, there is little reason to expect anything very different in the foreseeable future.
