There is a small OECD country whose export commodity prices surged prior to the 2008/09 recession, and again in the years after that recession. It has grappled with high and rapidly rising house prices – some of highest ratios in the world – and high and rising levels of household debt. It wasn’t New Zealand I had in mind, but Norway.
There has been a lot of talk from those opposing further OCR cuts of how countries everywhere are struggling to get inflation up, as if meeting New Zealand’s inflation target was either (a) a lost cause, or (b) not something we should be bothered about anyway.
So I found Norway’s experience interesting.
The Norwegian government has set an inflation target for the central bank:
The operational target of monetary policy shall be annual consumer price inflation of close to 2.5 per cent over time
They have all the usual ‘outs’
In general, direct effects on consumer prices resulting from changes in interest rates, taxes, excise duties and extraordinary temporary disturbances shall not be taken into account.
So far, so conventional. The precise words are a bit different, but the gist is no different from New Zealand’s Policy Targets Agreement – ours focused on 2 per cent inflation, and theirs on 2.5 per cent.
And, much as the Reserve Bank used to, the Norges Bank recognizes that there is no one foolproof indicator of underlying inflation
There is no one indicator that provides a precise picture of underlying inflationary pressures in all situations. Different measures of underlying inflation are discussed in Monetary Policy Report.
In fact, they include on their website a nice summary table of four different measures
And here is how they’ve been doing.
Inflation indicators
CPI CPI-ATE CPIXE Trimmed mean 1) Weighted median 1) Jan.16 3.0 3.0 2.6 ND ND Dec.15 2.3 3.0 2.6 2.3 2.2 Nov.15 2.8 3.1 2.8 2.5 2.4 Oct.15 2.5 3.0 2.8 2.4 2.3 Sep.15 2.1 3.1 2.9 2.4 2.3 Aug.15 2.0 2.9 2.7 2.3 2.4 Jul.15 1.8 2.6 2.5 2.1 2.4 Jun.15 2.6 3.2 3.1 2.3 2.4 May.15 2.1 2.4 2.4 2.1 2.3 Apr.15 2.0 2.1 2.1 2.1 2.5 Mar.15 2.0 2.3 2.3 1.9 2.4 Feb.15 1.9 2.4 2.3 2.0 2.3 Jan.15 2.0 2.4 2.4 2.0 2.1 1) Owing to Statistics Norway’s changes to the statistical structure at a detailed level, estimates for January 2016 are temporarily unavailable.
ATE excludes tax changes and energy products
XE excludes tax changes and (estimated?) temporary changes in energy prices.
The target is 2.5 per cent inflation, and the average of the last observations of the four underlying measures is 2.5 per cent.
Inflation in Norway had been below target, but they cut official interest rates further – currently, the Key Policy Rate is 0.75 per cent, down from 1.5 per cent a couple of years ago. The central bank reports that inflation expectations have been fairly stable, so that the whole of the cut in the nominal policy rate has also been a fall in the real policy rate.
As you might expect, economic conditions in Norway haven’t been great in the last year or so, since oil prices plummeted – even though most of the direct effects of fluctuating oil revenues are sterilised in the Petroleum Fund. The unemployment rate – while still one of the lowest in the OECD at around 4.6 per cent – has increased by around a full percentage point, and is as high as it has been at any time in the last fifteen years.
But, nonetheless, the inflation rate has increased and core measures suggest it is around the target midpoint. That hasn’t been the New Zealand picture. What is the difference?
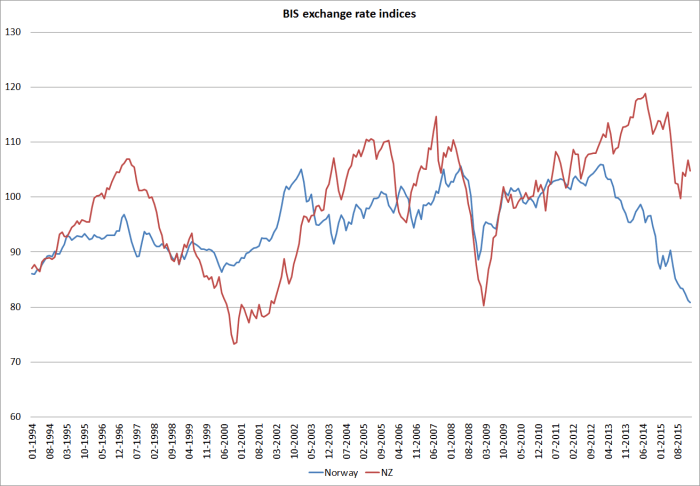
A key proximate part of the story is the behaviour of the respective exchange rates. Here are the BIS broad exchange rate indices for the two countries. Norway’s exchange rate is the lowest it has been for decades, while ours – off the 2014 peaks for sure – hangs around the average level of the last decade or so.
People could fairly respond that oil and gas are far more important to Norway than, say, dairy is to New Zealand, and oil prices have fallen even more steeply than dairy prices. All of which is true. Then again, all fluctuations in dairy prices flow straight through to private domestic incomes – unlike Norwegian oil revenues.
My point isn’t to draw exact parallels, but just to highlight a case of an advanced economy, with a severe adverse terms of trade shock, which has managed to keep inflation near the target – they’ve been willing to do what was needed, and in parallel the exchange rate response has been large.
The direct effects of higher import prices have helped to boost Norway’s inflation rate. That shows up in that the exclusion measures (ATE and XE) have been a little above target, while the central tendency measures (trimmed mean and median) are still a touch below.
Here is a chart from the Norges Bank’s (excellent) recent Monetary Policy Report.

The inflation rate for imported consumer goods has increased quite substantially, while that for domestically produced goods and services is estimated to be holding comfortably around the 2.5 per cent target rate. Outcomes like these are mutually reinforcing with the inflation expectations measures – expectations consistent with the target make it easier to keep meeting the target, and outcomes around target help validate the prior expectations.
There might still be questions about what happens when the exchange rate stabilises and imported inflation drops, especially if the unemployment rate is then still high (by Norwegian standards). Alert to the risks, the Norges Bank has flagged the possibility of further cuts in the Key Policy Rate. But again, my point is not that the Norwegians have solved their problems for all time, but that they are now meeting their inflation target once again. Our central bank isn’t.
As a reminder, in Norway (relative to the position a couple of years ago) real interest rates have fallen. In New Zealand they have risen. Ponder a counterfactual in which our real interest rates were 100 or 150 basis point lower than they are now – and that is about the magnitude of the change in the gap between the two countries’ real interest rates over the last couple of years. I think it is hard to dispute that we would have (a) a materially lower exchange rate, and hence higher tradables inflation, and (b) somewhat more domestic and net external demand and hence more upward pressure on non-tradables inflation. There would be few doubts in anyone’s mind of the Governor’s commitment to delivering on the 2 per cent target he signed up to a few years ago. Oh, and we’d have the good fortune to have an unemployment rate that would probably have a 4 in front of it, and probably be near the NAIRU.
Perhaps New Zealand doesn’t yet need real interest rates quite that much lower – I’ve been arguing for some time for an OCR of around 1.5 to 1.75 per cent. The point really is just to illustrate what has been done in Norway – a small commodity-dependent country, with serious house price issues – and what could have been, and perhaps could still be, achieved here.
