Alternative narratives

From time to time people who are persuaded by my story about New Zealand’s economic underperformance ask why it hasn’t been more widely accepted, and the policy implications adopted.

And, of course, there is a variety of good reasons.  They include:

  • my own story/analysis is quite recent and is continuing to evolve.  I’ve spent over 30 years as an economist, but central bankers mostly focus on the short-term.  It was really only two years spent at Treasury from 2008, and my involvement there in helping the 2025 Taskforce, that energized me to start thinking hard, and reading widely, on the issues around New Zealand’s long-term economic underperformance.   The first time I wrote anything down on any of this was 2010, and it hasn’t exactly been a fulltime occupation since then.   The presentation I gave last Friday has quite different emphases in some important aspects than the first public presentation  of related ideas that I gave in 2011.
  • it is a competitive market in ideas, and there is a variety of competing narratives around to help explain our underperformance, and what (if anything) might be done to remedy it.   Some have had considerable resources put into them, and others are less formal.  Some are produced under important and influential ‘brands”.
  • it is not as if the problems are new.  It is now more than 50 years since the first major reports were published on New Zealand’s relative economic deterioration (eg the Monetary and Economic Council in 1962).   Many stories have been told, and explanations attempted, in the subsequent decades.  Various strategies have been tried since then –  some well-founded, and others daft –  and the decline has not been fully arrested, let alone reversed. In some ways, I think that experience leaves people a little jaded, disillusioned, and perhaps rather wary.

What are some of the alternative narratives?

Treasury is probably the organization that has put the most resources into exercises of this sort (and, of course, it is the New Zealand organization with the most resources).  Prior to the last election they put a lot of effort into a disciplined process reviewing the arguments and evidence in a range of areas, including getting contributions from people elsewhere in the public sector in particular.  The public face of what they produced was Holding On and Letting Go, part of their post-election advice to the Minister of Finance.  There was also a substantial (60 pages) and more specific paper for the Minister of Finance done in late 2013, (which has been released to me under the OIA but does not appear to have been put on the Treasury website with their other OIA releases), which grouped policy recommendations under nine headings.   Treasury has come and gone a bit on what it emphasizes but savings, public pensions, and problems with macro policy loomed large back then.

One could also think of the 2025 Taskforce’s reports in a similar vein.  With a lot fewer resources, those reports represent a story about what could, and should, be done to reverse New Zealand’s economic decline.  The Taskforce itself summed up the essence of its approach

 The key elements of the Taskforce’s approach are:

  • Significantly cutting government spending and tax rates.
  • Finding better, more effective, ways of ensuring the delivery of services the government does fund. „
  • Substantially improving the rigour with which government spending proposals are evaluated.
  • Substantially improving, across the board, the quality of economic regulation. „
  • Getting government out of the ownership of business assets

It was a “smaller and better government” prescription.  When I read through the specifics again this morning, I don’t find many I disagree with, and there is much I would strongly endorse.  But when the work of the Taskforce was over, I was left with a sense of “important as some of these issues may be, it doesn’t seem quite enough”.  Whatever one’s judgement on the appropriate size of the state, for example, that in New Zealand doesn’t seem unusual.

The Productivity Commission, mostly focused on specific inquiries assigned to them by Ministers, has also been turning its attention to trying to answer the question of how to lift New Zealand’s productivity growth.  Paul Conway, the Commission’s director of research, gave an oral presentation to last year’s NZAE conference, and it will be interesting, in time, to see where the Commission as a whole lands, in both diagnosis and prescription.

And no doubt there are others.  Roger Procter, the thoughtful  former (recently-retired) Chief Economist at MBIE had some interesting analysis and views on appropriate policy to reverse New Zealand’s underperformance.  Philip McCann’s analysis created significant interest a few years ago (and my own views are probably less far from his than I realized at the time), and the New Zealand Initiative –  while not, that I’m aware, having a fully worked-out framework for thinking about our underperformance –  would also probably emphasise smaller government and more open markets (people and capital).

And there are also the overseas prescriptions, notably the biennial advice of the OECD.  The OECD has long been somewhat puzzled by the underperformance of New Zealand –  we were somewhat embarrassing because in some respects by the early 1990s we were almost their best pupil.  Their analysis and prescription tends to be a modern social democratic one (open markets and lots of smart active government), and in my judgement hasn’t really got beyond treating New Zealand as if it were another small northern European country.

I’m not going to go through each of these diagnoses or prescriptions here  today (let alone ones from decades past, like the major World Bank report on New Zealand in 1968), Having said that, I always used to stress to staff that it was no use beating a caricatured straw man version of an opponent’s argument –  one had to engage with the strongest and best arguments that people could mount on the other side.  So perhaps I will spend some time as the year goes on working through some of these other documents and explaining why I haven’t yet been persuaded by their (often quite different from each other) stories.  I might also highlight the aspects of my own story that I’m relatively less comfortable with.

All of which is a long-winded way of saying that it is not as if my ideas, or those of any new contributor, are coming into a vacuum.  Able people have been trying for a long time to develop stories, and prescriptions, that best fit the collection of New Zealand economic stylized facts.  Different people emphasise different subsets of those stylized facts, which can often mean that it feels like quite different, unrelated, conversations are going on.  Each perspective probably has some useful policy presciptions to offer, but most probably won’t make a difference on the scale that is required.  Will mine?  I think so, but advocates of some of the other approaches no doubt think that is true of their models as well.

And it is also worth recognizing that any set of existing policies in place gathers vested interests in support.  That will be quite a mix: in some cases it might just be people who benefit financially (as those with import licenses in earlier decades were reluctant to see that policy changed), but more often it will probably be about the emotional and intellectual investment in a way of seeing the problems, and remedies.  We are all prone to those sorts of biases, and they are hard to overcome –  I wrote, with some conviction, the section of the first 2025 Report on why size and distance were cop-out explanations and I wince a little now when rereading that.  In respect of my own analysis, a “bigger New Zealand” mentality has pervaded political and economic life in New Zealand for a very long time. If it is misguided, as I think, it is not likely to be a sentiment that is abandoned readily, at least absent some sort of crisis.

On a slightly different note, I’d recommend people read (economist and economic historian) Deirdre McCloskey’s piece from the Wall Street Journal the weekend, ‘How the West (and the Rest) Gor Rich’, drawn from her new book Bourgeois Equality, the final in her massive trilogy of works in this area.  I rather liked the last few paragraphs, which remind us that politicians –  and policy analysts –  don’t generate our prosperity.  But they can –  and too often have –  got in the way of such prosperity.

What public policy to further this revolution? As little as is prudent. As Adam Smith said, “it is the highest impertinence…in kings and ministers to pretend to watch over the economy of private people.” We certainly can tax ourselves to give a hand up to the poor. Smith himself gave to the poor with a liberal hand. The liberalism of a Christian, or for that matter of a Jew, Muslim or Hindu, recommends it. But note, too, that 95% of the enrichment of the poor since 1800 has come not from charity but from a more productive economy.

Rep. Thomas Massie, a Republican from Kentucky, had the right idea in what he said to Reason magazine last year: “When people ask, ‘Will our children be better off than we are?’ I reply, ‘Yes, but it’s not going to be due to the politicians, but the engineers.’ ”

I would supplement his remark. It will also come from the businessperson who buys low to sell high, the hairdresser who spots an opportunity for a new shop, the oil roughneck who moves to and from North Dakota with alacrity and all the other commoners who agree to the basic bourgeois deal: Let me seize an opportunity for economic betterment, tested in trade, and I’ll make us all rich.


Location matters

That was, more or less, the theme of my talk to the Fabian Society in Wellington last night.

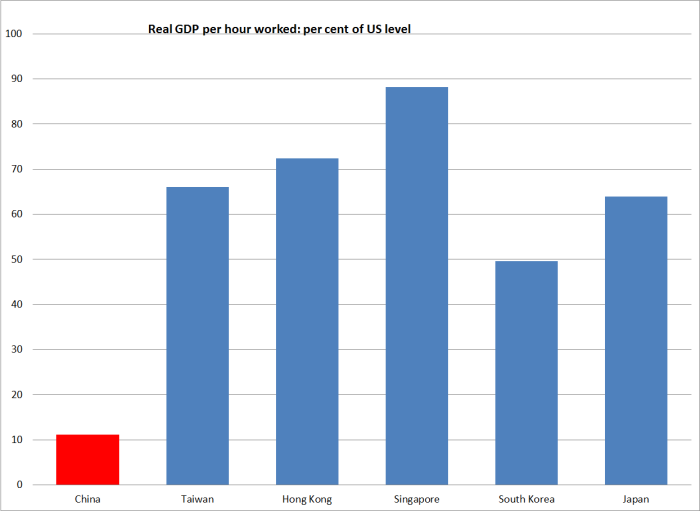
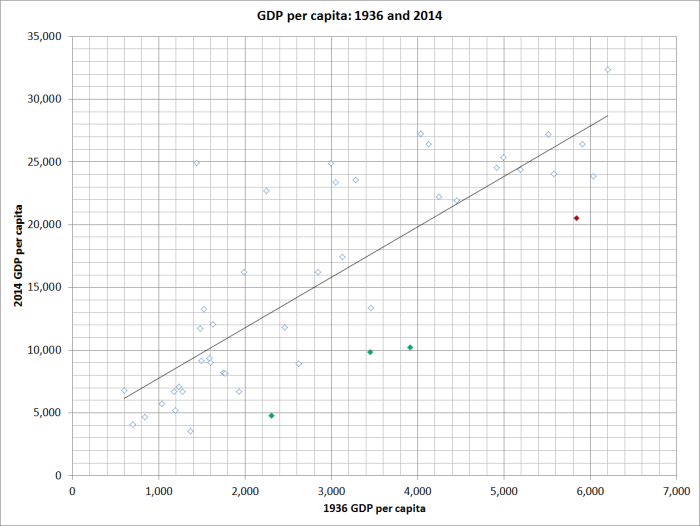
I outlined some of things that seem to matter in explaining which countries prosper and which ones don’t.  The people and the “institutions” they develop, or adopt, matter most of all.  But natural resources also do –  note, for example, the contrast between the GDP per capita in Sweden (high) and Norway (materially higher).  But location, or geography also seem to matter. Once, much of that was about access to navigable waterways, and perhaps some climatic issues.  These days it seems to be more about proximity.  Whether in the past or present, one just doesn’t find many really prosperous places, or many people living in those places, at the peripheries.  As I noted

the total population of Kerguelen, the Azores, Hawaii, Seychelles, Fiji, Iceland, Tasmania, Reunion, St Helena and the Falklands is just a bit less than New Zealand’s.

If anything, proximity and personal connections seem to have become more important, not less.  Quite why this should be so, despite the rise of communications technology, isn’t entirely clear to me (it must be something about the nature of the products/services), but that it is so seems evident in the continued economic outperformance of big cities, even in already-advanced countries.  That puts New Zealand at a big disadvantage –  we have able people, a moderate level of natural resources, but are a very long way from anywhere.  And the stock of natural resources is largely fixed, and doesn’t need lots more people to make the most of (indeed, often fewer people –  think of how many more cows an average farmer can run now, compared with the situation a century ago).   New Zealand just isn’t a very natural place for many global businesses to develop successfully, or to stay.

The Treasury was the first organization really to capture my attention on the significance of distance.  About 15 years ago they drew a useful comparison:  if one drew a circle with a radius of 1000 kms around Wellington one would capture (now) 4.5 million people and a lot of seagulls, but the same circles drawn around northern European or Asian capital would encompass hundreds of millions of people.  But it is puzzling that Treasury doesn’t seem to have taken that point and applied it in thinking about the appropriate immigration policy for New Zealand.  They tend to ignore the market signal (the hundreds of thousands of New Zealanders (net) who have left), and also ignore the logic that if distance is, in effect, a tax on economic prosperity here, it isn’t obvious why one would set out, as a matter of policy, to expose even more people to that tax.    Nothing of these ideas was in the recently-released Treasury material that I wrote about the other day.    Implicitly, Treasury and MBIE immigration policy advice- and the advice of bodies like the OECD (perhaps more pardonably, located in the heart of Paris) –  is being formed as if New Zealand were moored just off the coast of western Europe or North America, or perhaps even in the South China sea.  They need to take more seriously the fact that these islands are in the middle of nowhere.  High value economic activity takes places on such islands, but mostly only stuff that is location specific –  the iron ore is in the heart of Australia, the fish stocks are off the coast of New Zealand etc.  But it is really hard for modern, non-location specific businesses, to develop, and be the best they can be, in such a remote location.  It isn’t specific to New Zealand –  check out those other remote islands too.

But we make it all the harder for anyone with the drive and ideas to develop such firms.  Having persistently the highest real interest rates in the advanced world, and a real exchange rate that never sustainably adjusted down following our decades of relative decline, just further skews things against the prospects of the tradables sector.  Business investment has been consistently modest.  And the Think Big mentality, of bringing in enough –  modestly skilled –  migrants each year to have given us one of the faster population growth rates in the OECD, both reinforces those pressures on real interest and exchange rate –  resources have to be used to accommodate a growing population rather than enriching the existing population –  but also ensures that the fruits of the largely fixed stock of natural resources is spread over ever more people.  In effect, we trade away one of our few advantages.

I argued that we need our politicians and their advisers to both take more seriously the constraints of our location, and abandon the sense –  embedded in the New Zealand psyche almost ever since first European settlement –  that we need more, and more, people.  There is simply nothing wrong with a country of around 4 million people.   There are plenty of successful small countries.  For many of them perhaps it is more of a discretionary choice. At such distance from world markets, mostly trading on our ability to apply smart ideas to natural resources, it is much more of an imperative –  at least if we are serious about trying to give our people material living standards that match those of the better-performing OECD countries.

Anyway, here is the text I spoke from. It was delivered to the Fabian Society –  where we had a good discussion and lots of questions.  But for readers skeptical of the left-wing audience, it is almost identical to what I would say on these issues to an audience anywhere else on the political spectrum.

Fabian Society speech 20 May 2016

As ever, comments (and questions) are most welcome.


Sometimes I wonder….

There is always plenty in the newspapers to disagree with, but over the last couple of days a couple of pieces from the Herald particularly caught my eye.

On Wednesday there was an editorial supporting a focus on reducing government debt rather than tax cuts.   It culminated in this paragraph

The economy continues to enjoy stronger growth than most in the wake of the crisis more than seven years ago. With continuing high net migration gains, good numbers of tourists and rising returns from non-dairy exports, notably beef and wine, next week’s Budget will present a bright picture. It needs to do something more to contain house prices but that problem, too, is a symptom of economic success. New Zealand is attractive to migrants and investment because much of the world is so slow to finally recover from the crisis. When they do, our fortunes could change.

Where to start?    As I’ve pointed out before there is nothing impressive about New Zealand’s growth or productivity record even since the 2008/09 recession –  we had a serious recession, actually a double-dip in 2010 too, and have since had a sluggish recovery.  Headline GDP growth rates haven’t been bad by international terms, but per capita growth – surely what counts –  remains unimpressively weak.   And for all the talk about some individual sub-sectors doing well in exporting, per capita tradables sector production is no higher now than it was 15 years ago.

T and NT components of real GDP

And then there is the Prime Minister’s talking point –  house prices are a symptom of economic success.  Well, no.  They are a symptom of regulatory failure, compounded by an immigration policy that draws in lots of people –  not even to a successful city, but one where GDP per capita has been falling, relative to the rest of the country for 15 years.  Moderately wealthy countries will never have trouble attracting migrants if they want them –  there are always poorer places than us (eg, in the current New Zealand context, China, India and the Philippines).  A better sign of economic success might be if the New Zealand diaspora started returning –  but even last year, there was a (modest) net outflow of New Zealanders to Australia, an economy with its own problems.

I’m not sure what the editorial writer had in mind when he spoke of New Zealand being “attractive to investment”.  It is well known that rates of business investment in New Zealand have been very low for a long time.  Perhaps the writer had in mind non-resident purchases of New Zealand houses?  If so, again it is hardly a mark of  economic success to have a more secure environment, subject to the rule of law, than China.   Most countries –  rich, poor, and middling –  probably do.    And other countries have been “so slow to finally recover from the crisis”?   Really?   What has always been striking is quite how weak New Zealand’s performance has been, especially as it was not directly involved in the financial crisis (and associated losses) itself.  The weird narrative that we’ve done well is just contradicted by the facts –  unless perhaps Greece is the benchmark people have in mind,

Now, I agree with the leader writer that no doubt there will be another recession along before too many years pass, and it is wise to be fiscally cautious.  But if these are the “good times”  – unemployment still at 5.7 per cent, per capita incomes up only about 5 per cent over the eight years since just prior to the recession –  it is scarcely an encouraging story.

The other piece that caught my eye was on the front page of the Herald’s Capital Markets supplement.  In an article written by Fran O’Sullivan, Scott St John the head of investment banking firm First NZ Capital proclaims the death of distance.

The tyranny of distance has now turned into an advantage and in an infrastructural sense I hope we are bold enough and aspirational enough to capture that opportunity.

But I looked through the rest of the article, and found not a shred of argument or evidence in support of this proposition.

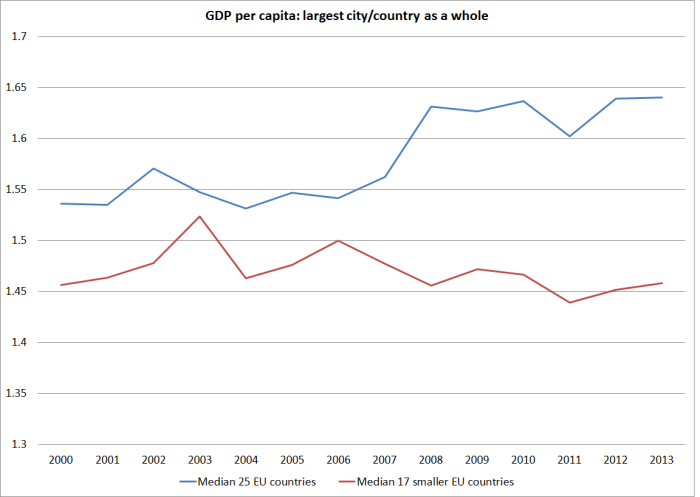
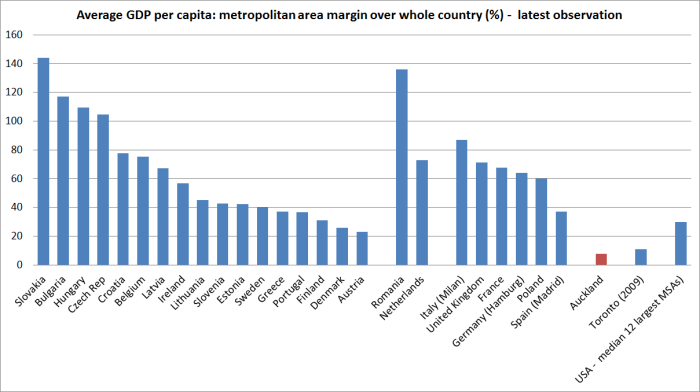
Yes, there was an argument for a while that falling communications costs etc would be the “death of distance”,  and for some individuals that is probably so.  But for economies as a whole, it just looks as though the argument, however reasonable it seemed when it was first made, was just wrong.  Location and personal connections seem to be mattering more than ever.  If it were not so, why would we see the average GDP per capita of big cities around the world still rising relative to those of the countries they are part of?    I illustrated the point in a series of posts last week (here and here).

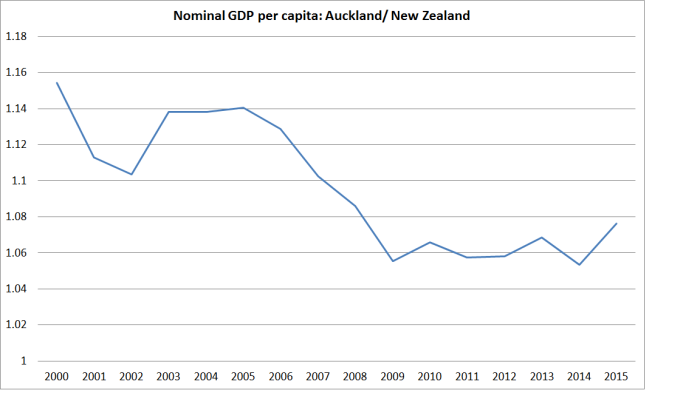
As a reminder, New Zealand has spent decades slipping behind the advanced country pack we once led.  And there is still no sign of that turning around, despite all the “aspirational” policy initiatives successive governments have adopted.  And Auckland –  home of Mr St John’s business –  has underperformed even New Zealand.  Despite all the policy focus on Auckland, over the 15 years for which we have data per capita GDP in Auckland has been shrinking relative to that in the rest of the country, not growing.

St John cites “a few champions who are growing their businesses from New Zealand”.  He offers two names.  The first is Fisher and Paykel Healthcare (on whose board he sits).  It seems to be quite an impressive company, but total revenues last year were $672 million.  At least, that firm is highly profitable.  His other example is Xero.  I wish Xero well but  total revenue last year was $124 million, for losses of $70 million: it is small, success (turning a profit) yet unproven, and with a fairly high likelihood that if it succeeds it will eventually be taken over and relocated abroad.   In a sense, the (short) list illustrates the challenge.  This remains a natural-resource oriented economy.  That isn’t necessarily a bad thing, and is probably largely a reflection of location and distance.

And for all the talk of tourism –  the upbeat story of the year – services exports as a share of GDP are still less than they were 15 years ago.

services X to GDp since 1991

In fact, the latest observation was bang on the average for the last 25 years.  Successful countries almost always become such, and stay such, by finding more and better stuff to sell on world markets. Even for services, we aren’t.

Sometimes, there are encouraging moments.  One of those the other day was the Labour Party moving to outflank the government and propose the complete abolition of the Metropolitan Urban Limit (or restrictions in a similar guise) around Auckland.  I’m not optimistic that it will all come to much –  as I’ve noted repeatedly, hoping that someone can offer a counter-example, there are no cases I’m aware of of cities/countries successfully throwing off planning restrictions once they become established –  but at least it seems to represent a recognition of (a) the seriousness of the problems, and (b) something closer to the root causes of the problem.

I wonder how long it will be until some political party –  even some leading media outlet –  might decide there is mileage in highlighting just how badly New Zealand has been doing economically over a very long time, and offer some serious grounded ideas for how we might turn that failure around.    Since 1970, Statistics New Zealand data tell us that a net 940000 New Zealand citizens have left New Zealand, and even in the last 25 years we’ve seen over 500000 (net) New Zealanders leave.  Sadly, it has been –  and remains –  a rational response to our own continuing underperformance


Expectations measures still warrant further OCR cuts

The Reserve Bank’s Survey of Expectations (of some reasonably “informed” respondents) came out the other day.  It was one of the last significant pieces of New Zealand macro data likely to emerge before the Bank finalizes the forecasts for next month’s Monetary Policy Statement and the Governor makes his OCR decision.

As ever, there wasn’t that much media attention on these numbers, and arguably not much changed in this survey from the previous one.    But in a sense that in itself should be newsworthy.

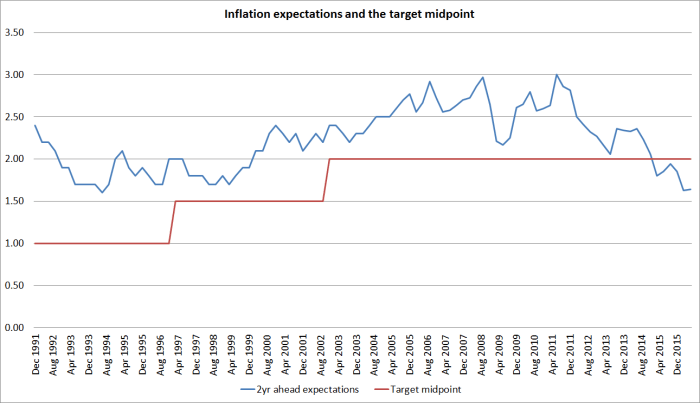
For a year now, the Reserve Bank has been reluctantly cutting the OCR, more or less reversing the ill-judged aggressive tightening phase the Governor undertook in 2014.  I say only ‘more or less’, because although the current OCR is lower than the 2.5 per cent that prevailed for several years until the start of 2014, inflation expectations have also fallen.  Using the two-year ahead survey measure, the real OCR was about zero at the start of 2014, but it is around 0.6 per cent now.  And, as the Bank reminded us in the FSR last week, the margins banks face, over the OCR, in tapping wholesale funding markets have also increased.

But the Bank has been cutting nominal rates for a year now, and still respondents to the survey don’t take very seriously the chances of the Bank getting inflation back to the 2 per cent midpoint of the target range, an explicit target that Governor himself had added to the PTA.  The last year or so is the first time ever that two-year ahead expectations have been below the target midpoint.  But despite 125 basis points of OCR cuts, there is no sign of medium-term expectations picking up again.

infl expecs and target midpoint

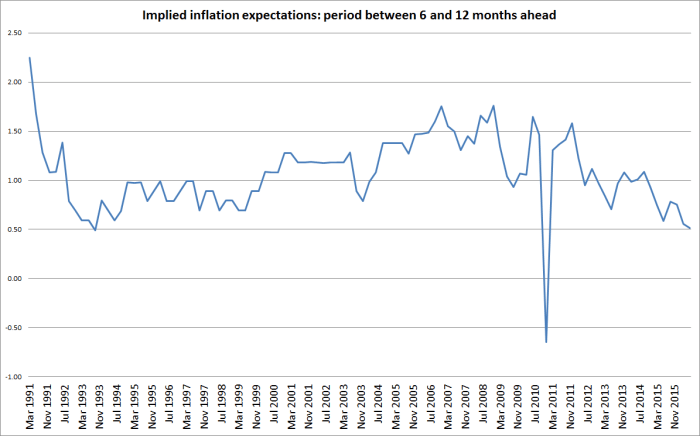
Some reporters noted that one year ahead inflation expectations had increased but (a) that shouldn’t have surprised anyone given the rise in world oil prices, and (b) there is no sign of the lift in expectations for the next couple of quarters flowing beyond that.  The survey provides expectations for each of the next two quarters, and for the year ahead, which enables us to derive and implied expectation for the second six months of the year ahead (which shouldn’t be much influenced by eg changes in oil prices).  Here is that chart.

implied 6mths ahead

I wouldn’t want to make much of a single observation, but the latest fall just continues a trend that has been underway ever since the 2008/09 recession.  There is no sign of growing confidence that inflation will soon be getting back to target (note that the annualized rate of inflation for the second six months is only 1 per cent, at the very bottom end of the target range).

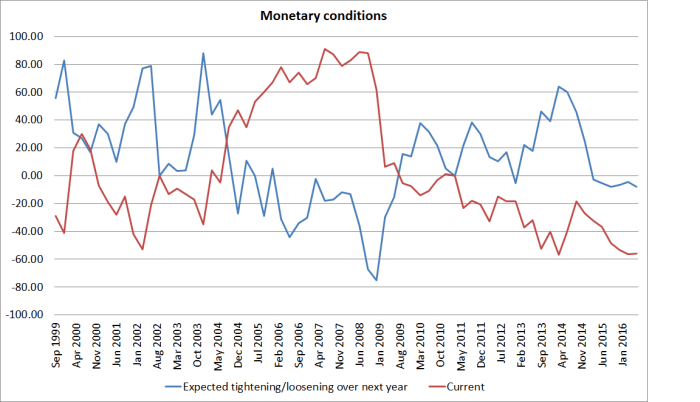
And these inflation expectations are based on expectations that monetary conditions will be eased further.  In the history of this survey, respondents typically only expect monetary conditions to ease over the coming year when they are already judged to be quite tight.

monetary conditions

For example, over the period from 2004 to 2008 respondents thought conditions were tight (the red line) and expected that they would ease over the year ahead (the blue line).  At present, they think conditions are quite easy, but they still think conditions will (have to) ease further over the coming year.  The size of the expected future easing isn’t large; it is the fact that they still expect further easings at all that is striking.  Even with that expected easing, inflation expectations remain subdued.

If the Reserve Bank is keen to get these medium-term inflation expectations back up to around the target midpoint –  as a marker of how much confidence people have in the seriousness with which the target is being pursued –  there are broadly two ways to do that.

The first is through credibility/confidence effects.  In other words, a substantial programme of interest rate cuts could, of itself, be enough to raise expectations of future inflation.  People think along the lines of “gee, inflation has badly undershot the target, but I see the Bank is moving decisively now, and accordingly I’ll adjust my responses in the survey”.  As already illustrated, there is no sign –  a year into the easing cycle –  of that sort of behavior at work.

If not, then they need to rely on the second channel: actually boosting economic activity, putting more pressure on scarce resources, and raising actual core inflation, leading people to revise up their forecasts of future medium-term inflation.  This is probably usually the more important channel –  people more often revise their forecasts/expectations in the light of actual experience with inflation.

The survey enables us to see whether respondents expect additional pressure on resources.     Take the question about GDP growth, for example.  In this survey expectations of GDP growth for the next one and two years actually fell.  In the case of the two year ahead expectations, this fall reversed a rise in the previous quarter, but left expectations as low as they’ve been since the end of the 2008/09 recession.   The survey doesn’t ask respondents for their population growth estimates, but at present the population is growing by almost 2 per cent annum, and if that continued then the expected 2.33 per cent GDP growth wouldn’t put much pressure on resources, or give much reason to expect inflation to rise.   Perhaps respondents to the survey are just wrong, and will be surprised by how much growth actually happens.  But at present there isn’t much evidence of a growth acceleration that might lift the core inflation rate.

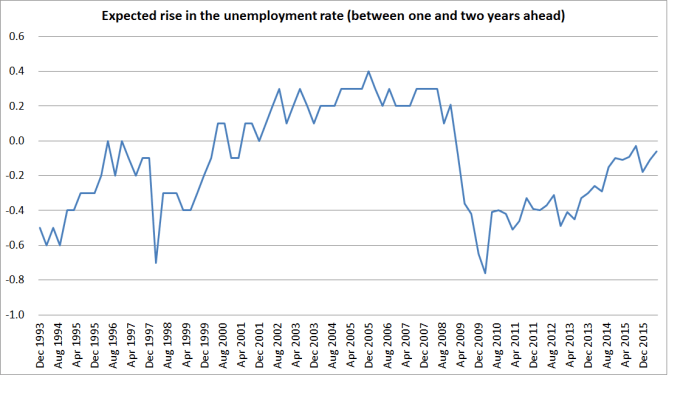
The survey also asks about unemployment rate expectations.  Respondents are asked what they expect the unemployment rate to be in a year’s time and in two years’ time.

expec rise in U.png

The chart shows the expected increase in the unemployment rate between one and two years ahead.  When the unemployment rate is very low, and monetary conditions are tight (see chart above), as in the pre-recession period respondents typically expect that the unemployment rate will rise in future.  After the 2008/09 recession, for several years respondents expected material falls in the unemployment rate.  But now. with the actual unemployment rate at 5.7 per cent, they still expect it to be 5.53 per cent two years from now.  There is simply no sign that these respondents expect capacity pressures to intensify from where they are.  And, thus, they see no reason to expect underlying inflation (abstracting oil and tax changes etc) to head back to 2 per cent any time soon.

Who knows what the Reserve Bank will make of the recent data, including the Survey of Expectations.  On their past track record, the expectations survey might provide them cover to not cut the OCR in June (“look, two year ahead expectations stabilized”).   Given the Governor’s apparently strong bias to focus on the housing market whenever possible –  for which he has no mandate –  and avoid cutting unless the other data overwhelm him, it might make a plausible story for some.

But it would be the wrong message to take.  The Governor’s mandate for monetary policy is to keep inflation near the 2 per cent target midpoint.  Almost four years into his term, he has consistently failed to do that.  Reasonable people might differ on quite how much responsibility he bears for that failure –  what was forecastable and what wasn’t  –  but right now there is almost nothing suggesting (a) that informed observers have any confidence that inflation will settle at 2 per cent, or (b) that growth will accelerate and capacity pressures will intensify, in a way that might raise actual inflation and lead survey respondents to reassess the outlook for inflation itself.   The succession of grudging OCR cuts over the last year has probably eased the disinflationary pressures a little, but the evidence suggests they have been nowhere near enough to address the problem of inflation persistently undershooting the target the Minister of Finance (on behalf of the public) has given the Governor.

If we look back over the last five years, there were various factors that have, and should have, supported demand/activity at any given interest rate.  The terms of trade rose strongly on the back on high dairy prices, boosting domestic incomes.  The Christchurch repair and rebuild process was a big boost to demand  –  didn’t boost productivity, but it sucked up real resources that couldn’t be used for other things.  And at least on some readings, the world economy was providing some support to domestic activity –  both the sluggish recovery in the West (about as sluggish as New Zealand’s) and the buoyant demand in many emerging economies.

None of those things is supporting any sort of intensified pressure on resources now.  The terms of trade have fallen quite a lot, and while world dairy prices might be stabilizing (a) we can’t just assume that they will soon rise very much, and (b) the full effects on domestic spending etc of current weak payouts probably haven’t yet been seen.  The Christchurch process has a long way to go, but there is no sign of the level of repair/rebuild activity rising from here (and the recent cement sales data actually showed a large fall in Canterbury sales).  And there are very few bright spots in the world economy at present.

Perhaps the hope rests on a domestic (non-Canterbury) construction boom?  Given the population pressures that might be welcome, but it remains much more of an aspiration than a forecast –  respondents to the RB survey, expecting only very subdued GDP growth, seem to think so too.

Much better now for the Reserve Bank to move decisively to finally get on top of the downward drift in people’s expectation of future inflation, and the persistent undershooting of the target midpoint.  At present, I reckon the Governor’s reaction function is one in which (changes in) house price inflation dominate, unless other data suggest to his forecasters a material risk of inflation staying below 1 per cent.  That isn’t the target he has been given, but if that is something like the way he is operating, it is no wonder respondents to this survey see no reason to expect inflation to head back towards 2 per cent any time soon.  The Governor has only 16 months left in office –  just enough time, if he really took the issue seriously, to get underlying inflation settling back to around 2 per cent.


Non-resident purchases of houses: the data

Last week, LINZ released the first batch of data from the new attempt to measure non-resident purchases of property in New Zealand.

As they note, at this stage the data have considerable limitations (including around the exclusion of purchases by trusts and companies).  In addition, it is unlikely that the few months these data cover will prove to have been representative.  On the one hand, there may have been some permanent behavioural changes as a result of the introduction of the “brightline test” and the tax number requirement introduced on 1 October.  For those concerned about non-resident purchases of houses in New Zealand, if those legislative changes reduce the extent of purchases that would no doubt be welcomed, but it will also mean we will never know with any certainty what the extent of non-resident purchases was in the couple of years before the law was changed.

So our law changes may have permanently reduced offshore purchases.  But they will almost certainly have temporarily disrupted the flow of such purchases.  Some people will have rushed to get in ahead of the law changes, and others will simply have been unsettled by them, or a little confused by them.  Many regulatory changes have that sort of effect –  a (potentially material) short-term disruption, which gradually abates.  In the housing market, we’ve seen it with the succession of new LVR restrictions.

All of which means that whatever the non-resident share of house purchases over the first three months of the year, it is likely to be a low-end estimate of the number of non-resident purchases (at least until China more effectively cracks down on capital outflows, and/or runs a regime that makes people more comfortable with holding their wealth in China. As I’ve pointed out before, in normal successful countries citizens don’t rush to buy houses in other countries as some sort of safe-haven store of value.

The focus of the discussion of this issue has been on the Auckland market.  The LINZ data tell us that in the January to March period, 4 per cent of transfers involved non-resident purchasers.  In most other localities, that share appears to have been smaller, but in the Queenstown-Lakes TLA, the share was a little higher still (for the entire October to March period).

What has surprised me somewhat is that 4 per cent has been treated by most people as a small number.  In writing about this almost a year ago, I noted that –  with no data whatever to back the supposition –  it wouldn’t surprise me if 5 per cent of Auckland housing demand was from non-residents, and that in a market with fairly tightly constrained new supply, even quite small percentages could make a material difference to house prices.

And much of the discussion of this issue seems to ignore the fact that most turnover in the housing market is not as a result of people entering the market for the first time or leaving it for the last time.    Most turnover involves New Zealanders buying and selling from one another –   people changing city or suburb, or just changing their stage of life (wanting a bigger house as the kids grow, or a smaller house later in life).  The same goes for residential rental properties: the stock turns over as individual owners’ circumstances and interests change.  A well-functioning housing market will have a lot of turnover (facilitating those changes in life circumstances etc) and little persistent pressure one way or the other on real prices.    In these data, New Zealanders bought sold from each other around 40000 houses in a six-month period.

Pressure on prices arises from net new demand to the market (or –  the Christchurch story post-earthquake – net reductions in supply) not from routine turnover.  It is a bit like immigration influences on the housing market.  In a year in which there are big swings in net migration, those fluctuations might amount to only around 1 per cent of the population.  Even if migrants typically eventually purchase their own home, probably most don’t purchase in their first year or two here (especially as many initially come on temporary –  work or student – visas), so newly-arrived immigrants themselves might still only account for a quite small percentage of house sales in any year.  But previous formal empirical studies have  suggested that a 1 per cent shock to the population from a change in immigration can still produce up to a 10 per cent change in house prices.  Markets operate at the margin –  it is changes in the net new demand/supply that really should be the focus of attention.

If the average New Zealand house was turned over five or six times in the course of an adult life (eg turning over roughly every 10 years), then perhaps 80 per cent of all turnover would just represent “churn” –  a term that sometimes has pejorative connotations, but here I just mean New Zealanders moving through different phases of their lives.  If, on the other hand, most of the non-resident purchases were net new demand to the market, then 4 per cent of total turnover might be more like 20 per cent of net new demand to the market.  I’m not staking anything on that number; it is purely to illustrate that data suggesting non-resident purchases are 4 per cent of turnover may tell one very little about what role those purchases are playing in the overall balance of pressures on the Auckland market.

The issues around immigration are a bit different from those around non-resident purchases.  Immigrants need to live somewhere, regardless of whether or not they own a house themselves.  Non-resident purchasers, almost (but not quite on the LINZ measure) by definition don’t need somewhere to live here.  On the other hand, the suggestion has been  – although we don’t have the data to know the extent of it –  that many non-resident purchasers have been buying properties and leaving them empty (recall the store of value motive).  If that is happening to any material extent, the impact on the housing market is much as if they were a new migrant. If, on the other hand, houses purchased by non-residents are placed on the rental market, non-resident demand might still raise house prices materially (in a supply constrained city) but shouldn’t materially affect the affordability of accommodation itself –  ie rents.

One other limitation of the residency data is that it doesn’t give a sense of transitions from one residency to another.  For example, the data show quite a large number of purchases, and a large number of sales, by Australian tax residents.  One possibility is that most of these people are actually New Zealand citizens.  A New Zealander might have gone to Australia a few years ago, and left a house behind, unsure how long they would stay in Australia.  Finding that life has worked out well in Australia, and having become an Australian tax resident, they might now be selling the house here.  Or a New Zealander who has lived in Australia for some time, and become an Australian tax resident, might be looking at coming home, and purchases  a house here in anticipation of the move.  Given the easy migration flows between New Zealand and Australia, there is likely to be a different interpretation on transactions by these non-residents than there might be in respect of most purchasers with Chinese tax residence (a country where there is a well-known high level of capital outflows to a variety of countries, often manifest in residential real estate purchases).  Of course, if that Australian story is correct, there is a considerable element of “churn” in those transactions too, rather than net new demand to the market.

It is going to take time, and more refinements by LINZ, to really get a good sense of the situation, particularly after the first disruptive effects of last year’s regulatory changes pass.   But, for now, it is best to keep in mind that even if the offshore non-resident purchases (from people not having lived here previously or likely to live here in the near future) are only equivalent to a few per cent of total housing turnover in Auckland, that probably isn’t a small number in terms of its economic effect.  In a well-functioning house supply market it might be different –  increased demand boosts supply, in effect providing a new export industry.  When supply doesn’t work well, quite small changes in the net balance of demand can have uncomfortably large implications for prices.


The Treasury on immigration policy

The other day Treasury released a 29 page set of slides put together in September 2014 for an internal “Immigration Policy Forum”.   The Forum discussion –  probably gathering all the key people in Treasury –  seems to have been designed to help Treasury come to a “clearer shared position on immigration policy”.  For a time, at least, there seemed to be two schools in Treasury –  a “microeconomic wing” championing the gains to New Zealand from immigration policy, and a “macroeconomic wing” –  perhaps somewhat influenced by some of my arguments –  uneasy about the possibility that the macroeconomic pressures (eg on real interest and exchange rates) resulting from high target rates of non-citizen immigration might be impeding New Zealand’s medium-term economic performance.

I’m not entirely sure why Treasury chose to release these slides now.  They aren’t a response to an OIA request, but may have been prompted by my recent OIA request (the results of which they released the same day) asking for copies of any material Treasury had prepared on immigration since 1 April 2015.   I haven’t read the OIA release results in any detail yet (there is 200 pages of material), but these slides look to provide more of an overview of Treasury’s perspective than any of the specific papers in that collection.  The slides themselves don’t tell us what view the Forum reached on immigration, but from the fact that Treasury has voluntarily released them and that there is no suggestion the meeting disagreed with the proposed stance, it seems safe to conclude that the slides represented a Treasury view, at least in late 2014.

Last year, I had asked for copies of papers Treasury had provided to the Minister on the economic impact of immigration.  I discussed here what they released then, noting that I had been surprised how little evidence or argumentation they had advanced suggesting that New Zealanders as a whole were getting economic benefits from one of the largest inward migration programmes run anywhere.

What about the 2014 slide pack?  Is there any sign of a more in-depth assessment of the issues and arguments as they apply specifically to New Zealand?  Unfortunately, not really.

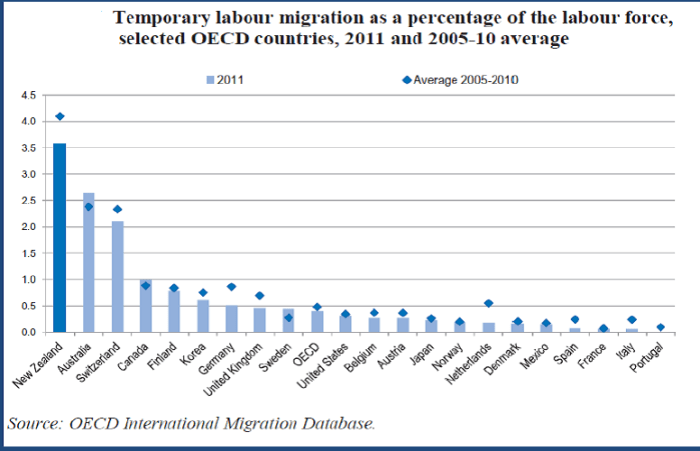
There are some interesting and nicely-put-together charts.  There were even a few things I didn’t know (eg there is an interesting OECD chart showing that New Zealand has the highest share of the labour force made up of temporary migrants of any OECD country).

temp workers

Much of the discussion is, in principle, organized around this decision tree.

decision tree

Which is more or less fine, as far as it goes, although it continues to structure debate in terms of microeconomic benefits vs macroeconomic costs, simply taking for granting that in the specific case of New Zealand there are in fact microeconomic benefits to New Zealanders.

I’m not going to devote any more space to either Option 1a (substantially increasing immigration) or Option 1d (trying to adjust the inward flow of migrants cyclically, to ease cyclical pressures on the economy).    The first simply isn’t going to happen –  especially while the advocates of large scale immigration to New Zealand can show no clear evidence that New Zealanders have benefited from the large scale immigration we’ve already had over many decades.  And I agree with Treasury that adjusting the immigration programme cyclically isn’t particularly sensible or workable –  both because the economic cycle is difficult to forecast, and because many of the fluctuations in net migration (ie flows between NZ and Australia) aren’t directly amenable to New Zealand policy measures.  Monetary policy should remain the cyclical management tool of choice.

The real choices are between maintaining something like the current target level of non-citizen immigration (45000 to 50000 residence approvals a year) and reducing that target, perhaps to something more in line with the typical OECD country.   Within either of those options, there are choices about how we select migrants and what sort of people we aim to bring in.  At least in these slides, Treasury is more interested in these latter issues than in the former.

The challenge of identifying impacts of current level of migration is that it
is difficult to specify a counterfactual – what would have otherwise
happened without the observed level of immigration.
The evidence isn’t definitive enough to make a judgement about whether
net benefits would be higher from the current quantity of inward
migration or a lower level. But it does show that composition matters.
Of course it is difficult to specify a counterfactual –  it often is –  but that is no excuse for not trying.  It seems that, in substance, Treasury is reduced to saying “we really have no idea whether New Zealanders are benefiting from the large scale immigration”.  That is quite indictment after 25 years of (more or less) the current policy, and this from our premier economic advisory agency.
Treasury is uneasy about the skill mix of migrants however. The slides are quite explicit in some places
Our key judgment is that migrant labour is increasingly likely to be a substitute for local low -skill labour, and this is an impact that we should try and mitigate.
I’d see this as fairly consistent with the points I made in a series of posts last year (eg here) about just how relatively not-very-skilled our skills-based immigration had become (eg the disproportionate numbers of retail or restaurant managers).
But Treasury remains quite upbeat on the prospects for highly skilled migration
More high-skilled migrants can benefit high-productivity firms and industries, and we are less concerned about wage and employment effects for high-skilled local labour.
This is because we think:
– High–skill migrant labour is more likely to complement local labour and capital, rather than substitute for it
– High-skill labour will increase the skill composition of the local workforce, which is the theoretical channel through which many of the beneficial impacts of migration are achieved
– To the extent there are LM impacts on competing local labour, we think there are normative policy reasons to be less concerned at that end of the earnings spectrum
Research suggests that the high – skill migration may have a positive impact on
innovation and productivity via its effects on skill composition. High – skill labour is also likely a complement for both low -skill labour and capital.
We think this suggests that we should look to increase the supply of this sort of labour.

All of which might be fine if, for example, they could show that the New Zealand economy (and New Zealanders in particular) was actually benefiting from the high-skilled immigration we already have.   Or if they could show how New Zealand could attract genuinely highly-skilled people in large numbers, when large numbers of our own skilled people are typically treating New Zealand as a place to leave.  Or if they had engaged with the data suggesting that many skilled migrants take decades to match the earnings of comparably-skilled locals.

At one level, I don’t disagree with Treasury.  If we are going to run a large inward migration programme, it is far better to do as we advertise, and make it a genuinely highly-skilled focused programme.  The proportion of fairly modestly skilled people we have been allowing in in recent years seems most unlikely to benefit New Zealanders as a whole, and there are more plausible stories for widespread benefits from attracting highly-skilled migrants than low-skilled ones.

But one really needs a lot more material than is captured in these slides to reach a considered view on the appropriate level of non-citizen immigration for New Zealand.   Perhaps most importantly, one would need to engage seriously with 25 years of continued economic underperformance, even though we have been running one of the largest immigration programmes around.  But one would also need to show signs of thinking hard about the structural characteristics of the New Zealand economy, which continues to rely –  almost as heavily as ever  –  on its natural resource base, not self-evidently a resource that needs (or benefits from) lots more people.  One might need to show a serious willingness to grapple with such characteristics of the New Zealand economy as its persistently high real interest rates and the persistently high real exchange rate.  Or to grapple with the indications of the economic underperformance of Auckland.

And there is simply none of that in these slides.

(One might even want to grapple more seriously with the housing market tensions that high levels of immigration has created.  I’m quite with those who say that a first best response might be to sort out the housing supply and urban land market, but……there is very little sign of that happening, and no sign that it has successfully happened anywhere else.  This isn’t just some sort of sequencing problem –  urban land issues look fairly intractable, not for technical reasons, but for reasons having to do with the preferences of residents on the one hand, and planners, bureaucrats and central and local government politicians on the other.  In the meantime, while people blithely talk of “immigration isn’t the problem, housing supply is”, too many people seem to be living in overcrowded accommodation, garages and even –  no doubt rarely and temporarily –  in cars.)

I’ve argued previously that the Productivity Commission should be asked to conduct a serious review of the economics of New Zealand’s immigration policy, in the context of the specific structural features of the New Zealand economy.  The Commission seems, on its track record to date, to be prone to rehearsing  – in more sophisticated language and at considerable length –  current conventional wisdoms, but it remains the best-placed official agency to do some more serious work in this area and to contribute to a better-informed public debate.