On standards in public life, and Jian Yang

My honeymoon was paid for by a week or so helping an arm of the expansionist and repressive Chinese government  (the IMF was paying, and it involved helping run a course in some obscure provincial city on liquidity management and the implementation of monetary policy).  In more recent times, I’ve also done a couple of lectures on New Zealand economic management, under the auspices of the Australia New Zealand School of Government, for groups of up-and-coming Communist Party officials –  ANZSOG had wanted Graeme Wheeler, and they got me instead.   Indeed, to my own bemusement, for a time I even held a security clearance that (I was advised) meant that if, for example, I wanted to take a holiday in China, I needed to give advance notice to, maybe even seek approval from, our intelligence agencies.

These days it is hard for many people in the public sector to avoid sullying themselves with contact with Chinese government/Party representatives.   Some of that, no doubt, is just an inevitable part of state to state diplomacy.   But when the opportunities arise, there is also the fascination with an ancient culture, and its modern manifestations, and with a country that is home to perhaps a fifth of the human race.   Perhaps it was like that for the Soviet Union in earlier decades?  Or Germany in the 1930s?  It is easy to say now, but with hindsight I now regret the (very small) assistance I provided to the Chinese government and their officials.  However amiable and intelligent individuals might be –  and there were many such in Soviet Russia and Nazi Germany –  they worked for, and advanced the cause of, a state which is the enemy of freedom, and the enemy of the values that made this country, and countries like it, what we are.   A state with an active aggressive agenda, propounding internationally an alternative authoritarian vision of governance, and brutally suppressing those who disagree with them.   A state ruled by a Party which actively connived in the murder and starvation of tens of millions of its own people.

Which is why those people (including the man himself) attempting to dismiss the concerns raised in the Financial Times/Newsroom stories about National MP Jian Yang as somehow “racist” are just playing distraction and trying to avoid the real issues, and real questions.

Would I be worried if, say, the National Party (or any other party for that matter) had made as one of its MPs someone with an equivalent background in the former ruling parties and military intelligence institutions of former authoritarian states like, say, Paraguay, Zambia, or Serbia?  Well, yes I would to some extent.   Such a background would speak of the values of the individual concerned –  and there has been no suggestion Jian Yang was forced to work for military intelligence or join the Communist Party; instead he will have been judged “reliable” to have been allowed to do so.  It would also say something about the values of a New Zealand political party which treated so lightly our own historical values and freedoms as to recruit someone like this.  Perhaps prioritising party fundraising over the values and freedoms of New Zealanders?

But in those cases, (a) the authoritarian states are now democracies, and (b) they are countries (chosen deliberately) with no particular interest in, or wish to exert influence on, New Zealand.

What about people with backgrounds in the intelligence services of the United States, the United Kingdom or (to use the example an FT columnist cites) Italy?  Frankly, I would have some concerns about the ability of someone who has ever worked in the military and intelligence establishment of another country to ever completely relinquish those loyalties and put the interests of New Zealand first.   Then again, such countries –  whatever their faults –  have been our allies over many decades.  The potential for serious conflicts of interest are much less than they are for some other regimes.

In other words, these things are points along a spectrum.    I’m not sure that former members of foreign intelligence services ever have a place in our Parliament, but those of Australia or the UK worry me less than those of the US, which worry me less than those of Singapore, Paraguay or Serbia, which worry me less than those of Russia or China.      The latter two are (a) large, and (b) aggressive powers.  Of the two, China is much more of threat in this part of the world than Russia.   But in the 1970s, the order might have been reversed.  Imagine a former KGB officer serving in the New Zealand Parliament in the 1970s, advocating the interests and view of the Soviet Union, and hob-nobbing with representatives of the Soviet Embassy.

Some people come out of the establishment of brutal aggressive authoritarian states and recant completely their former loyalties.  Their eyes have been opened to the evil that state represented, and often such people become leaders in the cause of urging people in the West to recognise the threat.  Sometimes, even, with the zeal of a convert their opposition to the state of their birth can be uncomfortable or even a little embarrassing.  And I don’t suppose that after his defection Oleg Gordievsky spent much time with the Soviet Embassy in London.

But what of Jian Yang?  I had a look yesterday at his maiden speech in Parliament, delivered in February 2012.  Maiden speeches are often an occasion for a new member to outline their personal philosophy, and the things that made them who they are, and led them to seek to enter politics.  A few are classics –  I recall being taught from Sir John Marshall’s in my first year politics course decades ago.  But what of Yang’s?

Read without knowing he’d been a member of the Communist Party (well under 10 per cent of China’s citizens are), or had been a serving participant in the intelligence establishment, it might seem inoffensive enough, although still a little surprising.       To serious champions of liberty, the Tianamen Square protests, and subsequent government massacres, stand as a continuing charge against the Chinese state and Party.  How does Yang deal with them (they disrupted his plans for graduate study abroad)?  They are nothing more than “student demonstrations”.

He can safely be mildly critical of the Cultural Revolution –  his parents were apparently sent to the countryside for “re-education” –  but never mentions the dreadful evil of the Great Famine, one of the worst man-made (Chinese government made) disasters ever.  There are boilerplate references to his support for opportunity and choice, but no attacks on the evil of the one-child policy, still in place at the time Yang gave his speech. Nothing about the lack of freedom of expression, the lack of freedom of religion, the lack of any free alternative to the Communist Party in China.      Instead, we get paeans to the “success” of the Chinese government in “lifting millions of people out of poverty”, as if the same government hadn’t driven them unnecessarily further into poverty in the first place –  and he has the gall to suggest that “reflecting on the way in which China has achieved its positive change and development gives me a firm belief that the policies of the National Party are in the best interests of New Zealand.”     And for someone with an academic background in international relations and an expressed interest in contributing on foreign affairs matters in Parliament, nothing at all about Chinese expansionism in the South China Sea, or its advocacy internationally of alternative visions of governance antithetical to liberal democracy.

It is one thing to be proud of your ethnic background –  and China has an ancient culture that once led the world –  but Yang showed absolutely no sign of having turned his back on, or a desire to call out, the evils of a repressive authoritarian party and government that has never recanted its mistakes, that has failed economically (compare Taiwan and China for example) and which represents a threat to us, and to countries (and believers in freedom) throughout east Asia.

And it wasn’t just the maiden speech.  As the Financial Times notes, since entering Parliament

He has consistently pushed for closer ties with Beijing and for international policies and positions echoing those of China’s Communist party.

In one of the FT articles on this story, there is photo of Yang posing with the Chinese defence attache at a celebration a year or two ago of the anniversary of the founding of the Chinese army.  Perhaps a Minister of Foreign Affairs more or less has to attend such functions.  Backbenchers don’t, and they certainly don’t need to be posing with military representatives of aggressive foreign governments, unless doing so speaks of their ongoing sympathies.  There is simply no sign of Yang having recanted his active involvement in the Chinese intelligence establishment –  indeed, until yesterday that inolvement was not generally known,

If, say, Russel Norman or Julie-Anne Genter (adult migrants who subsequently became NZ MPs) had been as actively involved in advancing Australian or US government causes (respectively) there would also have been considerable grounds for concern, mitigated to some extent by them not having been serving members in the intelligence regimes of the countries of their birth.

Who knows quite what the nature of Yang’s ongoing association with the Chinese authorities is.  But as the FT report notes, China has been increasingly active in placing and cultivating people in Western democracies and helping them gradually reach positions of political influence, and it reports concrete areas of concern in Canada (including from the intelligence authorities) and Australia.    Perhaps Yang doesn’t fit that bill at all, but if so his case would be a lot more convincing if he’d had a track record of being consistently and openly critical of the Chinese government and the Communist Party.  Instead, as the FT notes, in an interview recently he repeatedly requested the journalists not to include information about his intelligence background in articles about him.  You’d think it might have been an opportunity to openly criticise the authoritarian regime (being able to use the insider’s perspective he’d gained in his misguided youth) that he had turned his back on in choosing to come to New Zealand.  But apparently not.

It really is a quite extraordinary story.  On the one hand, quite remarkable that it has taken six years in Parliament for the media to look into the background of this MP –  one has to wonder why these stories weren’t being written in 2011 when the National Party first put him on the list. Perhaps there would have been more scrutiny if he’d been attempting to become a constituency MP?

But more concerning is the seeming indifference of the National Party to Mr Yang’s background.  He was/is (we are told) a very effective fundraiser for the National Party, and politics isn’t cheap.  Once upon a time the National Party could be counted on for a fairly hardline on defence and security. But these days, if this story is illustrative, do they just no longer care, so long as they can maintain a cosy relationship with the Chinese establishment and host visits from Chinese leaders and Chinese warships?  It is easy to downplay geopolitics when one is as physically remote as New Zealand.  But the issues and threats to us, and to like-minded countries, are real nonetheless.

On a similar note, shouldn’t it be somewhat concerning that the largest donor to the National Party is an entity called the Inner Mongolian Rider Horse Industry (NZ) Ltd.  I suppose we should be grateful the donation was made in a way that it was disclosed, but this is a company which has a small New Zealand operation, subsidiary of quite a large Chinese parent owned by a Chinese billionaire.

I have no way of knowing if the National Party is worse on such matters than the Labour Party would be (or for that matter, New Zealand First, which now has a prominent candidate Shane Jones of Bill Liu citizenship shame.)  But Jian Yang is a member of the National Party, and the National Party has now led the government for nine years.  For now, the hard questions seem to need to be asked of them.   If they didn’t know Yang’s background before recruiting him, that was slipshod or deliberately indifferent, and if they did know but just didn’t care –  and stuck him on the Foreign Affairs committee nonetheless – it risks looking like just another form of depraved indifference, whether through blindness to the threat China poses to things we (and people like us, from Taiwan, from Canada, from the UK or wherever) have held dear, or just a focus on keeping the donor money and votes flowing in.

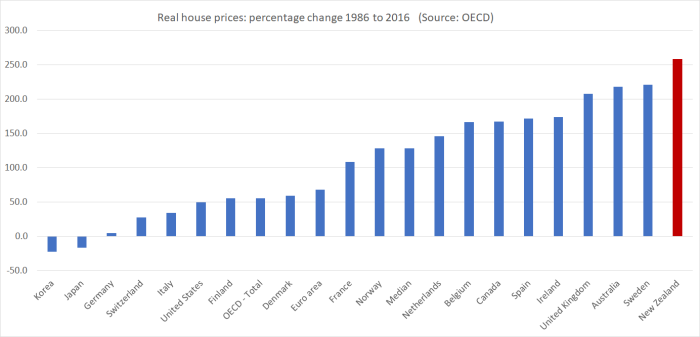
I’m no New Zealand First fan, but the slogan on their campaign billboards “Had enough?” sums it up for me.  After the housing disaster, the economic failures (and worse, the near lies about them), and episode after episode that speaks of the degradation of standards of public life in New Zealand, for me it is just another nail in the coffin.  More nails than timber now.


Mr Joyce tries to defend New Zealand’s export record

Alex Tarrant, at interest.co.nz, has done a couple of interesting interviews, one each with the current Minister of Finance, Steven Joyce, and with the man who would replace him, Labour’s Grant Robertson.     There are various things in each interview that I might comment on in the next few days –  including in particular Robertson’s comments on his plans re the Reserve Bank.

In the interview with Joyce, this blog even got a mention, as the Minister was forced to concede that five years of no productivity growth (at least as measured at present) might perhaps be something that should be taken seriously.

“Productivity has been a struggle everywhere. If you look across the eight years – and let’s be clear, these people that talk about productivity measures over a year, they’re really…”
I cut in: former Reserve Bank economist, and Croaking Cassandra blogger Michael Reddell’s talking about the last five years, when productivity growth has been negative by most measures.
“Five years is getting more like it,” he accepts. “The thing about measuring productivity is it’s generally measured more effectively a couple of years after the fact, which is very frustrating for those us who are focussed on it,” he said.

So now, apparently, we are reduced to just hoping that the last few years’ data end up revised away?  Maybe……

But today I wanted to focus on Joyce’s comments around the New Zealand export performance and the government’s export target, partly because on this occasion he has articulated his perspective more fully than I’ve seen previously.     Here is the heart of that section of the interview

I ended by putting a couple of numbers to Joyce – one was on the goal to increase exports as a proportion of GDP from 30% to 40% by 2025. It hasn’t shifted from 29% since 2008. Is he disappointed?
“I’d like to see more growth in that.” He couldn’t really have said much else. “But you have to go and look at what’s been happening under the hood. And under the hood, world trade intensity has dropped.
“So, if you look at New Zealand relative to say, your Singapores, your Denmarks or so on, which are the big traders, they’ve gone back a bit, because we’ve had an extended period of a decline in world trade,” he says.
“We’ve held our own. Again, it’s nothing to write home about necessarily, except that we haven’t slipped back the way other countries have.”
Another thing New Zealand had been dealing with was our biggest export had been “down a bit of a hole over the last two or three years,” Joyce said (about dairy).

Actually, Tarrant’s introduction is a bit generous.   Exports as a share of GDP in New Zealand were 29.2 per cent in the year to March 2008, rose quite a bit when the exchange rate plummeted in the following year, but were down to 26.7 per cent in the year to March 2017.  The last time the export share was lower than that was 1990.

exports 1

What of the Minister’s claim about what’s gone on in the rest of the world?   It isn’t entirely clear how relevant it is to New Zealand anyway, given that the government has set, and regularly updated, the New Zealand target, including in the Business Growth Agenda refreshes as recently as this year.  But set that to one side for the moment.  What do the data show, and how do we compare?

For the whole world, the best source of data is the World Bank.  Often it is only available with a bit of a lag.

exports 2.png

For the world as a whole, exports as a share of GDP have indeed dropped slightly since 2007 or 2008.  But that is very largely a China story –  after a couple of decades of very strong export-led growth, the story of China in the years since the 2008/09 recession has been a domestic credit and infrastructure phase.  The foreign trade share of GDP has fallen back a long way –  and is probably still above what would expect in the long-term for a country the size of China.    For high income countries (a World Bank category) exports haven’t grown markedly as a share of GDP, but they have grown.  Of the Minister’s other examples, Singapore’s export share is very high and quite volatile, and has fallen back somewhat  –  as I illustrated in a post a few months ago, they’ve had a huge increase in their real exchange rate –  but Denmark’s hasn’t.

The usual group we compare New Zealand against is the other advanced economies in the OECD.   Here is how New Zealand has done relative to the median OECD country.

exports 3.png

The shifts aren’t dramatic but (a) we’ve done less well than them, and (b) we were the country whose government set a target for a dramatic change.

If we use calendar year 2007 as a reference point (the last full year before the recession), there are a few countries whose (nominal) export share of GDP has dropped by materially more than New Zealand’s.  They are Chile, Israel, and Norway.   Of them, Chile and Norway have experienced very substantial falls in their terms of trade –  sustained falls in copper and oil prices.    By contrast, New Zealand(despite the ups and downs in dairy prices) and Israel have had the largest increases in the terms of trade of any OECD country over that (almost) decade.  All else equal, a rising terms of trade should have tended to lift a country’s export share of GDP relative to those in other countries (matched, in time, by a higher import share of GDP, as the proceeds of the better prices are spent).

All of these numbers to date have been measures of the nominal value of exports relative to nominal GDP.  The government has expressed its export target in terms of volumes.  As I’ve noted before, ratios of real variables don’t make a lot of sense, and Statistics New Zealand advises against using them.   But one way of looking at volumes that does make some sense is to compare the volume growth of exports to the volume growth of GDP over a reasonable period.  In this case, I’ll look at the most recent year (to March 2017) relative to that last pre-recession year, calendar 2007.

In this chart I have calculated the total percentage growth in the volume of exports since 2007 and substracted from that the total percentage growth in real GDP over that same period.  (It might be more proper to do this multiplicatively, but I’ve checked and it doesn’t change the rankings.)

exports 4

There are OECD countries that have had a weaker relative export volume performance than New Zealand over this period, but not many.  And the median country’s experience is very different than ours has been.  And that is even with all those subsidised additional education exports and (as the Opposition parties might note) additional unpriced water pollution and methane emissions associated with the growth in agricultural exports.

Recall too that the whole logic behind the government’s export target was about closing some of those income and productivity gaps to the rest of the advanced world.  As Mr Joyce noted elsewhere in that same interview “productivity has been a 30 to 40-year issue for New Zealand” (longer than that actually).    One of the ways in which sustainable success of an economy tends to manifest is in the ability of firms based in a country to sell more stuff successfully abroad, enabling us to purchase more stuff from them.

In a post the other day, I highlighted our experience relative to a bunch of other countries that had been setting out to catch up, eight (now) fairly-advanced central and eastern European former communist countries.

Here is how (nominal) exports as a share of GDP have done in New Zealand and in those countries since 2007.

exports 5

and here is a chart showing the gap between the growth rate of export volumes and the growth rate of real GDP (again, latest 12 months compared to calendar 2007).

exports 6

And, drawing this towards a close, in case anyone was hoping (against hope) that the services sector might provide a more encouraging export story (death of distance as technology advances etc) here is the chart of how services exports as a share of GDP have done.

exports 7.png

But no.

Were I trying to make a case for the defence, I would highlight two relevant considerations that Steven Joyce didn’t mention:

  • first, the impact of the Canterbury earthquakes.  Real resources have had to be used for the repair and rebuild process that simply couldn’t be used elsewhere (eg to build export industries), particularly as much of the cost was covered by offshore reinsurance (which gave people cash, but not more real resources to do the rebuilding with).  As that phase passes, resources will be freed up and we might expect them to flow back towards the tradable sectors of the economy,
  • second, the unexpected sharp and persistent reduction in interest rates which (for a country with a large private external debt) represented a considerable windfall.  We have been able to consume more without having to produce (or export) more.  It is a windfall, but in the longer-run it is no substitute for a policy climate that supports productivity growth and the growth in both the export and import share of our economy.

And, on the other hand, you might have noticed that I mentioned earlier that Israel had been somewhat like us.  Exports as a share of GDP had fallen further than in New Zealand, and the terms of trade had increased over the last decade by about as much as New Zealand’s had.   The other thing that constantly marks out Israel is the rate of population growth, from a mix of high (but falling) birth rates and high rates of immigration.    Israel’s population has increased by just over 20 per cent since 2007  (New Zealand’s population has increased quite rapidly by international standard, but “only” by about 12 per cent).

Just like the earthquake story, real resources required to build the considerable infrastructure (houses, road, offices, factories, schools etc) associated with a rapidly growing population aren’t available for growing other industries.  In New Zealand’s case that rationing process works through a persistently high real exchange rate and real interest rates persistently high relative to other advanced countries.   I’ve written previously about Israel’s underwhelming long-term productivity performance, and suggest that, as with New Zealand, rapid population growth in an unpropitious location, has made it hard for firms based in either country to take on the world (economicially) and succeed.   The experience of recent years –  remember, no productivity growth at all in New Zealand for five years now – looks like another straw in the wind in support of that suggestion.

Relative to the government’s target, export performance in New Zealand has been poor.  Relative to other advanced countries, it has also been poor.  And all that notwithstanding very favourable terms of trade.   Exports aren’t everything by any means, but the only OECD country in the last decade that has had a worse overall export performance than New Zealand and had a good terms of trade has been the one advanced country with a consistently faster rate of population growth.   Export volumes have grown quite a lot in the last decade – just over 20 per cent –  but they’ve barely kept up with overall GDP growth (in most countries, there has been much more export volume growth), and even then only through new subsidies (export education) and unpriced environmental externalities.  It is a flawed strategy.  And it is an unsustainable one.


The big projected deficits in 2008

As part of the current political debate about the relative capability of the two main parties to manage the government finances responsibly, I sometimes see references to the large deficit forecasts that greeted the incoming National government in 2008.

I wrote about this issue a few months ago, in response to some specific claims made by one analyst at the time.  I’m reproducing the bulk of that post below (not indented).  My bottom line, supported with documentation is

But on best Treasury advice, the then Labour government thought they were leaving an essentially balanced budget [ie the 2008 Budget, their final fiscal policy choices], on top of an already very low debt level, not deficits.

It is certainly true that when the current government took office in November 2008, official fiscal forecasts showed large deficits for many years into the future.  But the last fiscal initiatives of the outgoing Labour government had been the 2008 Budget, the parameters for which were set out in the Budget Policy Statement released at the end of 2007.

Throughout much of the previous Labour government’s term of office, a key theme of fiscal policy developments had been the surprising strength in revenue.  It was, in many respects, why the fiscal surpluses were so large during those years –   Treasury and the government kept being taken by surprise, and Treasury was (prudently) cautious about treating the surprises as permanent.  If it was just a series of one-offs, or something cyclical, it wouldn’t have made sense to increase spending or cut taxes in response.

The Treasury gradually revised upwards their assessment of the underlying fiscal position.  Unfortunately, they took a particularly optimistic stance by the end of 2007.  I can recall the then Prime Minister making much of the fact that Treasury was now assuming that most of the revenue gains would prove permanent (and thus could support some mix of increased spending and lower tax rates) without the risk of dropping back into deficits.  I joined Treasury on secondment in mid-2008 and I have seen documents written to the Minister of Finance during early 2008 stating that reassessment.  I was under the impression that some had been released, perhaps as part of the pro-active release of 2008 Budget papers, but on checking that link on the Treasury website, I couldn’t see the paper in question.

But the facts of the reassessment aren’t in dispute.  Several Treasury staff produced a paper last year on the process of getting back to surplus, including the background to the deficits.  Here is what they had to say

Over the period 2005-2008, the Treasury increased its estimates of structural revenues by around 1 percentage point of GDP each year, and by 2008 the Treasury considered most of the operating surplus was “structural”

and

When the tax reductions [along with further spending increases] were announced in Budget 2008, the Treasury was still predicting the operating balance to remain in surplus through the forecast period, albeit at a lower level.

With the benefit of hindsight, the degree to which the surpluses were structural was overestimated. Although the tax reductions announced in 2008 turned out to be well-timed from the perspective of stabilising the economy following the GFC, their permanent nature added to the subsequent structural deficits.

Here is the chart from the 2008 Budget Economic and Fiscal Update.

2008 Budget forecast obegal

That document was signed off  by the Secretary to the Treasury as representing his best professional assessment of the economic and fiscal outlook, incorporating the effects of announced government policy.  In New Zealand –  unlike many countries – the forecasts are those of the professional advisers, not those of the Minister of Finance.

On the basis of the economic and fiscal information available to it, the Treasury has used its best professional judgement in supplying the Minister of Finance with this Economic and Fiscal Update. The Update incorporates the fiscal and economic implications both of Government decisions and circumstances as at 9 May 2008 that were communicated to me, and of other economic and fiscal information available to the Treasury in accordance with the provisions of the Public Finance Act 1989.

John Whitehead
Secretary to the Treasury

14 May 2008

The projected surpluses by the end of the forecast period were tiny –  essentially the budget was projected to be in balance by then.  The economic and revenue outlook had worsened over the first few months of 2008, after the broad parameters of the Budget had already been sketched out in the BPS.   As we now know, New Zealand was already in recession by May 2008.   But on best Treasury advice, the then Labour government thought they were leaving an essentially balanced budget, on top of an already very low debt level, not deficits.

Of course, the government was wrong in that assumption.  But, specifically, Treasury was wrong in its best professional advice.    Perhaps the government would have run quite expansionary discretionary fiscal policy anyway, even if Treasury had been less optimistic about how permanent the revenue was.  They were, after all, behind in the polls, and the PM’s office –  didn’t Grant Robertson work there? –  would no doubt have been putting a lot of pressure on the Minister of Finance.  But that hypothetical didn’t arise.    They didn’t have to make such awkward political choices –  their own professional advisers told them they could have tax cuts and spending increases, and still keep the budget in (modest) surplus.  The Opposition National Party shaped its, more generous, tax cutting promises on much the same sort of Treasury forecasts and estimates.  (And a few years earlier, the 2005 election had partly been a bidding war as to how best to spend the surplus –  not whether there really was a structural surplus).

It wasn’t Treasury at its finest.  It is, perhaps, a reason to be cautious about just how much a fiscal council might add.   Would such a body, faced with similar circumstances –  a long succession of revisions upwards in revenue –  have really reached materially different judgements about the outlook then?  Perhaps.  We can’t know, but back in 2008 Treasury was using its best professional judgement, and the mistakes were still made.

There is a bit of a tendency afoot to suggest that the current National-led government has done a better job of fiscal management than the previous Labour government did.  I’m not really convinced by that story.   I’d accept that the previous government might have had an easier job than the current government has –  since one inherited modest but growing surpluses, while the other inherited deficits.  The current government had some nasty shocks (earthquakes) but also some of the best terms of trade in decades and the weakest wage pressures.      But if we expect our politicians to be guided by professional advice in areas like this, the previous government did what most orthodox opinion advised them to, keeping on delivering surpluses and reducing outstanding debt.  Probably they should have emphasised tax cuts more than spending increases, but this particular debate is about overall fiscal balances.

By the end of Labour’s term, government spending as a share of GDP was rising a lot –  but then Treasury was telling the government the money was there to spend.  And for all the talk of how the new Labour/Greens rules commit a new left-wing government to keep spending at around current National government levels, that level is around the average level that prevailed under the previous Labour government.

core crown expenses

There are things I’d criticise about the previous government’s policy. Allowing big structural surpluses to build up, as happened in the first half of the term, set the scene for a big spend-up later (which would have been big tax cuts if National had won in 2005). It is probably better to recognise the limitations of knowledge and typically keep both surpluses and deficits small. But it is easier to say in hindsight than it might have been at the time.  And in 1999 [when Labour had come to office], the severe fiscal stresses of 1990/91 were pretty fresh in everyone’s memory.

Thoughts prompted by Joyce vs Robertson

If Steven Joyce had simply noted that the Labour Party appears to have made so many specific policy promises that if they were to form the next government it would be very hard to deliver on those specific policy commitments, meet ongoing increases in the cost of normal government activities, and yet at the same time meet the specific spending, surplus, and debt numbers they’ve outlined in their fiscal plan, a useful and constructive exchange might well have followed.  My summary stance: I think that looks like a reasonable conclusion.  How much it matters probably depends largely on how much weight you put on the importance of those surplus and debt numbers.

I didn’t read the Labour fiscal plan when it was released.  The specific policy promises had already been announced and in an MMP era, in particular, documents of this sort always seem like not much more than opening offers going into potential negotiations around the formation, and conduct, of a new government.    They also involve a degree of ritual obeisance to the belief that economic forecasts have much value; a ritual belief that while entirely conventional leaves me cold (whether opposition parties or government agencies are doing it).

None of us knows what the terms of trade will do over the next few years, or net migration, or the myriad of other things here and abroad that will affect the economic and fiscal outlook.  Even the rate of inflation will affect how large the operating allowance should sensibly be each year (since it is nominal –  and cost pressures will be different if the Reserve Bank delivers inflation at 1.2% than if it delivers 2.2% inflation).   Of course, we want specific promises to be costed, and on a multi-year basis.  But this debate hasn’t been about specific policy costings.  And beyond that, the amount of information in these documents is really quite limited.   Among other things, Labour’s numbers use exactly the same GDP track as in the PREFU, but presumably they expect their wider economic policy measures to make some difference to that (eg somewhat less immigration  –  at least in the first year –  and perhaps appointing a Reserve Bank Governor who might generate a bit less unemployment and a bit more inflation –  two measures deliberately used here because they have offsetting effects on nominal GDP).

But, for now, lets play the game.

Labour has laid out their numbers in a series of summary tables.  They have explicitly identified numbers for each of their (revenue and expenditure) major policy initiatives, and made explicit summary provision for the cost of a group of less expensive policies.  And they identified how much (or little) still unallocated money they would plan to have available.   The resulting operating surplus numbers are almost identical to those in PREFU, but where they do take on a bit more debt –  to fund NZSF contributions and the Kiwibuild programme – they also allow for additional financing costs.

And then they had BERL go through the numbers.    People on the right are inclined to scoff at BERL and note that they are ideologically inclined to the left.  No doubt.  But all they’ve done on this occasion is a fairly narrow technical exercise.  They haven’t taken a view on the merits of any specific policy promises or even (as far I can see) on the line item costings Labour uses.  And they haven’t taken a view on the ability of a Labour-led government to control spending more broadly.   They’ve taken the Labour numbers, and the PREFU economic assumptions and spending/revenue baselines, and checked that when Labour’s spending and revenue assumptions are added into that mix that the bottom line numbers are

consistent with their stated Budget Responsibility Rules and, in particular

  • The OBEGAL remains in surplus throughout the period to 2022
  • Net Core Crown debt is reduced to 20% of GDP by June 2022
  • Core Crown expenses remain comfortably under 30% throughout the period to 2022.

An economics consultancy with a right wing orientation would have happily signed off on the same conclusion.  The numbers add up, on the material they were given.  In that sense, there is no $11.7 billion “fiscal hole” and the opening claim by Steven Joyce on Monday was simply wrong.   Arguably, irresponsibly so from a serving Minister of Finance.

But where there is more of an issue is that Labour’s spending plans on the things they are promising mean that to meet these surplus and debt objectives, on these macro numbers, there is very little new money left over in the next few years.     That might not sound like a problem –  after all, why do they need much “new money” in the next few years when the things they want to do are already specifically identified and included in the allocated money in the Labour fiscal plan.      The answer to that reflects the specifics of how the fiscal numbers are laid out, and how fiscal management is done.   Government departments do not get routine adjustments to their future spending allowances to cope with, say, the rising demands for a rising population, or the increased costs from ongoing inflation (recall that the target is 2 per cent inflation annually).   Rather, they are given a number to manage to, and only when the pips really start squeaking might a discretionary adjustment to the department’s baseline spending be made.  Any such discretionary adjustments comes from the “operating allowance” –  which thus isn’t just available for new policies.

You can see in the PREFU numbers.   Health spending rose around $600 million last year, and is budgeted to rise by around $700 million this year (2017/18).  And then….

$m
2017/18 16432
2018/19 16449
2019/20 16481
2020/21 16396

No one expects health spending to remain constant in nominal terms for the next three fiscal years.  But there will need to be conscious decisions made in each successive Budget to allocate some of the operating allowance to health –  some presumably to cover new policies, and much to cover cost increases (wages, drugs, property etc, and more people), all offset by whatever productivity gains the sector can generate.

And here is why I think there are questions about Labour’s numbers.  By 2021, they expect to be spending $2361 million more on health than is reflected in these PREFU numbers.     About 10 per cent of that increase is described as “Paying back National’s underfunding” and the rest is labelled as “Delivering a Modern Health System”.

This is how they describe their first term health policies

Reverse National’s health cuts and begin the process of making up for the years of underfunding that have occurred. This extra funding will allow us to invest in mental health services, reduce the cost of going to the doctor, carry out more operations, provide the latest medicines, invest in Māori health initiatives including supporting Whānau Ora, and start the rebuild of Dunedin Hospital.

That sounds like an intention to deliver materially more health outputs/outcomes (ie volume gains, or reduced prices to users).

In response to Steven Joyce’s attack, Grant Robertson is reported as having told several journalists that Labour’s health (and education) numbers include allowances for increased costs (eg rising population and inflation  –  and inflation in the PREFU is forecast to pick up) as well as the costs of the new initiatives.   Perhaps, and if so perhaps a pardonable effort to put a favourable gloss on the proposed health (and education) spends –  ie sell as new initiatives what are in significant part really just keeping with cost and population pressures.  I say “pardonable” because governments do it all the time.

In this chart, I’ve shown core Crown health expenditure as a share of GDP since 2000, and including Labour’s plans for the next three budgets.  (Labour show total Crown numbers, but I’ve taken their policy initiative numbers –  ie changes from PREFU –  and applied them to the core Crown data, which Treasury has a readily accessible time series for.  The differences between core and total Crown in this sector are small.)

Labour health

In other words, on these numbers health as a share of GDP over the next three years would be less than it was for most of the current government’s term, and virtually identical to what it was in Labour’s last full year in government, 2007/08.    Some of the peaks a few years ago were understandable –  the economy was weak, and recessions don’t reduce health spending demands.  But even so, we know that there are strong pressures for the health share of GDP to increase, as a result of improving technology (more options) and an ageing population.  Treasury’s “historical spending patterns” analysis in their Long-term Fiscal Statement last year had health spending rising from 6.2 per cent of GDP in 2015 to 6.8 per cent in 2030.

Without seeing more detail than Labour has released there really only seem to be two possible interpretations.  Either Labour hasn’t allowed for the ongoing (ie from here) population and cost increases in their health sector spending numbers, or there must be much less in the way of increases in health outputs than the documents seem to want to have us believe (eg “reversing years of underfunding”).  One has potential fiscal implications.  The other perhaps political ones.    Glancing through Labour’s health policy, which seems quite specific, I’m more inclined to the former possibility (ie not allowing for population and cost pressures), but I’d be happy to shown otherwise.

Eyeballing that chart –  and as someone with no expertise in health –  it would look more reasonable to expect that health spending might be more like 6.5 per cent of GDP by the end of the decade, in a climate where a party is promising more stuff not less, and with no strategy to (say) shift more of the burden back onto upper income citizens.

One could do much the same exercise for education.  Labour has seven line items in its “new investments” table.  Most of them are very specific (including increased student allowances and the transitions towards zero-fees tertiary education).     There is a general (large) item labelled “Delivering a Modern Education System” but in the manifesto there are a lot of things that look like they are covered by that.    There isn’t any suggestion that general inflation and population cost increases are included, but perhaps they are.  But again, here is the chart of education spending as a share of GDP, including Labour’s numbers for the next three years.

labour education.png

I’m not altogether sure what some of those earlier spikes were (perhaps something to do with interest-free student loans), but again what is striking is that Labour’s plans appear to involve spending slightly less on education as a share of GDP than when they were last in government.  And that more or less flat track from here doesn’t suggest a party responding to this stuff

National has chosen to undermine quality as a cost-saving measure. After nine years of being under resourced and overstretched, our education sector is under immense pressure and the quality of education is suffering. The result is a narrowing of the curriculum, more burnt out teachers, and falling tertiary education participation.

and at the same time committing to flagship policies around things like student allowances and fee-free tertiary study.

Again, it begins to look as though Labour has included in its education numbers the ongoing multi-year costs of its own new policies, but not the ongoing cost increases resulting from wage and price inflation and population increases.  Again, I’d happily be shown otherwise.

Of course, there is some unallocated spending in Labour’s numbers, but the amounts are very small for the next few years, and some of these sectors are very large.  And although population growth pressures are forecast to ease a little in the next few years, inflation is forecast to pick up and settle around the middle of the target range, so there are likely to be increased general cost pressures (including, for example, wage pressures if as Labour state in the fiscal plan document “by the end of our first term, we expect to see unemployment in New Zealand among the lowest in the OECD, from the current position of 13th”).

How much does it matter?  After all, we don’t know many specifics on the policy initiatives National (and/or its support partners) might fund in the next term, and there was the strong suggestion the other night of a new “families package” in 2020 (which would come from any operating allowance).  Quite probably the next few years will be tough, in budget terms, for whoever forms the government.  After all, the terms of trade isn’t expected to increase further, and inflation is.  And there is a sense that in a number of areas of government spending things have been run a bit too tight in recent years.      On the other hand, Labour participated in this ritual exercise and it looks as though they may have implied rather more fiscal degrees of freedom than were actually there, if –  critical point –  they happened to want to produce a surplus track very like National’s.    Gilding the lily isn’t unknown from either side of politics of course.

But perhaps the bigger question one might reasonably put to both sides is why the focus on (almost identical) rising surpluses?   These are the numbers.

labour surplus
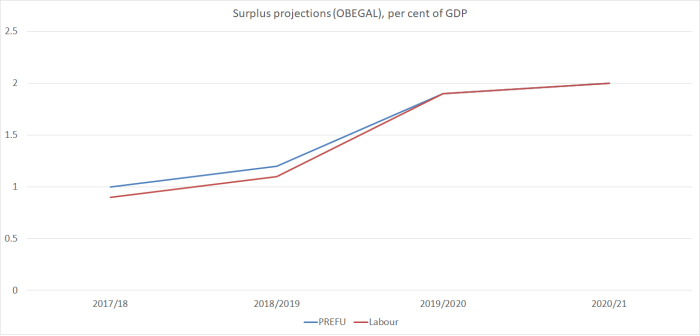
When net core Crown debt is already as low as 9.2 per cent of GDP –  not on the measure Treasury, the government and Labour all prefer, but the simple straightforward metric –  what is the economic case for material operating surpluses at all?   With the output gap around zero and unemployment above the NAIRU, it is not as if the economy is overheating (the other usual case for running surpluses).   Even just a balanced budget would slowly further lower the debt to GDP ratios.   One could mount quite a reasonable argument for somewhat lower taxes (if you were a party of the right) or somewhat higher targeted spending (if you were a party of the left, campaigning on structural underfunding of various key government spending areas).

Labour is promising to spend (and tax –  thus the surpluses are the same) more than National.  But their commitment (rule 4) was to keep core Crown expenditure “around 30% of GDP”, not “comfortably below 30 per cent”.

labour spending

28.5 per cent is quite a lot lower than 30 per cent (almost $5 billion in 2020/21 – not cumulatively, as GDP is forecast to to be about $323 billion). And 30 per cent wasn’t described as a ceiling. And in the last two years of the previous Labour government, core Crown spending was 30.6 per cent of GDP (06/07) and 30 per cent of GDP (07/08).

It is a curious spectacle to see a party campaigning on serious structural underfunding of various public services and yet proposing to cut government spending as a share of GDP.  It would be difficult to achieve –  given the various specific policy promises –  but you have to wonder, at least a little, why one would set out to try.     We simply aren’t in some highly-indebted extremely vulnerable place.

Finally, the affair of the last 48 hours has revived arguments for some sort of offiical costings unit to be set up, as Labour and Greens have called for (in their Budget Responsibility Rules) and people like the New Zealand Initiative have also apparently favoured.  I’m much more sceptical of such proposals, and covered some of the reasons in earlier posts (when the Greens first made a play of this issue last year, and when the Labour/Greens rules were announced).   I support the idea of a Fiscal Council –  as Labour/Greens have proposed, and as past external reviewers have suggested  –  although would favour something more macroeconomic focused (ie advice and review functions on monetary policy as well as fiscal policy), but I don’t think the case for a costing unit has been made.

As I noted in one of those earlier posts

On balance, I still think there is a role for something like a (macro oriented) fiscal council in New Zealand, perhaps subsumed within the sort of macroeconomic or monetary and economic council I suggested here (but perhaps that just reflects my macro background).   And there is probably a role for better-resourcing select committees.  But when it comes to political party proposals, if (and I don’t think the case is open and shut by any means) we are going to spend more public money on the process, I would probably prefer to provide a higher level of funding to parliamentary parties, to enable them to commission any independent evaluations or expertise they found useful, and then have the parties fight it out in the court of public opinion.  The big choices societies face mostly aren’t technocratic in nature, and I’m not sure that the differences between whether individual proposals are properly costed or not is that important in the scheme of things (and perhaps less so than previously under MMP, where all promises are provisional, given that absolute parliamentary majorities are very rare).  If there are serious doubts about the costings, let the politicians (and the experts each can marshall) contest the matter.

And this particular dispute wasn’t even about the details of the costings of individual policy proposals.  It seems to have been more or less sorted out through the cut and thrust of political debate and expert commentary.  That feels to me like the way I’d want the system –  competing political parties, open democracy – to work.  No non-partisan experts can reasonably decree that one set of spending plans is or isn’t feasible or appropriate –  much of that is inevitably about politics.     There are gaps in our debate –  it was notable in the last couple of days that no academics were quoted, even though for example, Victoria University likes to hold itself out as policy-focused, and they even have a professorial chair in public finance –  but it isn’t clear that spending more taxpayers’ money to cost political party proposals (according to the particular model of that particular group of technocrats) is a high priority use for scarce fiscal resources.

(I noticed a couple of journalists last night describing me as “dryish right” and thus happy to fling mud at Labour.  I’d probably accept “dryish right” broadly speaking, but I’m sufficiently disillusioned with the total failure of this government to deal with housing, and the failures (and, what are in effect, lies) around productivity growth that I’d be more than keen to see a serious credible alternative.  As it happens, Labour’s policies around monetary policy and the Reserve Bank –  issues of some importance to me, even if not of wide general interest – seem to be heading the right direction.  I’m more sceptical as to whether they have more of an effective economic strategy than the government does.  Which is by way of saying that I like to think I’m an equal opportunity sceptic –  who doesn’t usually vote on economic issues anyway –  and if some of this post does identify some challenges for Labour, it isn’t because I’m champing at the bit to see Mr Joyce succeed.)


Unpicking Steven Joyce’s press release

As I noted yesterday afternoon, Steven Joyce had put out a press release on productivity.  The press release was a mix of policy-based digs at the Labour Party (which weren’t of any particular interest to me) and some statistical claims, some of which seemed more or less reasonable and others not.   My post yesterday afternoon briefly responded to some of those points.

The press release made these claims

On one of the key measures of productivity, GDP per hours worked, New Zealand’s productivity has lifted nearly 10 per cent since National came into office. That’s a faster rate than the UK, Canada, the US, the EU, the G7 and the average across the whole OECD.

“The last time Labour was in office, it was the reverse. Our productivity growth was 5.5 per cent over eight years and much slower than all those other economies.

I wasn’t quite sure where the Minister had got his numbers from, but was going to just let the matter lie.  After all, the point that people like me have been making for some time, and which the Labour Party had picked up on, was that there has been no productivity growth in New Zealand for the last five years or so.  And over the longer run of history, everyone knows our performance has been relatively poor, although for some sub-periods we’ve done better than others –  at times more or less matching the growth rates of other advanced economies.    And since no one thinks that economies suddenly change, for better or worse, immediately on changes of government –  and in recent decades, the policy changes from one government to another hadn’t been large anyway –  I wasn’t overly interested in the narrow partisan point as to whether average productivity growth had been better under this government or its predecessor.

But I couldn’t help myself.   And a story by Bernard Hickey alerted me to the fact that the Minister had used these numbers, or ones very like them, in answer to a parliamentary question a few weeks ago.    With less rounding, the Minister then said that “another measure used by the OECD is GDP per hour worked, which has increased 9.6 percent since 2008”.    The answer to the PQ suggested Treasury had probably supplied the numbers, so I was curious as to whether I could work out what had been done.

The most likely source was OECD data, which are only reported on an annual basis.   So I found the OECD’s table showing the level of real GDP per hour worked, in real (“constant price”) national currency terms.    And, sure enough, on that measure the OECD reports real GDP per hour worked having increased by 9.6 per cent from 2008 to 2016.   For quite a few countries (about a third of the total) the OECD doesn’t yet have full year 2016 data for this variable.   So the Minister’s observations about how New Zealand has done relative to other countries seem to use comparisons between 2008 and 2015.

And here is a chart of that data.

joyce 1

I wouldn’t put much weight on the Irish number (which goes off the chart, having to do with tax-related anomalies in their national accounts), but on this particular OECD-reported measure, over this particular period, only 10 OECD countries did better than New Zealand.  Hence Mr Joyce’s claims.

But there are some pretty serious problems with the comparison (even setting aside the fact that it is now mid-late 2017).  There is an old line about OECD data –  you trust (or at least use) every country’s data except your own.  Typically, that is because you know the pitfalls in your own country’s data and not always the pitfalls in data from other countries.   But here the problem is a bit different.  Specifically, the OECD’s data for productivity growth in New Zealand doesn’t bear much relationship to the New Zealand data itself.   From memory, when I’ve tried to do these comparisons before I’ve just replaced the OECD New Zealand data with SNZ data.     The OECD don’t have data of their own, and they must do some transformations of the data they get from here, but not ones that are readily open to scrutiny.

As I’ve explained previously, when I do charts of New Zealand productivity performance over recent years I average the expenditure and production measure of GDP, and divide by HLFS hours worked (corrected for the series break last year).    But I remembered last night that the OECD prefers to focus on the expenditure measure of GDP.  Many New Zealand analysts focus on the production measure  (which, a long time ago, was less volatile).  And although I use the HLFS, there is also a QES measure of hours.   That gives one quite a range of ways to calculate GDP per hour worked, even on an annual basis.

Percentage growth
2008 to 2015 2008 to 2016
Expenditure GDP/HLFS hours 8 7.6
Expenditure GDP/QES hours 4.8 5.3
Production GDP/HLFS hours 5.6 4.8
Production GDP/QES hours 2.4 2.5
Expenditure GDP/average of the two hours series 6.4 6.5
Production GDP/average of the two hours series 4 3.7
Average of the GDP measures/HLFS hours 6.7 6.2
Average of the GDP measures/QES hours 3.6 3.9
Average GDP measures/Average hours measures 5.2 5.1
Average of all these measures 5.2 5.1

Replacing the OECD’s questionable New Zealand numbers in the chart above with our own data –  highest, lowest, and average from this table –  makes the chart look like this.

joyce 2

On none of these measures did we quite match the performance of the median OECD country over this period.    It is fair to note that over the first half of the period –  2008 to 2012 – we did match, or even modestly exceed, the productivity growth of the typical OECD country.

But here’s the thing: across those nine possible New Zealand annual measures (see table above), not one has shown any growth in productivity at all over the (most recent) four complete years from 2012 to 2016.  The estimates are tightly bunched –  between a cumulative fall of 0.6 per cent, and a cumulative fall of 1.2 per cent.    All those numbers are prone to revisions, mainly as the GDP numbers themselves are revised, but for now they simply reinforce the point I and others have been making for some time: there seems to have been no productivity growth at all in New Zealand for some years now.

But what about the comparisons the Minister of Finance was making with productivity growth performance during the term of the previous government?   He asserted that

The last time Labour was in office, it was the reverse. Our productivity growth was 5.5 per cent over eight years and much slower than all those other economies.

So I went to the same OECD spreadsheet he seemed to have taken his productivity growth number from in talking about the current government’s term.   On that OECD measure, productivity had grown by 10.6 per cent over the whole period 1999 to 2008, or by 7.4 per cent over the eight years the Minister appears to focus on (2000 to 2008).

But what did the New Zealand data itself show?  I went back to the nine different measures (see above).  For the full period 1999 to 2008, across the nine measures there was a range from 7.3 per cent to 13.0 per cent growth in real GDP per hour worked.  The average of those measures was a 10.2 per cent increase.   I couldn’t quite replicate the 5.5 per cent number the Minister quotes for 2000 to 2008, but on one of the nine measures productivty growth in that period had been 5.8 per cent  (close enough I guess).

And how did other advanced countries do over the term of the previous New Zealand government?  Between 1999 and 2008 the median OECD country had productivity growth of 15.7 per cent.   So, as the Minister pointed out, productivity growth lagged that in other advanced countries during the term of the previous government.

The data go back far enough to also look at the experience under the 1990 to 1999 National government.  As ever, a reminder that comparisons between the experience in different terms of office have little or no economic meaning.  But, for what it is worth, here are the summary results.  Because the OECD doesn’t have annual data for quite a few countries past 2015.  I haven’t included numbers for the median OECD country for the last two lines.

Total growth in real GDP per hour
Range of NZ measures Average of measures Median OECD country
National 90 to 99 10.7 to 13.4 12 19.5
Labour 99 to 08 7.3 to 13.0 10.2 15.7
National 08 to 15 2.4 to 8.0 5.2 7.0
National 08 to 16 2.5 to 7.6 5.1
Last four years -1.2 to -0.6 -0.9

I’ll leave you to draw your own conclusion.  My overarching one remains that for 70 years or so our productivity growth has underperformed that of other advanced countries, and there has been no extended period in that time, under any government, when any progress has been made in closing the large (levels) gaps that have opened up between productivty here and that in much of the rest of the advanced world.

To facilitate the cross-country comparisons all the numbers and charts in this post so far have used annual data only.

For shorter-term, and more timely, analysis, one can use quarterly seasonally adjusted data  (that is what I usually do when, for example, I’ve shown the chart of how productivity growth performances in New Zealand and Australia have diverged in recent years).   I usually use just one of the measures (average of the GDP measures divided by HLFS hours).  But again there are nine potential measures, as per the first table above.   This chart shows the average growth rate across those measures in each of the periods shown.

quarterly

There are no direct comparisons possible to a big group of other advanced countries.  But in each of these four periods productivity growth, on this summary measure, has been less than that in Australia.

In this chart, I’ve shown all nine measures indexed to 2007q4.  That doesn’t align neatly with political terms, but I find it a more useful dating for economic analysis, starting just prior to the start of the recession (here and abroad).

real GDP phw qtrly

You can see that there is quite a big difference in what the various measures show for productivity growth over the first few years (and in particular from around 2010 to 2012 –  by 2012 the lines are a fair way apart).  There are some puzzles for people to work through about just how New Zealand did during that period,   But, again, there isn’t much difference in the growth rates (or lack) of them over the last five years.  That is even more stark if we look just at the last five years, indexing each of the series to 100 in 2012q1 (and noting the compressed scale of the chart).

real GDP phw 2012q1 base

Not one of the measures shows any material productivity growth over the last five years taken together.  And although there are some divergences in the last couple of years –  while we wait for SNZ to revise, and increasingly reconcile, the two GDP measures –  there isn’t any sign of the trend changing even in that very recent period.

Global productivity growth has been pretty weak since around 2005 –  ie before the recession and (domestically) the change of government.   But having no productivity growth at all here for five years now doesn’t look to be just an international phenomenon.  In fact, from the same table the Minister quoted from, productivity growth in the median OECD country in the last four years appears to have been around 0.8 to 0.9 per cent per annum.

So as I suggested yesterday when the Prime Minister claims that “productivity in New Zealand has been growing pretty well”,  a response along the lines of “yeah right”  seems quite appropriate.  The last five years look particularly bad.


(Non-economist readers might well be surprised, or disillusioned, by the wide range of possible estimates of productivity growth in some particular periods.   Unfortunately that is the way things are.  Measurement is a real challenge, not helped in New Zealand by persistent underfunding of official statistics.)


Productivity growth in perspective

Someone sent me a copy of a press release put out today by the Minister of Finance, Steven Joyce, is his capacity as the chair of National’s campaign.    In it he claims that productivity growth over National’s term of government has exceeded that when Labour was last in office, and has exceeded that of many other OECD countries.

On the latter claim, over the whole of government’s term in office, my view is that it is a broadly fair description.  I’ve put out posts noting that we’ve been no better than middling over the whole period since just prior to the recession and financial crisis.  That didn’t seem to me to be a particularly good performance, in view of the fact that (a) we had a big lift in the terms of trade, (b) we didn’t have a domestic financial crisis, (c) weren’t in the euro and (d) we didn’t run out of room to use conventional monetary policy.  Oh, and we had a big levels gap –  we were a lot poorer –  and were supposed to be about catching up.

But my comments, and those of J B Were economist Bernard Doyle, have focused on the last five years or so.   Since then, on New Zealand official numbers, our productivity has gone slightly backwards –  ie the level now is slightly less than it was five years ago.    That is sufficiently stark, and has now gone on for long enough, that it seems worth singling out.   What, one might wonder, would be likely to turn that around?  (Frankly, I’ve seen nothing from either main party  –  or, for the avoidance of doubt, minor parties – that seems very promising.)   It is difficult to get very up-to-date useful data for many other countries, but over that five years we have certainly done less well than the US and Australia.

What about comparisons across terms of government?  We can only calculate the GDP per hours work series back to 1987, so I’ve shown  productivity growth in the term of the 1990s National government (1990q4 to 1999q4), the Labour government of the 2000s (1999q4 to 2008q4), and the current government (from 2008q4 with GDP data only available to 2017q1). I’ve also shown the last five years.

For each of those periods I’ve also shown the exactly comparable data for Australia.   Australia is one of the few countries for which exactly comparable (real, quarterly, national currency) data are available.  They are shown on the ABS website.  Australia is also a relevant comparator because (a) it didn’t have a domestic financial crisis, or (b) run out of monetary policy room, and (c) because it is the easiest alternative option for New Zealanders (migrating) and a standard historical comparator.  The aspiration of catching Australia was one the current government articulated when it came into office.

As a reminder, for New Zealand I have:

  • averaged the two real GDP series (expenditure and production).  Using one or the other alone will produce slightly different numbers, but there is no obvious reason to prefer one over the other, and
  • divided the resulting series by the HLFS hours worked series, and
  • corrected for a series break in the HLFS hours worked series in June 2016, when the survey question was changed.  Not correcting for that would lower productivity growth estimates over the last few years by a further 2 per cent.

And this is the resulting table [UPDATE: with some very minor corrections]

Cumulative growth in real GDP per hour worked (per cent)
NZ Australia
National (90q4 to 99q4) 8.5 20.7
Labour (99q4 to 08 q4) 12.1 12.4
National (08q4 to 17q4) 6.7 13.7
Last five years (to 17q1) -0.2 7.5

As it happens, in not a single one of these particular periods did productivity growth in New Zealand exceed that in Australia  (although there will be shorter periods where we did).

There are other measures of course, but real GDP per hour worked is a pretty standard basis for comparison.  And to make such comparisons of growth rates sensibly (as distinct from levels comparisons) one shouldn’t use PPP-converted data but rather real national currency data as I have done here.

As a caveat, governments can’t take all the credit or all the blame for productivity trends in their time in office.  International trends matter, and even policies work with a lag.  Recessions affect comparisons – and I don’t suppose anyone is going to suggest the 2008/09 recession was either New Zealand party’s fault.      Partly for that reason I’ve suggested focusing on the distinctive, and disconcerting, New Zealand productivity performance over the last five years.  The relevant growth number is zero (or marginally worse).

On a declared candidate for Governor

Last week, we had an unusual public confirmation from a senior figure who  disclosed that they had applied for the job of Governor of the Reserve Bank.

I’m pretty sure it has never happened before in New Zealand.  The current Reserve Bank Act, which gives the lead role in appointing a new Governor to the Bank’s Board, has been in place since 1990, and this is only the third time there has been a vacancy to fill (as distinct from an incumbent being reappointed).  I can’t recall either in 2002 or in 2012 that anyone publicly disclosed their candidacy –  although in both cases, it was generally assumed that the incumbent deputies (Rod Carr and Grant Spencer) had applied.      It doesn’t happen in other countries, where the Governor of the central bank is generally appointed directly by the Minister of Finance or the President, without an advertised application process.  Again, sometimes it is widely known that someone is keenly interested –  eg in the US case a few years ago Larry Summers, the former Treasury Secretary –  but formal public confirmation is rare or unknown.

But in an (otherwise mostly unremarkable) interview with interest.co.nz’s Alex Tarrant last week, Reserve Bank Head of Operations and Deputy Governor, Geoff Bascand, confirmed his application

He’s put his hat in the ring for the Governor’s job. It’s been rumoured that he’d be the front-runner among the insiders if he wanted to stand, and now he’s confirming that he is going for it.

“The Reserve Bank matters to New Zealand’s economic performance and ultimately therefore to people’s welfare, and I’d like to be part of continuing to make this an excellent and strong institution, and to lead it in a way that it would be really successful for the next five years,” Bascand says.

If he doesn’t get it, then fair play to whoever does. Bascand says he’d like stay on in the Financial Stability role he’s about to take over when Grant Spencer moves into the Acting Governor position for six months starting late-September.

It is an unusual move.  In some respects, it is to his credit –  after all, one reason people don’t usually answer such questions is that it can be embarrassing to miss out, particularly if you are (or will be by then) the incumbent deputy, and perhaps more so if everyone knows you had applied.     But then it is presumably just another part of the multi-year effort by Graeme Wheeler to promote Bascand as his sucessor.   After all, the bulk of the interview (authorised by Wheeler) was about monetary policy and making sense of inflation –  normally issues that would be handled by either the Governor, or the Assistant Governor/Chief Economist, not by the chief operating officer responsible for things like notes and coins, security and property, communications, the operation of the securities settlement system, HR and the like.

Bascand’s background, of course, is in economics.  He started at Treasury, spent quite a bit of time at the old Department of Labour, running for a time its well-regarded Labour Market Policy Group, before moving to Statistics New Zealand where he eventually spent some years as Government Statistician.   There seem to be a range of views as to quite how successful that tenure was.  A while ago someone sent me a link to a somewhat sycophantic profile written while Geoff was in office.  Then again, I’ve heard that SNZ ran into some pretty serious financial problems on his watch.

When Geoff was appointed as Head of Operations and Deputy Governor, I was pretty positive on the appointment.  In part, that was the contrast to his predecessor, but much of it was about Geoff’s own merits. Graeme had set out to appoint someone who could contribute to policy, not just keep the operations ticking over, and in Geoff he had found such a person.   I hadn’t had a lot to do with him over the years, but what I’d seen left a fairly good impression, of someone who was smart, thoughtful, and level-headed.

It was an interesting move for Bascand himself.  He stepped down from a chief executive position in an operational agency to take up a number 3 position at the Reserve Bank  My take on day 1 (as recorded in my diary the day his appointment was announced) has remained my view throughout

“No doubt he sees it as a stepping stone back to either Governor or Secretary to the Treasury, via replacing Grant [Spencer] when he goes”

The expectation at the time was that Spencer probably wouldn’t stick around for five years, but as it happens next month Basacand will indeed take up Spencer’s position as Head of Financial Stability and deputy chief executive.

I recall Bascand telling an internal forum a few years ago that he’d only had two more years at SNZ to run, and hadn’t been interested in either joining the international consultancy circuit, or in the sort of operations-focused government chief executive roles that the State Services Commissioner had discussed with him.   Even though he’d had relatively limited experience in macro, and none in the financial sector, taking a fairly senior well-remunerated position at the Reserve Bank for a few years was a move back towards “home” –  his interests in economic policy.   And one that might position him well in time to secure the glittering prizes.

I don’t have many thoughts on how well he has done his day job –  head of operations  –  at the Bank over the past four years.  They aren’t areas I pay a great deal of intention to, and are largely inwards-focused anyway.  But the new bank notes seemed to be introduced smoothly, and many people seem to like them.  So he seems to have been a competent safe pair of hands, presiding over a continuation of the status quo (including, for example, the Bank’s obstructive approach to the Official Information Act, for which Bascand had responsibility).

What has been more noticeable has been the relatively high public profile Bascand has been given by the Governor on economics-related issues, especially in the last couple of years.     Bascand’s predecessor as head of operations gave almost no speeches, and certainly none on economic policy and analytical issues (and it is not as if the Bank has moved to do more speeches in total).

And it isn’t as if they have been bad speeches.    There are things I’d disagree with in all of them  –  and I’ve noted his over-enthusiastic embrace last year of the Bank’s new labour market capacity indicator –   but that isn’t a criticism.   If anything, I’ve found Bascand’s speeches the best of those put out by the four Reserve Bank senior managers, and certainly better, on economic issues, than those of the Chief Economist.  Bascand’s speeches come closer to comparing with those of senior managers in other central banks, including the Reserve Bank of Australia.

So in a way it isn’t surprising, or inappropriate, that the outgoing Governor has been smoothing the way, allowing Bascand to raise his public profile on economic policy issues, and –  in effect –  promoting him as the next Governor.

A few months ago the Bank’s Board advertised the position of Governor.   In their “candidate profile” they listed the sort of qualities they were looking for.  I wasn’t convinced that was the right list, but here is how I see Bascand against that list of characteristics.   My scale is 1 to 5, with 5 the best possible.

Outstanding intellectual ability 3.5
Leader in the national and international financial community 2
Substantial and proven leadership skills in a high-performing entity 3.5
Proven ability to manage governance relationships 4
Sound understanding of public policy decision-making regimes 5
Ability to make decisions in the context of complex and sensitive environments 3.5
Personal style will be consistent with the national importance and gravitas of the role 4

The Board had one more quality they were looking for

The successful candidate will also demonstrate an appreciation of the significance of the Bank’s independence and the behaviours required for ensuring long-term sustainability of that independence.

Personally, I suspect that is, in effect, ultra vires.  Decisions on the extent, or otherwise, of independence are matters for Parliament.    But I suspect Bascand would be a competent safe pair of hands on that count.

Overall, against this set of qualities, Bascand scores well on the “public sector” types of qualities, as he should.    We don’t know much about how he’d do as a single decisionmaker in a body with such high profile and extensive functions as the Bank (nor, in truth, do we know that for any of the possible candidates).  He is a capable analyst without, I suspect, claiming to be any sort of soaring intellect.  Where he probably scores lowest on this list of qualities is that he can’t make any serious claim to being a leader in the “national and international financial community”.   No one, I imagine, thinks of a distinctive Bascand perspective on any of the relevant issues.   Relatedly, he has no background with financial markets, banking, or financial system regulation –  at least beyond what he will have picked up sitting around the relevant committees, incidental to his day job,  in the last four years.

It is pretty clear that there is no ideal candidate to be the next Governor  (indeed, I heard at secondhand that the chair of the Board has said as much).  If so, Geoff Bascand strikes me as having the inside running if the powers that be are pretty content with things as they are, and aren’t looking for anything materially different over the next five years than they’ve had in the last five.    He is, after all, the only serious potential internal applicant, and the Board members have been able to see him every month for the last four years and take his measure.   Things probably wouldn’t run badly off the rails with Geoff in charge, and in some respects I expect he’d been a little better than Wheeler.

That is in the nature of a conditional prediction: if you think things have mostly been just fine at the Bank why go past Bascand?

But if he looks more or less suitable (given the slim alternative pickings) on the face of it, I still remain somewhat uneasy about appointing Geoff Bascand as Governor, in which position he alone would have personal legal responsibility not just for monetary policy, but for a wide range of regulatory interventions.   Some of that has been because he has been a key member of the Bank’s top-tier over the last four years, when monetary policy hasn’t been done well, and hasn’t been communicated well, and when the regulatory interventions have compounded, backed up by not particularly persuasive analysis.   I wonder if he’ll be able to demonstrate to the Board or the Minister that he was trying to influence the Governor towards better approaches?    Or even that he has learned something from those unsatisfactory experiences?

But my impression is that he is more a follower and capable implementer than a leader.   I was exchanging views a few weeks ago with another former colleague and we both noted that when Geoff first joined the Bank he’d seemed good and open, but quickly seemed to pick up the (internal) political signals and fall into line.  At a point when I was a lone internal voice on monetary policy I recall his somewhat strident objection that anyone could take a different view –  without ever making the effort to come and talk it over and understand a difference of perspective (in an area riddled with uncertainty).

Then, of course, there were episodes like the Toplis affair. Graeme Wheeler had got a bee in his bonnet about Stephen’s Toplis’s criticisms, and had all his fellow governors meet individually with Toplis to try to get him to back off.  Is that the sort of behaviour Bascand regards as acceptable from a top public servant?  And, if not, why did he simply go along –  after all, his day job didn’t involve contact with commercial bank chief economists?   Did he try to persuade the Governor to let it go?

Or the OCR leak episode.  I’m reluctant to make too much of it, because I was involved.  Then again, one collects data partly through experiences with people.   There is nothing in Geoff Bascand’s involvement in that episode, as revealed by the material the Bank had to release, that suggests someone with the sort of stature, and decency under pressure, that would mark him out from Wheeler.   Bascand was the senior manager responsible for external communications, lock-ups etc, as well as the one who commissioned the leak inquiry.

One could even think about Geoff’s speeches and interviews.  As I’ve already mentioned, I think they’ve been quite good.  But there isn’t any hint of a fresh or distinctive angle to them  (with the possible slight exception of comments around immigration in the Tarrant interview, which I would welcome).  Sure, the Governor is the sole decisionmaker, and it is his line that needs to be conveyed primarily.  But in a substantive speech a thoughtful senior adviser should be able to offer fresh insights or angles, without making trouble with the boss.  There is little sign Bascand has.

But my most sustained involvement with Geoff Bascand has been as fellow trustees of the Reserve Bank superannuation scheme over the past 4+ years.  Geoff serves as alternate for the Governor, and I’m an elected members’ representative.   Until late last year, Geoff was chair of the trustees (probably an illegal appointment, but that was an issue for those who appointed him –  the Board –  not for him personally).

Trustees of superannuation schemes –  regardless of who appointed/elected them – are required to act in the best interests of the beneficiaries of the trust, in this case, the members and pensioners.   A defined benefit superannuation scheme is a complex beast, involving huge elements of trust reposed in the trustees by members stretching over many decades (from memory, our median pensioner is now aged about 85).  The regulatory regime for superannuation schemes in New Zealand is quite limited –  something I have mixed feelings about, given my generally support for less regulation –  but there have long been statutory provisions, judicial precedents, and the obligations of the specific trust deed and rules themselves.  These days, superannuation schemes are the responsibility of the Financial Markets Authority –  a fellow regulator that Geoff Bascand will no doubt be dealing with extensively in his new role as Head of Financial Stability for the Reserve Bank (while at the same time a complaint against the trustees sits in FMA’s hands).

The Reserve Bank’s regulatory approach to banks is often characterised as being quite light-handed.  Certainly, there are few/no on-site inspections of the sort often seen in other countries.   But there are quite onerous requirements imposed on directors and managers, including various strict liability offences –  ones, that is, where people are liable whether or not they ever intended to commit an offence.  Strict liability provisions are generally repugnant, but there has been no sign of the Reserve Bank walking back its support for such provisions.  It is the standard they require of those who hold our money, or make our payments, in New Zealand registered banks.   Banks quake at the thought of breaching Reserve Bank regulatory requirements (we see it in the big buffers they run around the LVR limits).

Given this stern approach to the regulation of entities they have statutory responsibility for, you might suppose that they would consistently seek to adopt a “whiter than white” approach to the management of the long-term financial entity they themselves sponsor.  It isn’t an entity that is exactly invisible to the Bank either: successive Governors have been trustees, and when they choose not to attend one of their senior managers does so for them.  The Bank’s Board –  of which the Governor is a member –  appoints two of the trustees, and has to approve any rule changes.

Sadly, the standard the Bank –  and its senior managers –  have taken to the superannuation fund falls far short of the standard they require private financial institutions to adopt.   I won’t attempt to bore readers with details.  The worst abuses were done some decades ago.  Bascand’s involvement has been as these abuses have come to light, and how he has sought to guide the response and reaction.

Three years ago a particularly persistent retired member wrote to the trustees highlighting a series of potential problems around some rule changes in 1988 and 1991.  He suggested there was reason to doubt that one significant element of the the 1991 changes had been done lawfully at all, and that key elements of the 1988 changes (which gave the Bank power to, in effect, reduce pensions) had been done without the members’ consent that appeared to have been required by the rules, and under the relevant legislation.  Geoff’s immediate response –  as chair of a group of trustees, responsible for the fund, and working in the best interests of members –  was to write a memoradum to trustees proposing that we agree there was nothing of substance in the submission, and that we do no further investigation.

Fortunately, that did not gain agreement from fellow trustees.  I say “fortunately” because with only a little bit of follow-up work it emerged that in fact there had actually been a breach of the Superannuation Schemes Act (members had never actually been told at the time of the 1991 rule change).  Fortunately for today’s trustees, the statute of limitations had passed, but the trustees felt obliged to apologise to members for that earlier breach.

With a bit more follow-up work and some legal advice, it became clear that one element of the 1988 changes could simply never lawfully have been made (I think we are all agreed in shaking our heads in wonderment at how this happened), and another change that could lawfully have been made, nonetheless never had the member consent that clearly was required.  In fact, the Bank (and the Board) had known of some of these problems for more than 20 years and had never told members  (it was no small point –  the illegal change had meant that any surplus on wind-up could go the Bank).      That in turn has opened up issues around the validity of the consent members gave in the mid 1990s to a rule change that has been worth at least $5m to the Reserve Bank –  money it, in effect, extracted from the Fund, having apparently (and wilfully or perhaps otherwise) misled members about the alternatives.

The issue here isn’t the rights and wrongs on specific points.  It is about the cast of mind displayed by someone who will shortly be responsible for the regulation of most of our financial intermediation sector, and someone who asks to be given the huge powers Parliament places in the hands of the Governor of the Reserve Bank.    Geoff has been quite seriously engaged on the issues where the Bank’s financial interests might be threatened –  a process likely to end up in the High Court next year.  But he has never shown much sign of acting with the interests of the Fund’s members and pensioners at heart.    Despite him, rather than because of him (even though he was chair), some of the issues have continued to be pursued.    This isn’t the place to traverse the rights and wrongs of the specific issues; it is about my observation of a senior manager’s inclinations and cast of mind.   I’ve noted previously his seeming inability to recognise, and respect, the differences between his responsibilities as a Bank manager, and those as a superannuation scheme trustee –  the sort of lack of regard for boundaries that would rightly trouble the Reserve Bank if, say, it was apparent in a director of a New Zealand bank appointed by a foreign parent.

I don’t think Bascand has malevolent intent.  He is a pleasant and thoughtful person as an individual.  But he doesn’t seem to recognise his responsibilities, and rarely seems to want to dig deeper if he isn’t forced to.   Leadership is partly about asking hard questions, and insisting on rocks being turned over even if it might be inconvenient.  It is about recognising implications, and looking a bit further ahead than most.   Sadly, there doesn’t seem to have been sign of that sort of standard in the Bascand’s approch.  A few years ago a prominent person noted that the standard you walk past is the standard you accept.   The sorts of standards on display in recent years aren’t those we should be tolerating in a Reserve Bank Governor.

Then again, standards in public life in New Zealand appear to be slipping.  As I say, Bascand looks like the probable preferred status quo candidate for Governor.  But the status quo shouldn’t be nearly good enough.


Participating in the labour market

Looking through the various comments posted here yesterday, I noticed there had been a bit of an exchange about this chart.

BNZ labpart

It had, apparently, been used in a presentation by BNZ economist Stephen Toplis, and was reproduced at Kiwiblog.    A commenter here pointed me and others to it, with the observation

just shows what a world class economy we are running, world record immigration and look at the participation rate..amazing. That is an economy running probably as one of the best…productivity measure is meaningless

I’d have been inclined to ignore it, but others didn’t.   So I thought I’d offer a few thoughts on what to make of the labour force participation rate data.   As a reminder, the participation rate is the sum of all the people in paid work (at least an hour a week) and those actively looking (a reasonably demanding definition) for work, as a share of the working age population.   The definitions are pretty similar across countries.

To get one thing out of the way quickly, I’ve been consistently running the line that immigration boosts demand (including demand for labour) more than it does supply, at least in the first few years.  And since the participation rate itself varies procyclically it isn’t remotely surprising that extraordinarily rapid, and unexpected, population growth has gone hand in hand with a pick-up in the labour force participation rate.   There are more jobs around, and so more people actively participate in the labour market.

But a more important point, and a trickier one, is that there is no good way of determining what a “good” participation rate is.  Unemployment rates are different: in general, the lower the better, because it is a measure of those whose wishes are frustrated (people actively looking for work and not  –  yet –  able to find it).

And enthusiasts for citing high labour force participation rates often risk sounding a bit like Soviet-era Stakhanovites, for whom the greater glory of the state is advanced by unrelenting labour.   But labour is a cost.  People do it for a whole variety of reasons –  sense of fulfilment, something to do, the company –  but for most people the main reason they engage in paid work is to earn the money to live, and to purchase the things they and their families wish to consume.   Higher earnings rates mean people can work less (and do other stuff), or work as much (or even more ) and consume more on-market goods and services.    Over history, it looks as though the income effect has dominated.  Thus:

  • labour force participation rates for 14 year olds were once very high (not many went to secondary school).  They are now pretty low, and most people probably count that as “a good thing”.
  • as recently as thirty years ago, the participation rate for 15 to 19 year old was around 65 per cent, and now it is around 45 per cent, as more young people are staying at school longer, and then doing tertiary study.
  • go back a couple of hundred years and most people worked until they physically couldn’t work any longer.   These days, we have widespread “retirement”.

All of these changes –  reduced labour force participation – have been made possible by advances in productivity and incomes.   The same goes for shorter worker hours for those in work.   All else equal –  which is never is –  then one might expect countries with lower productivity (and thus lower real wages) to have higher hours of work per capita and higher participation rates.

Social customs also change in ways that increase labour force participation.  For a long time it was customary for one parent (most often the mother) to stay out of the paid labour force for some years when children were young (or even at school age).   These days it is a more uncommon choice.    There is no easy way to assess whether that is “a good thing” or not.  Individuals and families make choices, in the light of their own opportunities and constraints –  in some families only one parent is in the paid workforce because they can afford that, and prioritise certain things for their children; in other families, they might wish to operate that way but nevertheless be more engaged in the paid workforce than they’d prefer just because of extreme housing unaffordabilty.

There is a tendency is laud the rising labour force participation among the over 65s.  To some extent, I share that enthusiasm, because I favour an increase in the eligibility age for NZS (and because, to some extent, the increasing labour force participation rate is probably a reflection of improving health over time at, say, age 65).   But choices about state pension ages are somewhat arbitrary, and someone who favoured keeping the NZS age at 65 could quite readily suggest that the rising participation rate was a reflection of financial stresses (including, eg, declining rates of home ownership).

Where we might be on safer ground is in looking at things that deter people from participating in the labour force when they might otherwise be quite happy to.   Thus, I like our NZS scheme partly because it does not penalise people from staying in the workforce after 65 if they want to.   Neither, typically, do private pension or savings arrangements, but many other state schemes do.    But even when we look at things like these provisions, almost every one is value-laden.   Do we, for example, have any basis for evaluating whether in a two-parent family, one parent doing paid work fulltime and the other being at home is better than both parents working 20 hours a week?  In the latter case, the participation rate will be higher, but total hours worked might be much the same.

So when people do these comparisons across advanced countries, they often focus on the subgroup of prime-age (25 to 54) males.  Not because prime age males are any more important than anyone else, but because there has been a strong cultural expectation that these people would be in the labour force, and there haven’t been big social changes (such as those affecting the young, the old, and woman) that have very systematically affected those expectations in recent decades.    Here is how the participation rate for that group has changed since 1986 (when our HLFS began) for the OECD countries that have data for the entire period.

prime age males.png

New Zealand’s prime age male participation rate is still a little above that of the median OECD country, but over the past 30 years the fall has been just a little more than that for the median country.    The gap comes and goes, and in the last few years the participation rate for New Zealand prime age males has been rising relative to that in other OECD countries.

prime age males time

I’m still not sure one can make very much of cross-country comparisons of participation rates.   There are both demographic and cultural features  one needs to take account of.  Perhaps one is better to be looking at the various government interventions that affect the choices people make about participating, and evaluate the costs and benefits of their own merits  (individually and collectively).  Thus, as examples,

  • a high minimum wage relative to median wage is likely to price some people out of jobs, and discourage some from searching, lowering employment and participation rates (although this is likely to be a less important issue for prime age people than for young people starting out),
  • really expensive tertiary education might at some point discourage people from studying and see them go straight into the labour force,
  • generous working-age welfare systems will discourage some from working, and from actively seeking, work,
  • tight restrictions on lay-offs may make it harder for new people to be hired, discouraging some from searching,
  • a universal NZS system may, at the margin, discourage some prime age participation (since basic retirement income doesn’t depend on participation),
  • income-splitting for tax purposes (once proposed by Peter Dunne) might not much affect total hours worked, but might lead to more specialisation within households and lower measured labour force participation.

Some of these policies/proposals seem good and sensible to me, while others seem quite damaging.  But they are probably best assessed on their own merits, and overall comparisons of participation rates probably aren’t very enlightening unless your country is quite an outlier.   The only time our prime-age male participation rate has been more than one standard deviation from the OECD median was right back at the start of the series in the mid 1980s (at a time when, by conventional reckoning, our labour market was over-regulated, and our economy still rather inefficient).

To match the initial chart, here are the unemployment rates for the three countries over the full thirty years.

U rate since 1986

Over the full thirty years, the average unemployment rates for the three countries aren’t very much different, although Australia’s has averaged a bit higher than ours, suggesting their labour market institutions are less good at facilitating people’s desire to work than either ours or those of the US have been.

I don’t have a strong conclusion to draw, except to make the point that overall participation rates (in particular) really don’t tell one much, either across time or across countries.  Those in New Zealand have been picking up in the last few years, and that is probably (broadly speaking) a good thing –  a cyclical reflection of an improving state of the labour market.  That is a useful counter to those who want to argue that immigration systematically takes away jobs from natives.   But if one is wanting to make an overall assessment of how the economy is doing, productivity growth is typically a much more important and meaningful indicator.  And for five years now, we’ve had none.  For five decades now we’ve had less than almost any other advanced economy.


Debating housing

The centrepieces of the two weekend TV current affairs shows were political debates: The Nation had Phil Twyford and Amy Adams on housing, and Q&A had Grant Robertson and Steven Joyce on the economy more generally (but with a large chunk on housing).   I only saw the Q&A debate, but I have glanced through the transcript of Twyford/Adams.

In the course of his debate, Phil Twyford was asked how much house prices should be relative to income.    His response was excellent

Twyford: Ideally, they should be three times. If we had a housing market that was working properly, your housing would be— the median price would be about three to four times the median household income.

Grant Robertson repeated those sorts of numbers in his exchange with Steven Joyce.  It was good, clear, encouraging stuff.    A reminder of just how totally out of whack things are in the New Zealand house and urban land market.   And a suggestion that the main opposition party wants things to be materially different and better.

But I can’t help wondering in which decade they expect things to be more or less okay again.   In time for, say, my children –  perhaps 10 to 15 years from now –  or will it only be the grandchildren?

Don’t get me wrong.   Watching the Robertson/Joyce debate, as someone who has no idea who he will vote for, I thought Robertson had much the better of the housing side of the debate.   The current government seems reduced to some mix of lamenting that it is “a global problem”, reluctantly conceding that Auckland prices are a bit too high, and claiming that just over the horizon there is a wave of supply that will substantially address the problems.   So if I’m critical of Labour here, take for granted that almost all the criticisms apply with more force to National.

Here is Phil Twyford avoiding suggesting that Labour wants house prices to come down

So is it Labour’s goal to get it down to that – about four times?
Twyford: We want to stabilise the housing market and stop these ridiculous, year on year, capital gains that have made housing unaffordable for a whole generation of young Kiwis.
But in essence, you’re going to drop the value of houses, if you want them to be four times the price of the average income.
Twyford: Well, we’re going to build through KiwiBuild. We’re going to 100,000 affordable homes.
I want to come to KiwiBuild in a moment. I just want to talk to you about the price.
Twyford: That will make housing affordable for young Kiwi families. That’s our policy.

Stabilising the housing market, and ending rapid house price appreciation, isn’t a recipe for fixing up the housing market for the current generation of young people.

Grant Robertson was much the same –  reiterating the goal of house prices of 3 to 4 times income, but he couldn’t or wouldn’t say how long it would take.  There was plenty of talk about building “affordable houses” (around $600000?) and “cracking down on speculators” and beyond that it all seemed to be down to growing incomes.   But there wasn’t even a mention of freeing up land supply –  a topic where formal Labour policy looks better than anything else on offer from major parties.  Even though, the largest single component in the increase in New Zealand (especially Auckland) house prices has been the land component.

On the other side of the exchange Steven Joyce was taunting Robertson with the suggestion that “Labour wants to crash house prices with a punitive capital gains tax” –  as if, whatever the (de)merits of a CGT, much lower house prices would be the worst thing in the world.

Lifting growth in productivity and real incomes is highly desirable.   All else equal, flat nominal house prices and faster income growth is a recipe for improved housing affordability.  But how long might it take on reasonable assumptions?

I’ve shown similar charts on this point previously.  Here I assume a starting point of a price to income ratio of 10 (around current Auckland levels) and that (a) nominal house prices hold at current levels for the indefinite future, and (b) incomes grow at a rate equal to 2 per cent (midpoint inflation target) plus the rate of economywide productivity growth.  I’m just going to assume that the 2 per cent average inflation could be achieved quite easily if the government wanted to. Productivity is the harder issue.  Here I’m showing four lines using:

  • actual productivity growth (GDP per hour worked) over the last decade (just under 0.6 per cent per annum),
  • actual productivity growth over the last thirty years (for which we have quarterly real GDP and hours data), of just under 1.2 per cent per annum,
  • productivity growth of 1.5 per cent per annum, and
  • productivity growth of 2 per cent per annum.

The straight line on the chart is at a price to income ratio of 3.5 (ie the midpoint of the 3 to 4 times income Labour is talking of).

house price to income ratio with flat nominal house prices

On the best of these scenarios, price to income ratios get to 3.5 in about 27 years time.   If we manage productivity growth equal to that for the last 30 years –  which itself would be quite an achievement at present – we’d be waiting almost 35 years.

Affordable housing, and a functional housing market, for the current generation simply requires a fall in nominal house prices.   And yet no major party politicians seems to have the courage, or the self-belief (in their ability to communicate and take people with them), to make that simple point.

For most existing home-owners, the market value of their house does not matter a great deal.  A large proportion of home-owners have a modest mortgage or none at all, so negative equity isn’t a risk.  And since most people retire in the same city they’ve spent their working lives in, their house price doesn’t even affect very materially their own expected future purchasing power.

Fear of falling house prices seems to reduce to two particular dimensions:

  • people who, having bought in perhaps the last five years, would find themselves with negative equity if house prices fell markedly (in turn divisible between new owner-occupiers and purchasers of additional rental properties), and
  • some generalised fear that a fall in house prices goes hand in hand with economic disaster, serious recessions and the sort of experience the US or Ireland had.

The latter is mostly a category error.  In both the US and Ireland, there was material overbuilding (excess stocks of actual houses).  There is no prospect of that situation in New Zealand on any of the policies of the major parties.  In Ireland, the situation had been compounded by joining the euro, which gave Ireland interest rates set in Frankfurt that bore no relationship to the needs of the Irish economy.  In the US, there had been persistent official efforts –  from Congress, the Fed, and successive Administrations –  to encourage, or compel, the financial system to take on housing lending risk that the private sector would be unlikely to have assumed willingly.   None of that resembles New Zealand.  Not only do we set our own interest rates, but to the extent there is state involvement in the housing finance market it is reducing the supply of credit.

A severe recession could, at least for a time, lower New Zealand house prices.  Recessions –  severe or otherwise –  aren’t things to welcome.  But the sort of land market liberalisation (with associated infrastructure rules) that might, as a matter of policy, set out to materially lower New Zealand house and land prices would be most unlikely to materially dampen demand or economic activity.  If anything, it could represent a material boost to demand, as building became more affordable.   (And if some people would find themselves with negative equity, whole swathes of younger generations would suddenly face new opportunities and less of a desperate need to save.)

What about the people facing negative equity?  I don’t have any particular sympathy with those who’ve purchased investment properties in recent years and might face being wiped out.   They’d have taken a business and investment risk –  in this case on the regulatory distortions never being fixed –  and lost.  That happens in all sorts of market –  think of the people with exposures to shares after 1987, or in finance companies 10 years ago.  Or those with businesses based in import licenses in earlier decades.  It is tough for them individually, and almost all of them have votes.  But it was a business risk, and a conscious voluntary choice.

I’m much more sympathetic to those who bought a first house and could face a large chunk of negative equity.    I touched on this in a post a few weeks ago

No one will much care about rental property owners who might lose in this transition –  they bought a business, took a risk, and it didn’t pay off.  That is what happens when regulated industries are reformed and freed up.    It isn’t credible –  and arguably isn’t fair –  that existing owner-occupiers (especially those who just happened to buy in the last five years) should bear all the losses.   Compensation isn’t ideal but even the libertarians at the New Zealand Initiative recognise that sometimes it can be the path to enabling vital reforms to occur.  So promise a scheme in which, say, owner-occupiers selling within 10 years of purchase at less than, say, 75 per cent of what they paid for a house, could claim half of any additional losses back from the government (up to a maximum of say $100000).  It would be expensive but (a) the costs would spread over multiple years, and (b) who wants to pretend that the current disastrous housing market isn’t costly in all sorts of fiscal (accommodation supplements) and non-fiscal ways.

Those numbers were made up on the the fly, but even on later reflection they look like a reasonable basis for something that might not be unreasonable, and also might not be unbearably expensive.  It would recognise that people need to bear some material risk themselves (a 25 per cent fall in nominal house prices is not small).  But it is also designed in recognition of the fact that since 2013, it has been hard for first home buyers to get a mortgage above an initial LVR of 80 per cent, so that not many would be in negative equity now even if house prices fell by 25 per cent from here.

Since many people will stay in their existing house for a long time if they have to, and the scheme only compensates if the house is sold, that also limits the potential fiscal cost.  In fact, the biggest pool of owner-occupiers who would sell at a material loss would be those forced in the event of new severe recession (unemployment is typically the biggest threat to the ability to service mortgage debt) and (a) those people would naturally command a degree of public sympathy and (b) land liberalisation would be a stimulatory policy, reducing the chances of a near-term future recession.  There would be some voluntary sellers, to capture the compensation, but the cost of selling and buying a house, and of moving house, is not trivial.   If 100000 households were to claim the maximum compensation of $100000 that would be total additional government expenditure of around $1 billion, spread over a considerable period of time.   And to claim $100000, you’d have to have bought say a $1 million first house and seen house prices fall 45 per cent from your entry price.

It isn’t a perfect scheme by any means, and lots of details would need to be fleshed out.   One could relatively easily restrict it to apply only to those in a first owner-occupied house, again the people who will naturally command the most sympathy anyway.    But if something of this sort could be done for, say $1 billion, and it helped the pave the way for a genuine structural fix in the housing market –  a willingness to actively embrace lower house prices –  it would seem likely to offer more value than, say, the least valuable of the proposed 10 new “roads of national significance”, which are estimated to cost on  average just over $1 billion each.  How much congestion is there on the existing road from Levin to Sanson?

And three final points on housing:

  • it was depressing to read the housing section of Jacinda Ardern’s campaign opening speech.  It wasn’t the focus of her speech, but –  just like Andrew Little at his conference speech earlier in the year –  there was reference to dealing to “speculators”, barring foreign purchasers, and to the state building more houses, but not a word –  not even hint –  about freeing up the land market in a way that might make those price to income aspirations achievable,
  • it was slightly strange listening to Robertson and Joyce debating the possibilities of a capital gains tax, focused on housing.  Weirdly Robertson didn’t take the opportunity to rule out applying a CGT to unrealised gains –  even though he surely really realises that, whatever the theoretical appeal, there is no way anyone is going apply a CGT to anything other than realisations.  But it was even more strange to hear this debate going on after both sides were insisting they “had a plan” to fix housing.  If they really did then surely there would be few/no systematic capital gains in the housing market for decades to come?
  • and finally, Steven Joyce ran his line that house prices are a global problem.  This seemed to be a variant of the sort of “problems of success” line John Key often ran.  Out of curiosity, I dug out the OECD’s real house prices series this morning.   They don’t have data for quite every country, but here is the change in real house prices from 2007 to 2016 (annual data) for the countries they have the data for.    There are a few countries that have done worse, but not many.  In the median OECD country, real house prices have fallen over the last decade.

house prices last decade

Mostly, the countries that have been about as bad as us have also had quite rapid population growth (Israel, Australia and Luxembourg in the lead on that count) –  not, of course, that either Finance spokesperson suggested doing anything about that.

What about a longer-term comparison.  There are lots of gaps in the OECD data for earlier decades, but here are real house prices increases for the countries they have data for over the three decades to 2016.

house prices since 86

Worst of them all, without even the income growth to match.

We need to face up to the importance of lowering house prices, of adopting policies likely to sustainably make that happen, and – if necessary –  consider compensation packages for some to help make that transition possible.

Virtue signalling, with your money

I haven’t written about the New Zealand Superannuation Fund (NZSF) for a while, and a well-informed reader has been encouraging me to get back to the economics of the Fund (and some of the important issues raised in a recent review paper).  I will, but for now I remain of the view that the Fund is serving no useful purpose and should be wound up.

But while we have it, it needs to be run well.

One of the annoying aspects of the Fund is the way in which the Board and management get to take your tax money and mine, and invest (or not) in causes which they happen to find appealing.    Of course, the Act isn’t written that way, but that is what it boils down to.   I’m not too keen on my money being invested in abortion providers or private prison operators –  just to span the ideological spectrum –  but obviously Adrian Orr and his Board don’t have a problem with such exposures.   They, on the other hand, object to tobacco companies and whaling, which don’t greatly bother me.

But the other day, they announced a big new policy shift that has substantially reduced the carbon exposure of the Fund (somewhat puzzlingly, I saw no mention in any of their documents of methane exposures, and as we know in New Zealand at least methane exposures make up a very large chunk of greenhouse gases).

To their credit, NZSF pro-actively released several background and Board papers relevant to this move, as well as several pages of question and answer material (all at the link in the previous paragraph).

This shift is dressed up as a simple matter of economic and financial management.  Indeed, they are at pains to assert that ethical (or presumably political) considerations played no part in the shift.  But, on the material they have presented it just doesn’t ring very true.

For example, they released a presentation to the Board from a few months ago.  In it, the chief investment officer and the “head of responsible investment” told the Board that

We believe climate change is a material long-term risk for which the Fund will not be rewarded.

What they appear to mean is the market prices of shares with (adverse) exposure to climate change and any associated policy responses do not adequately reflect those risks.

It is an arguable proposition, for which you might expect that evidence would be marshalled.  But the Board appears to have been presented with no evidence whatever, just assertions, and questionable economic reasoning.  Thus, on the next page

Climate change is a market and policy failure: markets are producing too many emissions and are over-invested in fossil fuels. We believe carbon risk is under-priced partly because the time horizon over which the effects will manifest is too long for most market analysts – but it is relevant to the time horizon that matters for the Fund.

This is a hodge-podge paragraph. For a start, climate change itself isn’t a market failure, but may well arise from market failures (costs aren’t properly internalised etc).   But the fact of climate change –  whatever role past policy or market failures may have played – tells one nothing about whether shares in companies exposed to carbon are now fairly priced or not.  They are just two completely different things.

And there is still no evidence presented for the proposition (“belief”) that markets have overpriced these companies (such that expected future risk-adjusted returns on them won’t match those available elsewhere).  Other market participants know as much (or as little) as NZSF staff know.

There was a more detailed Board paper in April containing the final recommendations.   It has more text, but no more analysis of the risks or of why the Board (or we) should believe that NZSF is better placed than the market to appropriately value climate change related risk.    Instead, we get a repeat of the same assertions,

NZSF quote

followed by a sentence which is best summarised as “but we really don’t know”.

There are repeated references to lines such as “ignoring Climate Change presents an undue risk”, but that isn’t even remotely the issue.  The issue is whether (a) the market on average is mispricing that risk, and (b) whether NZSF staff, management, and Board are better placed to evaluate the complex mix of scientific, economic, technological, and political factors that determine how things will play out (and thus what fair value pricing will prove to have been).     Thus, it is quite likely that the market on average has the appropriate pricing of these risks wrong, because much of what is relevant is inherently unknowable.  But if it is likely that the market is wrong, there is no particular reason to be confident which side the error lies on.   And it isn’t obvious why it is easier for NZSF to be confident it is right about this, than about any of the other very long-term risks embedded in many sectors, or in the market as a whole.

There are also hints that really this has little to do with a careful evaluation of financial investment risk and a lot more about politics and “good causes” –  virtue signalling.

NZSF 2

Consistent with this political focus, the very first item in the proposed communications strategy reads

“Recommend engaging with the Greens to explain to them the approach we have taken”

(And, sure enough, they were lauded by the Greens – although not for the quality of their financial analysis –  when the new policy was finally announced the other day.)

NZSF’s detailed public story is contained in the Q&A document they released.  This is text that they will have had months to refine, the Board having made this decision in April.

But again, there is no analysis presented or summarised to indicate why the Board is confident the market has it wrong. Instead they seem reduced to lines like this

We believe that now is the right time to act. Even if there remains some uncertainty about global policy, its general direction is consistent with meaningful carbon reductions.

This is the basis for a major strategic investment choice by the Board managing taxpayers’ money??   “General directions” are one thing, assessing market pricing and demonstrating with a high degree of confidence that market prices are wrong is quite another.

Or lines like this

The Mercer climate change study that we participated in during 2015 found that the biggest risk to investors from climate change was to be on the wrong side of strengthening global policy and/or technological disruption. Mercer found that investors who got ahead of the curve could mitigate the potential downside.

Well, of course.  If you read markets well, and judge policy correctly, there is plenty of money to be made.  But doing so is hard…..very hard, and NZSF provides no evidence that they are able to beat the market uniquely well is this particular area of their global exposures.

There is further evidence that this move is about politics and virtue signalling, rather than robust financial analysis.

Will your active managers be allowed to hold stocks that have been sold from the passive portfolio on the Fund’s behalf?
Our active NZ equity managers (who may also from time to time invest in Australia) will not invest in these stocks.

If this were just a strategic view that markets were systematically mispricing this risk, there would be no reason to bar active managers from holding such stocks from time to time (after all, even if one average the market is mispricing this risks, it doesn’t mean there won’t occasionally be opportunities in individual stocks that are exposed to such risks.)

There is very strong sense that NZSF decided to reduce its climate change exposures, and then back-filled the (rather weak) argumentation in support of that.  As it is put early on in the April Board paper, setting the scene for the recommendation.

“a reduction of climate-change related risks for the Fund is a key goal of the CCIS [Climate Change Investment Strategy]”

Perhaps there is some other economic and financial analysis, that they haven’t yet released, to support that strategic preference (I’ve lodged an OIA request to that end) but at the moment it looks like a political choice not a financial one.

The NZSF has implemented this strategic choice by the Board and management by altering their so-called Reference Portfolio benchmark.   They have long argued that the reference portfolio is what their performance should be benchmarked against  (the numbers scream out at one, in large type, when one goes onto their website).  I’ve long argued that is the wrong benchmark for citizens and taxpayers to focus on (useful as it might be for the Board to judge staff active management choices against).  In this case, the Board itself has taken what amounts to a punt (an active call) that the market is underpricing risk in a particular sector.  They need to be evaluated on the results of that call over time, not avoid accountability by burying the implications of their policy decision in what looks like a passive benchmark that is beyond their control.

Perhaps the NZSF choice will be widely popular.  But that isn’t their job.  In fact, it has always been one of the dangers of the Fund.    It isn’t their job to be playing politics by tilting the portfolio towards trendy causes.  If anything, long-term investors (the advantage they constantly assert) might be better positioned to take somewhat contrarian stances, leaning against the tide of opinion at times (but only when backed up with sound analysis).    And if they really believed that the market was underpricing climate change risk, why not be rather more open about the resulting investment choices  –  leave the reference portfolio unchanged, and implement the market call through active management positions?

And you do have to wonder how, in a country where policy is still aimed at opening up further oil and gas deposits, a New Zealand government agency now has an official ban on buying shares in companies that might be developing those resources.  Will an NZSF ban on dairy exposures be next?

We have elections to choose the people who will make policy decisions.  If the public want to ban dairying, or oil and gas exploration, then elect the politicians to make those calls, and hold them to account.   But lets not have bureaucrats and unaccountable Board members pursuing personal agendas (even popular ones) with our money.  If the economic and financial case is really there –  and remember that active management calls of this sort don’t have a great track record globally –  then lay it out for us to see.  On what they’ve released to date, this look much more like a virtue-signalling call than one consistent with the NZSF’s statutory mandate, or with the sort of professional expertise we should hope for from well-remunerated investment managers.