The Herald yesterday gave over a full page to an unpaid advertorial from a public servant. Of course, it wasn’t quite described that way, but that is what New Zealand Superannuation Fund chief executive Adrian Orr’s lengthy opinion piece amounted to. Perhaps we should just be grateful to the Herald that they didn’t charge the NZSF – and thus the taxpayer – for the advertising space.
It is a strange piece in many ways. It is unfortunately becoming more common to have public servants take to the media to defend political decisions. Public servants are there is advise and administer, but politicians are the ones who make the policy decisions and should be called to account for them. And that is quite clear in the NZSF case. Parliament set up the NZSF and associated provisions. Included in those provisions is the ability for the government of the day to (openly and transparently) contribute less to the Fund in any year (and thus possibly for a succession of years) than the formula would otherwise imply. Given all that, NZSF’s responsibility is simply to invest the money placed with them, and comply with any ministerial directions they are given. The chief executive works for the Board (the grandiosely-named Guardians) and really has an operational role only. Neither policy – whether to have a Fund, how much should be contributed to it, whether the country is better off or not for having NZSF – nor the actions of The Treasury, are his affair. Treasury itself has a chief executive, and is responsible to the Minister of Finance. Policy matters are for the Minister.
And yet yesterday we find a lengthy piece from Adrian Orr billed as “an explanation of The Treasury’s role and how the Fund operates”, although in fact as much space is devoted to championing the case for the Fund. If there is a case to make on either of these points, surely it is one that should be being made by Gabs Makhlouf or, better still, Steven Joyce?
The article is set up to look like a response to what Orr regards as misleading or erroneous points (“common myths”) from recent media coverage (can we then assume that various other points critics have made are quietly accepted as valid?). His list is as follows:
• the fund is soon to be “sold down” and would not be effective at smoothing future tax payments;
• capital contributions were intended to only come from Government operating surpluses, with their size and frequency variable and discretionary;
• NZ would be better off paying down Government debt;
• NZ would be better off managing the NZ Super Fund as a passive fund; and
• the fund has missed the investment good times (post-GFC), future returns won’t be as good and hence the fund’s chance of success is compromised.
I’m not sure who has been running either the first or fifth points. I haven’t seen the first argument made at all, although I’m one of those who thinks the Fund should be soon closed down and the assets liquidated. Sadly, there is no sign of it happening. And as for the fifth argument, the criticism I’ve seen – and made to some extent – is that the NZSF total returns have been flattered by strong global equity markets in the last decade or so, and that even so the returns don’t look particularly attractive to the taxpayer once the high-risk nature of the Fund is taken into account. As it happens, the Fund’s own documents confirm that they also expect much lower returns in future.
It is our expectation, given our long-term mandate and risk appetite, that we will return at least the Treasury Bill return + 2.7% p.a. over any 20-year moving average period.
I noted last week that if one thinks of a neutral Treasury bill rate of even as high as 4 per cent (which is very long way from where we are now) that is consistent with expected future returns of only around 7 per cent.
Reassuringly, in his advertorial Orr outlines very similar expectations
As demonstrated in Treasury’s modelling, we estimate the fund will return 7 per cent to 8 per cent p.a. over the long term
If that is the best he and his team can reasonably expect to do (and it probably is), then it is for us – voters and taxpayers – not for him to decide if that is a worthwhile business line for the New Zealand government.
Against the Treasury’s own recommended discount rates, it would fail that test. At present, their default rate is 6 per cent real. Add 2 per cent inflation (the midpoint of the target range) to that and you get a required rate of return of 8 per cent. If Orr doesn’t think he and his team – using their best professional expertise – can exceed that, that is useful information for us in assessing whether a high-risk investment management subsidiary is something the New Zealand taxpayer should be owning.
What about his other “myths”? Orr objects to a view that
capital contributions were intended to only come from Government operating surpluses, with their size and frequency variable and discretionary;
Sure, the legislation sets out a formula, but it also quite explicitly provides for deviations from that formula, and sets no cap on how long those deviations can last for. And the NZSF legislation was passed at a time when the government accounts were in surplus, and were expected to remain in surplus pretty much indefinitely. But why does he suppose that Parliament provided for contributions to deviate from the formula? Quite probably because they recognised that bad stuff could happen – be it severe recessions, banking crises, natural disasters or whatever, pushing the government accounts into deficits. Since the macroeconomic point of the NZSF is to be a vehicle to hold and invest increased overall government savings, reasonable people might think it wouldn’t make much sense to undertake government borrowing just so that the government could increases its high risk exposure to international equity markets. Those who devised the legislation probably didn’t think of the budget drifting back into deficits for years at a time, but it did – and the legislation was resilient to that change of circumstances.
Of course, Orr and other advocates of the Fund constantly argue that the purpose of the Fund is to, in some sense, reduce the future cost/burden of New Zealand Superannuation. It does no such thing. The cost of NZS is, and will be, what policymakers at the time determine it to be – they can, and often have in the past, changed those parameters. NZS isn’t a funded defined benefit pension scheme and it isn’t a contractural claim either. It is simply a choice, made by Parliaments of the day, as to how much, and on what terms, the government will pay to older people at a particular time.
And thus, although the legislation talks of the purpose being
to establish a New Zealand Superannuation Fund with sufficient resources to meet the present and future cost of New Zealand superannuation
it does nothing of the sort. NZS spending is met out general budgetary resources. There is certainly a default formula for calculating how much would go into the NZSF and how much be withdrawn from it, and those numbers are tied to some estimates of future NZS expenditure. But tying bows around money, and putting some of it into an entity labelled “New Zealand Superannuation Fund”, then transferring some of back in future decades to the general account, doesn’t alter that affordability one iota. Of course it designed to look that way – NZSF was always substantially a piece of political theatre – but it doesn’t.
Two things (in this area) can improve overall government finances. First, higher taxes (than otherwise). That is what happened during the years in which the Crown was contributing to NZSF (when large surpluses were being run). But those higher taxes could just as easily have been devoted to repaying government debt. And second, prudent management of the resources the Crown coercively (“taxes”) takes under its control. And that latter is really the case for NZSF. If the Crown can take your money, put in a high-risk investment management subsidiary, and make more money than you could then, possibly, taxpayers as a whole are made better off. But even there the test isn’t whether they do a bit better than a government bond interest rate. After all,
- the money has been taken coercively in the first place, and there are large (perhaps 20 per cent) deadweight costs of taxation,
- the government’s investments will typically be risky (high variance),
- over time, the quality of governance of public entities tends to corrode, and
- in the private sector the evidence of revealed behaviour is that people don’t take discretionary high risk investments on without a considerable margin above the cost of debt being in prospect (thus private sector hurdle rates of return typically seem to exceed 10 per cent). Risk has a (high) price.
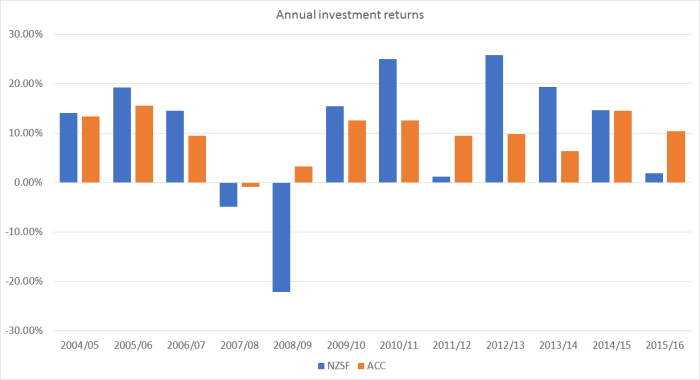
But in his determination to defend his empire, Orr simply ignores most of this. And as we know, over the period both funds have been operating the other big pool of government financial assets – those of the ACC – has been managed to achieve better risk-adjusted returns than NZSF has managed.
He also continues to ignore the international evidence that casts severe doubt on the ability of fund managers to add value by active management. This isn’t my main concern about the NZSF – although their “active management” returns are overstated, by the way they construct their so-called benchmark – but simply continuing to recite actual results from a short period (recall that, although Orr never mentions it, their own documents talk about a 20 year horizon being necessary to evaluate performance) proves nothing.
I was also rather astonished at Orr’s apparent attempt to claim the tax the Fund has paid as a net gain to New Zealand. Perhaps it looks that way to someone paid to manage a particular dollop of Crown money. But Orr is smart enough to have heard of opportunity costs. Had NZSF never been set up, the money would have been used for other things. Some of it might have been used, through lower business tax rates, to build new private sector businesses (the economy itself would be bigger as a result). Some of it might just have ended in private savings vehicles. And some of it probably would have been consumed. All of those alternatives would, in turn, have given rise to additional tax revenue. It probably wouldn’t have been as much as NZSF has paid – larger fiscal surpluses and higher taxes probably did slightly raise national savings rate – but it would verge on dishonesty if a public servant were to claim that tax as a net gain to New Zealanders.
Orr wraps up his piece with the claim that
The Super Fund is an independent, non-political, for-profit entity with a specific purpose: to partially pre-fund the cost of retirement benefits for future generations of Kiwis.
Actually, it was a piece of political theatre, set up to help the buttress the political case for doing nothing about the parameters of NZS, in the face of large increases in life expectancy. Running surpluses is one thing (and a quite different thing), but NZSF is simply a high risk investment management subsidiary of the New Zealand government, dressed up in gaudy rhetoric about future pensions. There probably should be many more political questions asked than there are being posed at present. Questions for policymakers – not ones that Orr, as an operational public servant, apparently keen to grown his empire, has much to offer on – should include those around how attractive it is for the Crown to own a high risk fund that will generate particularly large losses – and perhaps pressure to liquidate the fund at the trough of world markets – at just the sorts of times when government finances will typically be under most stress from other sources.
(Someone drew my attention the other day to the average remuneration of NZSF staff. The 2016 Annual Report tells us they paid $29.632 million to 112.2 FTE staff, which works out to an average of $264000 per employee – over everyone from Adrian to the support staff. Yes, funds management tends to be a high-paying industry, but I found it a surprisingly large number for a New Zealand government agency, that – looking forward, and on the chief executive’s own numbers – doesn’t expect to exceed a realistic weighted average cost of capital.)
My bottom-line assessment remains that I ran in my earlier post
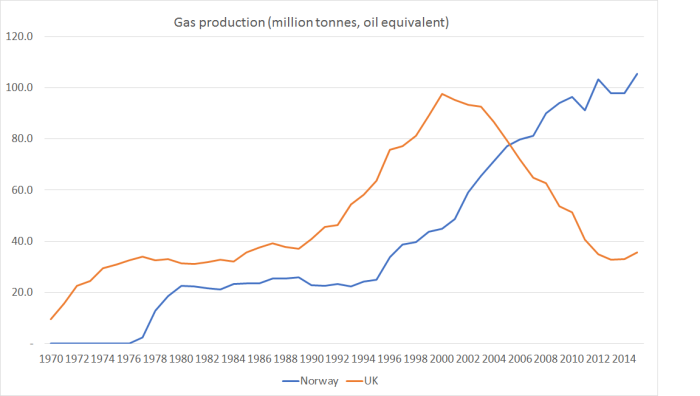
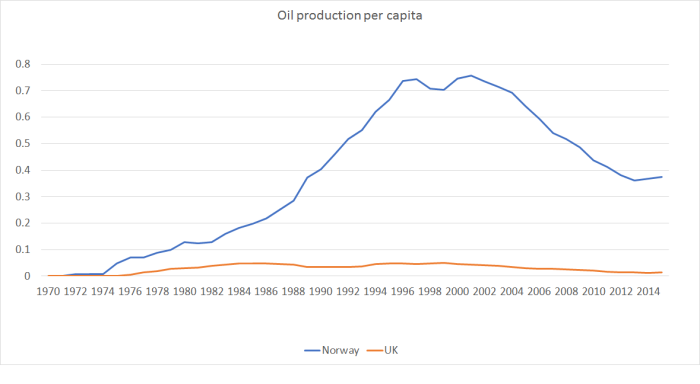
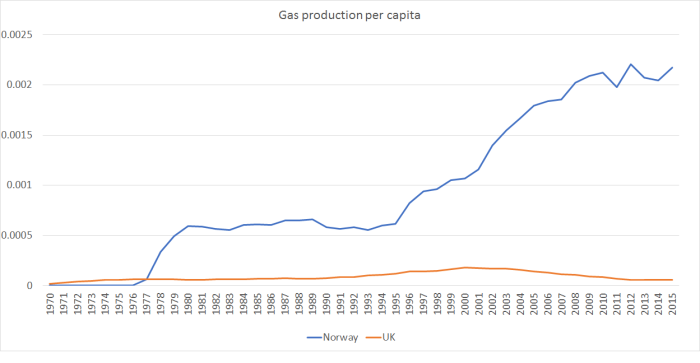
And so my bottom line is that we should be thankful for the reasonable returns we’ve had from NZSF to now (through some mix of luck and skill), but that since we can’t count on anything like those sorts of returns in future (even NZSF say so), and even the returns to date are really only sufficient to compensate us for the risk run on our behalf, we’d be better off locking in the gains we’ve had, closing down the Fund, liquidating the assets over a couple of years, and using the proceeds to repay public debt. Our government does not need to be in this game – unlike, say, the governments of Norway or Abu Dhabi, with genuine wealth to manage and smooth – and the returns to doing so don’t look that attractive. As the Crown is already heavily exposed (both through the tax system and its other extensive asset holdings) to the ups and downs of the domestic economy and global markets, strategies that reduce risk, rather than increase it, seem intuitively more appealing. The NZSF logic is the opposite of that.
In the meantime, if the government believes in the case for NZSF, it would be good to hear it from the ministers we elected, not the operations guys we pay to manage the money parcelled out to the Fund.
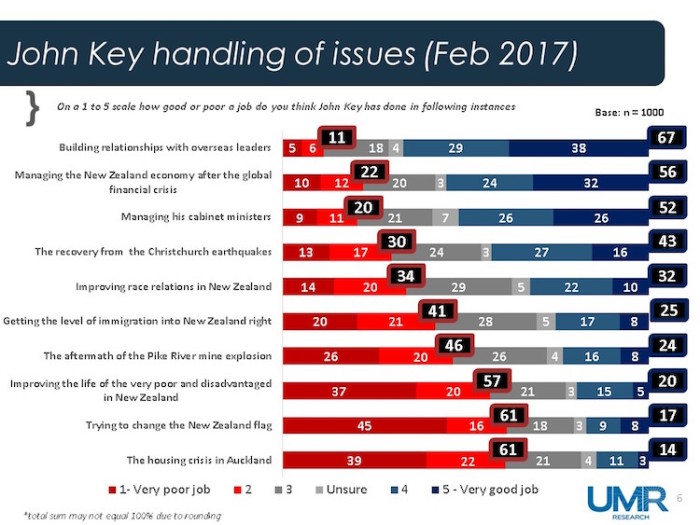
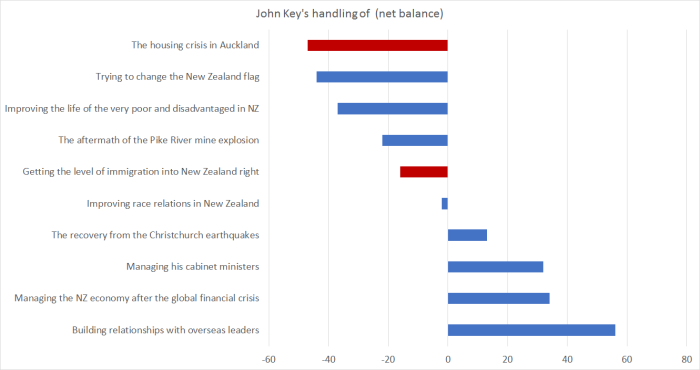 In some areas, Key rated very well, as one might expect (he did after all lead his party to three election victories). Relationships with foreign leaders scored as highly as you might expect from someone who seemed generally to be regarded as “the sort of person you want to have a beer with”. And if the government didn’t do anything much in the wake of the “global financial crisis”, arguably it didn’t have to – after all it was mostly a North Atlantic crisis, and when the crisis ended there, so did the worst of the backwash in the rest of the world. But if you are in office, you tend to get the credit.

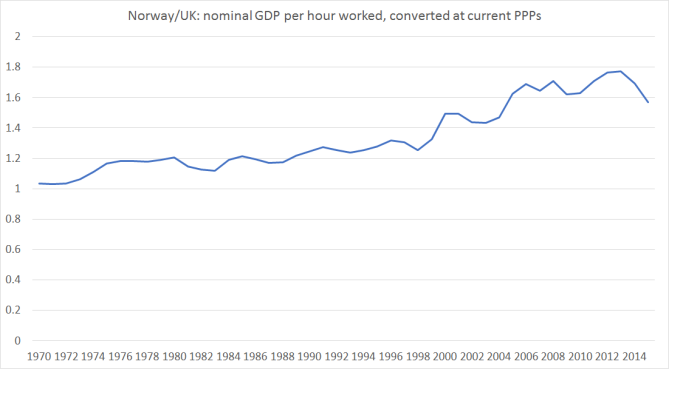 These days, by contrast, GDP per hour worked in Norway is around 60 per cent higher than that in the UK (which is in turn quite a bit higher than New Zealand’s). Norway has among the very highest material living standards of OECD countries, and the UK is still in the middle of the pack.
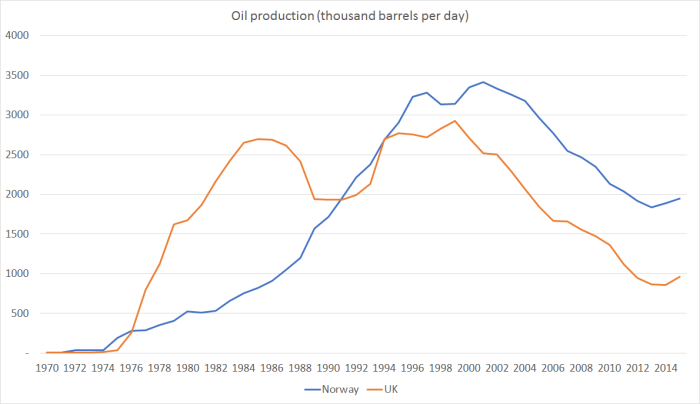
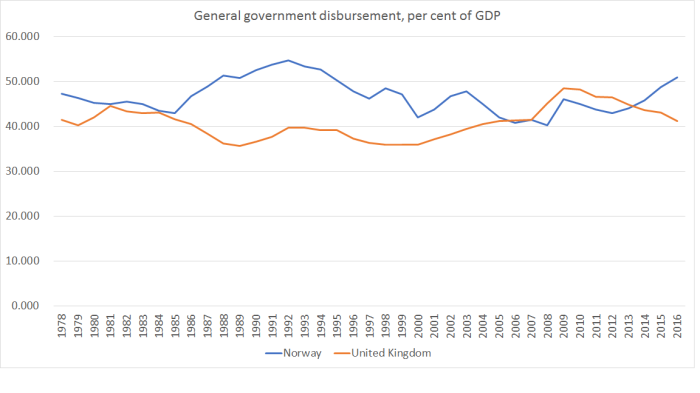


 They would be okay for the next few years, but once you get even 10 years out from here, there would need to be a lot of other expenditure cut to keep spending to around 30 per cent of GDP, even if (a) the two parties resume NZSF contributions soon, and (b) investment returns proved to be pretty good. I’m genuinely puzzled how they propose to square that circle.