I heard the Prime Minister on Radio New Zealand this morning running (again) the same spin that seems to go with the job, that somehow if New Zealand’s economic performance is perhaps not all we might hope for, it is at least as good – better is the typical claim – than other advanced countries. Almost always such claims seem to rest exclusively on the rapid and policy-driven population growth New Zealand governments have chosen – which boost the headline numbers, regardless of whether they leave the average New Zealander better off (in New Zealand’s case, experience increasingly suggests not).
But any meaningful comparison of economic growth across countries needs to adjust for differences in population growth rates. Per capita statistics aren’t a radical innovation. They have long existed for exactly that sort of purpose.
It used to be quite hard to get a reasonable sample of countries’ quarterly real GDP numbers. But the OECD now routinely publishes such numbers. A few countries seem to be a bit slow at providing the numbers the OECD uses, but when I checked there were 32 OECD countries with quarterly real GDP numbers up to and including the June quarter of 2019 (our most recent data).
This chart shows the latest annual growth rates for those countries, using national agency data for Australia and New Zealand and the OECD data for the rest. There are two measures: the annual percentage change is the increase from the June quarter 2018 to the June quarter 2019, and the annual average percentage change is the increase from the year to June 2018 to the year to June 2019. The latter series is a bit less noisy, but also a bit less timely. As it happens, this time New Zealand’s rank is exactly the same on both measures.
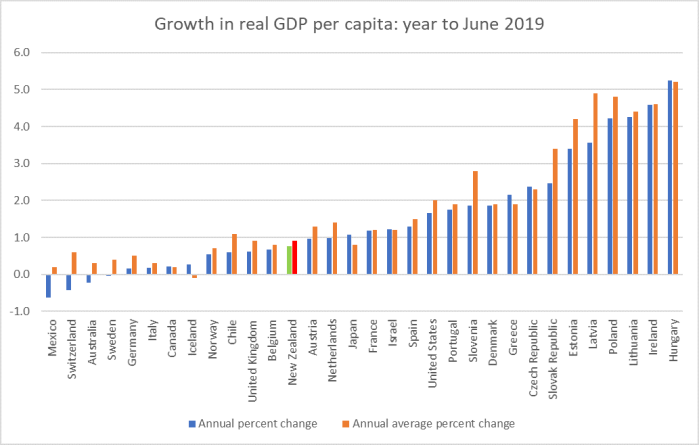
There are countries that have done worse than New Zealand: if one broke the group into thirds we’d be close to the bottom third of countries. But that shouldn’t be much consolation, since we have much lower starting levels of GDP per capita (and GDP per hour worked) than most of the countries to the left of the chart. The vision was (once) supposed to be that we might once again catch up with them.
Instead, at best we’ve been roughly matching the countries that are much richer and more productive than New Zealand, while the countries that are increasingly similar to us in productive levels rack up really strong growth rates (see seven of the eight countries to the right of the chart – and the Irish numbers are generally best discounted because of the corporate tax distortions). Here are the respective productivity levels
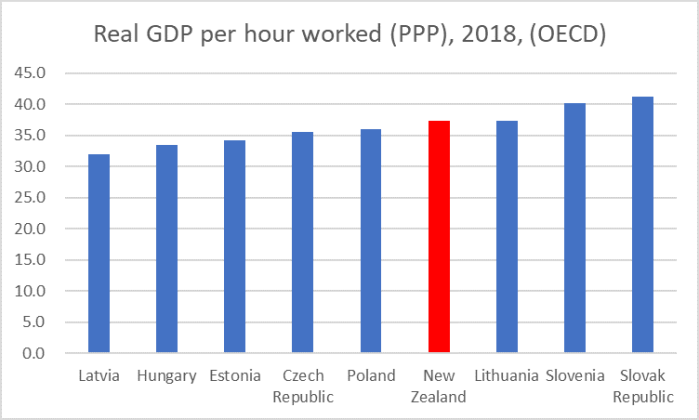
Over the last year, these countries averaged growth in real GDP per capita of just over 3.5 per cent per annum. New Zealand? About 0.8 per cent. And yes growth rates are slowing around the world, but over the last three years, those eastern European successful economies averaged 4.3 per cent per capita growth, while New Zealand averaged 1 per cent (in the bottom third of OECD countries). That is the sort of catch-up that can be achieved.
Are there potential caveats to all this? In respect of comparisons with the older advanced economies (those now mostly materially richer and more productive than we are), yes. GDP numbers are revised and with the added imponderable of the new results of the flawed census there will be changes to data over the next few months (SNZ is releasing some new labour market estimates later this morning). But nothing is likely to change the pattern I illustrated the other day
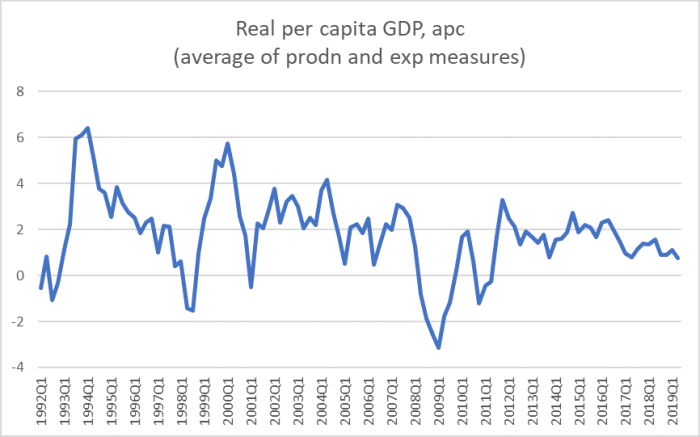
Growth in real per capita GDP – never good at the best of times this decade (compared to previous cycles) – has been tailing off, and that conclusion is most unlikely to be changed by any revisions.
Even more certainly, no conceivable revisions are going to change those huge gaps between the growth rates (per capita) of the rapidly emerging eastern European countries – every single one of which was until now poorer and less productive than New Zealand for at least the last 160 years – and the pitifully poor growth rates – per capita GDP or productivity – managed by New Zealand. It is a bi-partisan failure, but Labour, Greens, and New Zealand First are now in government. It is their responsibility, but they seem clueless, careless (ie many just don’t seem to care much if at all), and determined to do whatever possible to try to pretend there isn’t a problem, a failure, and that all is really pretty rosy in the economic garden, and if there are any issues they are all the fault of others.
The problem, the failure, starts at the top, with a Prime Minister and Minister of Finance who continue to simply repeat the spin, which bears little or no relation to the dismal reality of New Zealand’s multi-decade productivity underperformance. But they are aided and abetted by the Governor of the Reserve Bank, who simply makes things up (he was yesterday out claiming that “The New Zealand economy has proved resilient through a period of weakening global growth and heightened global uncertainty”) and the situation won’t be helped by a Secretary to the Treasury who knows almost nothing about New Zealand or about managing a national economy. Our economic and political institutions, and their key individuals, are failing us. New Zealanders – not those key decisionmakers and advisers – pay the price of failure.

Your first graph showed NZ to the virtuous right of the UK which is where I am currently on holiday. But as you say what matters is wealth per person and anecdotally both UK and France feel wealthier – the cars being driven, the items in the shops, the cafes and restaurants. When I first came to NZ I had the impression of a country of similar wealth to the UK & France but with less infrastructure and better lifestyle. Now lifestyle has changed a little to the worse for my liking but others may think differently. Where everyone (except our MPs) ought to agree is other countries are moving forward faster than NZ and have been doing so for a long time and it is beginning to be noticeable.
Jacinda is still able to meet the president of the USA but if our economy doesn’t start catching up other OECD countries in future she will be in line behind politicians from Estonia and Slovenia.
LikeLiked by 2 people
My friend in Thailand talks about the roads and cost of everything (cheap). Apples and pears though as they have no welfare system and a lot of dirt poor.
LikeLike
if we couldn’t manage productivity growth as good as the UK, over a year with extreme uncertainty about Brexit and the policy regime in any post-Brexit world, it would – given our dire long-term record – be extremely disconcerting.
Do note that these are growth rates. In levels term, both France and the UK show up well ahead of us (on GDP pc and much more so – since NZers work long hours over a lifetime – on GDP per hour worked).
Hope you are enjoying the holiday.
LikeLike
Total GDP (real or not) is an Omnibus figure comprising the sum of the production of natural-citizens plus immigrants
The GDP product of both needs to be granulated as per the following
Absolute Total GDP
Naturals 100
Migrants 10
Total 110
Naturals 90
Migrants 20
Total 110
Naturals 109
Migrants 1
total 110
GDP Per Capita
Naturals 100
Migrants 10
Total 110
Naturals 90
Migrants 20
Total 110
Naturals 109
Migrants 1
total 110
Naturals 115
Migrants -5
total 110
I wrote the following comment on 26 September
https://croakingcassandra.com/2019/09/26/some-imf-modelling-on-nz/#comment-42812
You replied that some could be achieved by modelling
Can the above be determined – because this is what we need to know – we all know that the addition of many migrants should be accretive in absolute terms although that cannot be guaranteed
We need to know what amount is accreted by the immigration inflow. We know that the mass influx of low skilled visa has had the effect of depressing wages across the board to the point it is quite possible the second examples are occurring – but any evidence of that is disguised in the totals and averages
LikeLike
Where is your comment on baby boomers. They aren’t all New Zealand born or having transferred their own schemes from UK?
LikeLike
International students are also counted as migrants. There are around 60,000 equivalent full time over 12 months that generate $4.5 billion in GDP.
LikeLike
There are 2000 criminal Kiwis also counted as migrants sent back from Australia starting up criminal activities in NZ. I guess criminal activities also constitute GDP.
LikeLike
my point really was that the answer could only be derived using a fairly sophisticated model – choice of which would itself likely be quite contentious – not that it could readily be done.
LikeLike