I’ve written previously, and quite critically, about various speeches given by Gabs Maklouf, Secretary to the Treasury (including here, here, here, and here) . I continue to be surprised that we have someone that poor as head of the government’s premier economic advisory body – for that I guess we should blame Iain Rennie and the State Services Commission. It was perhaps even more disappointing that Makhlouf was reappointed for a further term earlier this year – for that both SSC and the Minister of Finance must surely be held responsible. And, since I assume he does have some strengths even if economic and policy analysis is not among them, I remain surprised that he does (is allowed to do?) so many on-the-record speeches. This year, for example, he has done many more public speeches than the Governor of the Reserve Bank, even though the Treasury’s prime role is to advise the government, while the Reserve Bank Governor has extensively discretionary policymaking powers affecting directly or indirectly a large proportion of New Zealanders. In some other countries – Makhlouf’s native United Kingdom for example – the Secretary to the Treasury is generally not seen or heard by the public.
There was another Makhlouf speech a couple of weeks ago, headed Growing our Economic Capital: Investing in Sustainable Improvement in our Wellbeing.
There is a lot in the speech I could comment on. There is the notion that “we are in a new era of policy frameworks and I’m proud to say the Treasury’s Living Standards Framework is at the forefront of economic thinking” – which would be laughable, if it were not that Makhlouf, head of the government’s principal economic advisory agency, appears to take this claim seriously. Bryce Wilkinson of the New Zealand Initiative wrote an excellent critique of the Living Standards Framework here (pages 6 and 7) , and I’m not going to try to improve on that piece.
And there is the rank cheerleading – that probably went over okay in the Beehive – in Makhlouf’s opening description of the economy
The New Zealand economy has been performing well over the past 4 years, relative to both the potential growth rate of the economy (of around 2.7%), and to most advanced economies. Over this period, our economic growth rate has averaged 2.8% while the average growth rate of OECD economies has been around 1.7%.
in which he goes on to suggest that the results are commendable, to be celebrated, and something to “feel good” about. And yet there is not even a hint of the fact that:
- our population has been growing incredibly rapidly over that period, and so
- per capita real GDP growth has been no better than the (disappointing) median of other advanced countries, and
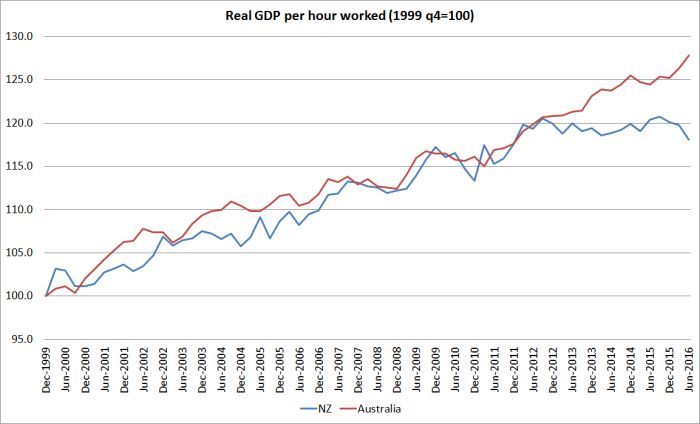
- our official data suggests there has been no growth at all in labour productivity for the last four years,
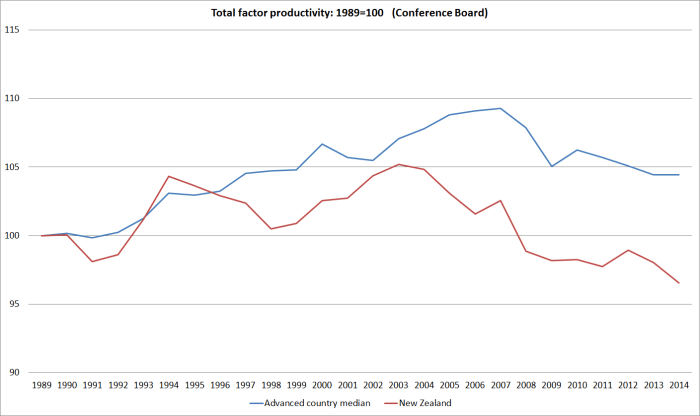
And all this on the back of 15 years of no growth at all in per capita real output of the tradables sector.
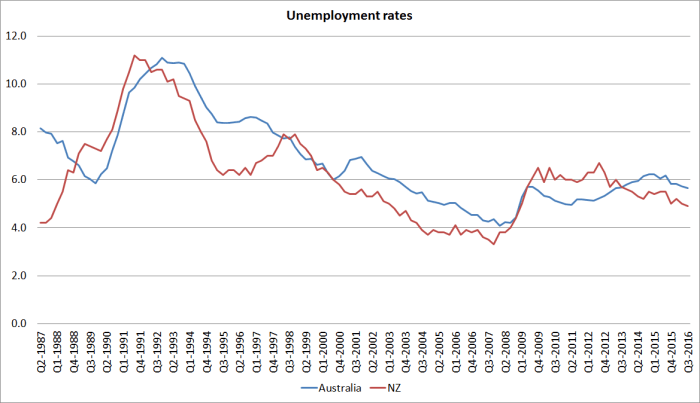
Sure, things could have been worse, but there isn’t much to celebrate. Makhouf included the unemployment rate is that list of good things, and yet his own department estimates that the NAIRU is now around 4 per cent, and the unemployment rate hasn’t been that low this decade.
Of course, I largely agree with Makhlouf that
We need to look as much to lifting the economy’s long-run average growth rate, one of the main sources of a sustainable increase in our collective wellbeing, as we do on worrying about whether the economy is operating at or close to its short term potential growth rate.
Indeed, one might think that the Treasury should put a lot more emphasis on how to lift long-term productivity growth. The short-term stuff is mostly the Reserve Bank’s job. And yet there is nothing at all in the speech, and nothing in anything else the Treasury has published, to suggest that the organisation has any real idea what it might take to reverse the staggering decades of relative economic decline in New Zealand. Instead, the Living Standards Framework seems to function in part to distract attention from that failure: providing robust advice to governments on how to reverse long-term relative economic decline has become all too hard, so we’ll burble on instead about bureaucrats’ personal agendas for how society and government should be organised. Hiding under that broad heading of “economic capital” that Makhlouf wants to build, for example, is “social capital (including culture)”. It is far from clear that the Treasury has anything useful to say on building culture, or that the views of its staff have any greater merit than those of the first 1000 voters in the Auckland telephone directory. That is what we have political processes for: Midwest evangelicals and New York liberals (and their New Zealand counterparts) have quite different and conflicting visions of culture and society.
There is also the staggering hubris and faith in governments (officials I suspect more than the elected ones) that pervades the speech. And, on the other hand, signs of an agency that (at least at its head) has totally lost sight of how prosperous stable societies develop and maintain themselves. I searched through the speech and the word “markets”, for example, appears only in reference to financial markets – nothing at all about competitive processes, private sector innovations (products and institutions) and so on. And, on the other hand, almost nothing on the limitations of knowledge that all of us face – perhaps governments most of all. Surely only a bureaucrat – and a not very introspective one at that – could say this
Government strives to take a system view. A system approach underpins the direction the public service has been moving in following the Better Public Services report in 2011. It reflects the fact that central government is well-positioned to observe and monitor the system dimensions that influence our collective wellbeing. It also has system-level instruments that can help make a difference, some of which are about devolving power and using the energy of communities.
At the centre, technology enables us to collect and share information on what various communities are doing to improve their lives. We also have the analytical capabilities to assess what works and does not, but we need to do the hard work of converting that potential into practical initiatives through appropriate investments in economic, environmental and social infrastructures.
The frightening thing is that he doesn’t seem chastened at all by the repeated failures, here and abroad, of well-intentioned government interventions in so many areas. In a week when attention focuses on the inability of central government to effectively operate something as relatively basic (and close to a public good) as a tsunami warning system, it is a reminder that we are really owed much more humility from our senior public servants. Rather than imperial visions of reshaping society, or even just championing yet more “smart active” interventions that all too often prove to be anything but, in part because too rarely do the advisers take into account that humans design and run these systems, not angels, we’d be better with a Treasury constantly focused on what governments can’t do well. Plenty of people criticise the 1980s and 1990s Treasury, but one thing the institution certainly knew then was that government failure was as pervasive as market failure, and that institutions had to be built on and around the limitations of flawed human beings. At least at the top of the organisation, that conception now seems long lost.
I could go on – I quite enjoy the occasional rant – but I wanted to focus specifically on some of Makhlouf’s comments about macroeconomic policy and financial regulation. Bear in mind that he has no known background in either subject.
He starts with the 2008/09 international financial crisis.
For example, one of the main events of the last ten years has been the global financial crisis. This was system failure par excellence. It showed us that a combination of placing too much weight on the wrong indicators, guided by mis-specified models, could lead to disastrous policy decisions being made in many countries and outcomes affecting millions of lives. These models ignored the critical role of financial markets and networks. The policy prescriptions they led to misjudged how complex systems work. They resulted in coordination and communication failures, among other things.
Which might sound impressive, but in fact there is much less there than meets the eye. No one seriously thinks that the limitations of formal macroeconomic models – typical models didn’t have an explicit financial sector – explain the crisis that hit several countries in 2008/09. Among other things, government agencies in countries that didn’t have domestic crises – New Zealand, Australia, and Canada among them – used exactly the same sorts of models. Having said that, you might have thought this paragraph would give Makhlouf pause for thought – if really smart people in governments around the world could get things so wrong (the British bureaucracy included, where Makhlouf held quite senior positions) what gives him confidence that things will turn out better next time? Limitations of knowledge are frustrating, but profound.
Makhlouf looks to the future
People are still trying to understand the lessons from the GFC. One area of learning which has had international attention is the critical role of better coordination of fiscal, monetary, financial and broader macroeconomic policies in order for those policies – whether fiscal, monetary, financial and broader macroeconomic – to be implemented effectively when one of them faces constraints. It can be the difference between a well-conducted orchestra playing a symphony and ninety disorganised musicians creating a cacophony. This area has been a focus of the G20 and IMF since 2008.
Maybe, but it is difficult to spot much visible change in how macroeconomic policy is conducted, or in how macroeconomic policy institutions are designed and organised.
What of New Zealand?
I should emphasise that New Zealand was one of the countries that coordinated fiscal and monetary policy effectively over the course of the GFC. Fiscal policy supported monetary policy through the crisis by being stimulatory when needed and then contractionary once the economy was recovering. But that doesn’t give us an excuse to cut class when experience delivers useful lessons and poses questions, including on policy coordination. And we should also make sure we learn the lessons of putting too much weight on simplified economic models.
Makhlouf wasn’t in New Zealand during that 2008/09 period. Perhaps that explains what is simply a mistaken description of how things worked here. In fact, New Zealand was one of the few advanced economies where there was no discretionary fiscal stimulus undertaken during the recession. On the assumption that the good times would last, and on explicit Treasury advice to that effect, the previous Labour government had been putting in place quite expansionary fiscal policies anyway, and by chance some of those measures were still taking effect when the recession hit, but there was no coordination on those matters across The Terrace. In my observation, the two agencies (the Reserve Bank on the one hand, and Treasury/Minister) got on well enough – and worked closely together on specific interventions like the guarantee schemes – but there was no fiscal/monetary policy coordination. Rather fiscal policy had set its medium-term course, and monetary policy took that into account in setting and adjusting the OCR with the aim of meeting thre inflation target. The system worked as it should – and it helped that New Zealand interest rates didn’t get to zero – but that isn’t the sort of thing people have in mind when they talk about policy coordination.
And – minor cosmetic changes aside – the legislation fiscal and monetary policy operate under today is the same as it was in 2008/09. If Makhlouf thinks something different is needed, he should tell us – and advise the Minister accordingly.
Makhlouf seems to favour change or – perhaps – just wants to sound as though things are different now.
Building on what I said earlier, my first example relates to the coordination of monetary, financial (including prudential) and fiscal policies towards not only keeping the economy operating close to its current growth potential, but doing so in a way that does not cause harm to the growth potential of the economy. Indeed it can enhance it.
International experience over the past 10 years and maybe more casts increasing doubts about the effectiveness and efficiency of monetary policy alone in managing the economy’s performance relative to its current growth potential when it is adjusting to a large structural shock. In fact, relying on monetary policy alone to do that job risks the longer term growth potential of the economy as well, by leading to the misallocation of resources towards investments such as residential investment that are comparatively less productive in terms of generating wealth and well-paid jobs.
It is certainly true that to the extent that some hubristic economists came to believe (consciously or otherwise) that serious recessions were now a thing of the past, they were simply wrong. And, of course, plenty of people are asking questions about whether there are better ways of running policy in relevant areas – although doing that well surely depends on a clear and compelling explanation for the 2008/09 recession and aftermath (without it, policy change risks being as unrelated to the causes of the problem as many of the post-Depression policy changes in the 1930s, here and abroad, were).
But if people are asking questions, what is surely striking is how little institutional change there has been in the years since that severe recession. As the Governor of the Reserve Bank often, and rightly, points out, no country has even switched from inflation targeting to some other nominal anchor. No country I’m aware of has made any material changes to institutionalise the coordination of fiscal and monetary policy. And although various countries – including New Zealand – have been making a bit more use of direct controls of bits of the financial system, it is hardly some integrated coordinated approach to policy – if anything, it looks a lot more like assigning a new tool to a new target. Some argue at present for tighter monetary policy in various countries even though inflation is low, in the belief that doing so would assist longer-term financial stability and growth prospects. But it doesn’t seem to be an approach that governments (or central banks) are signing on to. Of course people are dissastisfied with the economic outcomes globally over the last decade, but there isn’t any sign yet that greater macro policy coordination within countries is a material part of the answer.
I’m not sure what Makhlouf really thinks about inflation targeting. He has been on record suggesting that he doesn’t think major change in the PTA is warranted next year. But then it seems strange for the Secretary to the Treasury to be undermining a macroeconomic policy framework that has worked quite well for New Zealand – macro policy can’t solve long-term productivity problems, but we’ve avoided serious economic and financial crises for the 25 years of the current fiscal and monetary regime. That is something to appreciate.
And before I leave that section of Makhlouf’s speech, he talks about the risk that inflation targeting (in isolation?) can lead to “the misallocation of resources towards investments such as residential investment that are comparatively less productive in terms of generating wealth and well-paid jobs”. Just two points in response: the first is that houses are to live in, not to generate “wealth and well-paid jobs”, and second, surely everyone now accepts that one of the biggest issues – policy failures, but not macro policy – in New Zealand (and Australia, the UK, Canada, and large chunks of the US) is that far too few houses were built, on land made artificially scarce by regulation. We simply do not have a problem of over-investment in housing, however that concept is defined. Surely the Secretary to the Treasury knows this?
I could go on but won’t – tempting as his central planners’ approach to tourism is, for example. The overall quality is just depressingly poor. Lots of virtue-signalling, and little sign of really hard-headed analysis and engagement with the specifics of New Zealand, or the limitations of government.
In conclusion, Makhlouf observed
It’s about being prepared for the unknown unknowns. And I should add that part of this preparation is making sure our institutions are fit for at least the next 25, 30 or 40 years.
That sort of timeframe is probably unrealistic – elections come by every three years after all – and the deeper-seated institutions of our society and culture shouldn’t be lightly tampered with anyway. But it is hard not to be concerned that our Treasury is not now fit for even the next decade. Even a centre-left government – to whom things like the Living Standards Framework might be appealing – should expect (and will probably need) something more rigorous than seems to be on offer at present. Perhaps even more unsettling is that the weakness at the top of the Treasury don’t seem counterbalanced by strengths in any of the main economic policy or advisory agencies.
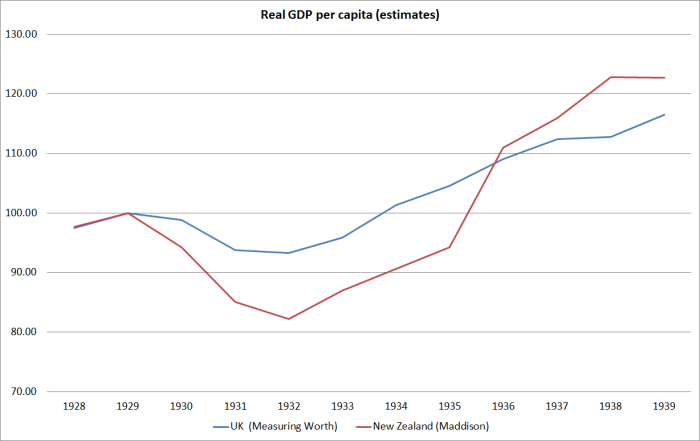 No wonder there was a net migration outflow during the Depression – small, by the standards of some we’ve seen since, but then the travel costs back to the UK were much greater than today’s three hour flight to Sydney, Brisbane or Melbourne.


 In fact, on this measure we look a lot more like Norway – which has a huge positive NIIP position (net foreign assets) and very little government debt.


