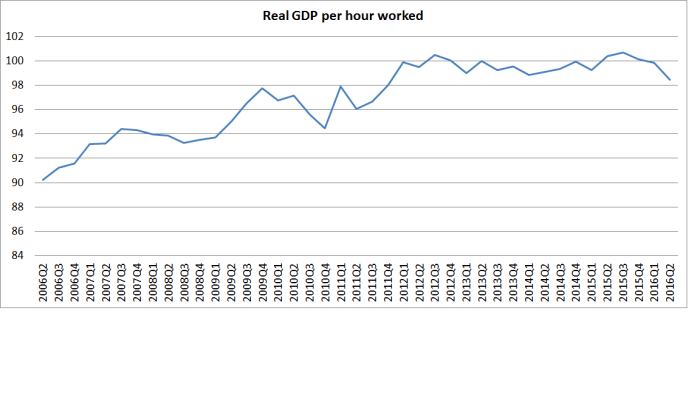
A few weeks ago I ran this chart, showing quarterly real GDP per hour worked for New Zealand for the last decade or so. I used an average of production and expenditure GDP, and HLFS hours worked data. The rather dismal picture was of no productivity growth at all for the last few years
Comparable quarterly data isn’t readily available for a wide range of other countries, so for such comparisons one is forced back onto annual data from international databases such as the OECD’s. And the international agencies take a while to get a full set of annual data – thus, New Zealand’s annual national accounts for the year to March 2016 (used as the basis for the OECD’s 2015 annual numbers) won’t be released until next month. We aren’t the only laggard – for a third of the OECD countries there are only 2014 annual numbers available.
So how has our (labour) productivity growth compared with that of other OECD countries over, say, the decade to 2014? Taking a decade is (like all such comparisons) a little arbitrary, but it should be long enough to largely eliminate the effects of year-to-year volatility. And a comparison starting in 2004 and ending in 2014 means starting before the peak of the last boom, and ending when the worst of the 08/09 recession and the euro crisis was over (well, perhaps with the exception of Greece).

I’ve highlighted New Zealand (in red) and the other Anglo countries (in green). The median growth rate for this set of countries is a couple of observations to the right of New Zealand. Note that I am using (real) national currency measures here. If one wants to compare income or productivity levels across countries, one has to use PPP-adjusted measures. But in comparing growth rates, the OECD recommend (sensibly) using national currency measures.
New Zealand’s performance hasn’t been notably bad by any means – just a little below the median. But then the goal has supposedly been to grow a bit faster than the other advanced countries, to close the large gap between productivity and incomes in New Zealand and those elsewhere in the OECD. And in fairness, most of the countries to the far-right of the chart have lower levels of productivity than New Zealand – so they are also trying (and succeeding in their case) in catching up. But New Zealand couldn’t even quite match the productivity growth rates of the other Anglo countries – traditional comparators.
Sometimes one detects a sense among people writing about New Zealand that small countries face a particular disadvantage, and that small countries couldn’t be expected to sustain as rapid income or productivity growth as large countries. Taking a longer span of data, I had a look at that proposition in a post last year. There didn’t seem to be much, if any, support for the idea that big countries get rich faster.
But what about the last decade?
Here is same chart
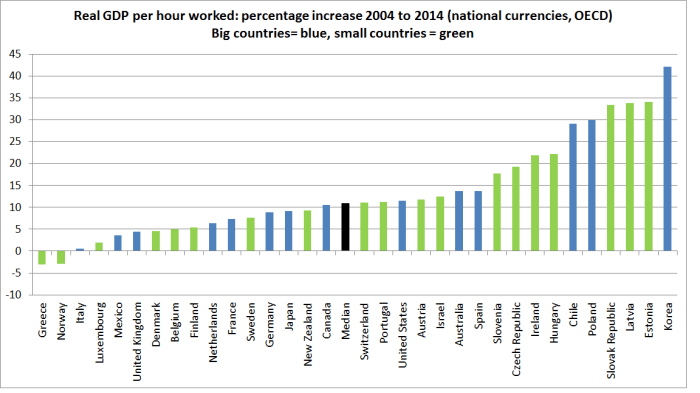
I’ve drawn the line no doubt a bit arbitrarily. Netherlands has a population of around 17 million and it and all larger countries are “big”. Other countries, with populations of 11 million or less are “small”. If anything, the small countries have done slightly better than the large countries over this particular period, but the difference is not enough that I’d want to make anything of it. But the message is still the same: New Zealand hasn’t done particularly well, and plenty of small countries have done better.
The OECD’s database goes back to 1970, but they only have full data for 21 countries (including New Zealand for that period). Over the full period, we had the second slowest productivity growth of those 21 countries.

And once again, the small countries and large countries are scattered either side of the median.
Over the last decade, we have actually grown very slightly faster than the median of these particular 21 countries. It has been our least bad decade since 1970. But I wouldn’t take much comfort from that: (a) the difference was slight, (b) we grew a bit less rapidly than the whole OECD median, and (c) on our own more recent data (see first chart) we’ve had no productivity growth at all in recent years

But are we expecting too much?
http://www.wsj.com/articles/why-the-economy-doesnt-roar-anymore-1476458742
LikeLike
I thought that was a really interesting article, but my focus – particularly in this post – is relative productivity growth (ie relative to other countries) not absolute. SO there might well be a semi-permanent global productivity growth slowdown, but with good policies we should be able to grow faster than the median advanced country (someone has to after all, by definition!)
LikeLike
I think it ‘roughly right’ to state macroeconomics assumes real estate/construction is a low productivity sector. If so, I guess that would imply a future NZ construction boom would lead to a further decline in the country’s relative productivity performance: perhaps this explains the reluctance of central government to support an expansion in housing supply!
LikeLike
of course, we have been having a construction boom for the last few years (incl Chch repairs etc). But then we had one in the years from 02 to 07 too.
LikeLike
That statement is wrong. Businesses make a margin on employees. eg 1 million working people generate disposable income of $150 billion. GDP would be the margin on top. 10 million dairy cows generate only $10 billion in export sales and the rest of the time people needed to be employed to clean up their mess. Therefore the Dairy industry is low productivity because it employs a large force of labourers and cleaners. Therefore as Dairy expands so the adverse impact on NZ productivity.
LikeLike
Watched Q&A this morning about the forestry sector. 99% of forestry previously owned by the government has been sold. Kiwis are employed as labourers in the logging and clearing of these forests which are then stacked at the harbour for export. There is no value add and therefore a extremely low productivity sector employing lots of low skilled labour in logging and cleanup. Local factories that value add are not able to even buy logs from the same area and are shutting down.
LikeLike
Korea buys our logs processes it and sells it back to us. Nothing to do with immigration but everything to do with asset sales and divestment of value add infrastructure.
LikeLike