Net economic benefits from refugees?

I noticed an odd story in the Dominion-Post this morning.  In the hard copy it is headed “Economic benefits to compassion”, while on Stuff it goes under the title “Refugees are good for NZ’s economy, say economists”.  The first heading seems like a category error, while the second is almost certainly wrong.

Let’s take the category error.  Surely we exercise compassion for its own sake, not looking out for what is in it for us?     We might, reasonably, count the costs and consider the risks.  In some sense, no doubt, the Good Samaritan did.   But if an act –  personally or nationally –  is about compassion, it is somewhat sullied by attempting to tot up what is in it for us.  Perhaps some see a refugee programme as an “economic lever” too, but I doubt there are many.

An economist then suggests that we should think of the money spent on resettling refugees as an investment.  But he lost me when he started talking about the economic benefits of other areas of government spending such as sport.  Does anyone really think that governments (central and local) spending money on the Rugby World Cup had a net economic benefit?  Or the America’s Cup?   The absence of economic benefits isn’t necessarily a reason not to spend the money:  there is nothing wrong with a party from time to time, so long as we recognise that it is a party, not an investment opportunity.

Perhaps even more egregious, a refugee advocate compares the cost of new refugees with the new flag proposal, noting that people have talked of billions of dollars of possible benefits from a new flag and that we should, similarly, be thinking about the opportunities the refugees create.  In fact, only the Prime Minister has mentioned such benefits, and no one else seems to agree with him.  But again, to change the flag, or not, shouldn’t be primarily a matter of economic costs and benefits.

But if we do want to do the economic calculations, how likely is it that new Syrian refugees will prove to be of net economic benefit to New Zealand (ie improving economic outcomes for New Zealanders)?  Professor Paul Spoonley is confident, but it is not clear what he bases his confidence on.    He notes that the average migrant to New Zealand is estimated to have made a positive fiscal contribution, but:

  • That is an average across all migrants, and everyone recognises that there are far higher upfront costs for refugees than for most migrants
  • The one careful study on fiscal contributions was a snapshot done a decade ago, and not looking at the lifetime fiscal costs and benefits.
  • That study was also done when the government was running very large surpluses (ie taxes on everyone were higher than they needed to be)
  • Fiscal costs/benefits are not the same as economic costs/benefits.

Spoonley recognises that refugees start at a disadvantage, but still believes they are “likely to make a net positive contribution”, albeit over a longer timeframe.

But reading the article reminded me of a table I had seen in the immigration papers MBIE released to me.  For those granted residence approvals between April 2001 and March 2009 it showed the proportion (of those 18 and over) who were on welfare benefits, and the proportion earnings wages and salaries as at 31 March 2011.  These new residents had, on average, been in New Zealand  for six years by this time.

For those who came under the skilled/business streams (about half the total), only 1.5 per cent were on welfare benefits and 71.8 per cent were earnings wages and salaries.  Even that latter number seemed surprisingly low, but let’s treat it as some sort of benchmark for now.

The table does not show the figures separately for refugees.  But it does report the numbers for those under the combined “International/humanitarian” stream, which includes 750 refugees per annum, and around 1500 people under the Samoan quota and Pacific Access category.  These latter are people who do not meet our skilled migration requirements, but who all come from countries where English is widely used (Samoa, Kiribati, Tonga).  It is a lot easier for them to adjust than for refugees from most countries.

And yet for the combined “international/humanitarian” stream, after six years in New Zealand  only 50.9 per cent (of those 18 and over) were earnings wages and salaries and 25 per cent were receiving welfare benefits.   I think it is reasonable to presume that figures will have been worse (perhaps materially worse) for the refugee quota alone.   Why would the Syrian refugees be different?.

Between coming from a non-English speaking environment, from a country whose economic institutions have been moribund for decades, and which had managed no convergence with the advanced world over the 50 years before the conflict, the chances are simply not good that these refugees, as a group, will end up making a net economic contribution to New Zealand.  And it is most unlikely that they will even make a positive fiscal cost.

None of which is an argument for not taking refugees.  Doing so is mainly a humanitarian choice, not something we do because we benefit from doing so.  I don’t have a strong view on how many refugees New Zealand should take [1], but I don’t think possible economic benefits to us should be a factor one way or the other.

UPDATE: A commenter correctly notes that we might reasonably consider the most effective way in which to provide assistance, and “most effective” would include a whole variety of possible costs.  In principle, benefits to us may reduce the net costs of some forms of assistance.  But my wider point holds, that the decision to assist shouldn’t be driven materially by any expected benefits to us.

[1]  Subsequent to writing this post, I have written a post on refugees and migrants on my Christian blog.

Does the law prohibit the Reserve Bank releasing submissions?

After my post earlier this afternoon someone mentioned the possibility of getting copies of the submissions on the investor finance restrictions under the OIA.  You might have thought so too.  At the time submissions closed, I did.  But no.

A few weeks ago I posted briefly about the response I had received from the Reserve Bank to my request for copies of each of the submissions they had received on the (then) proposed investor finance restrictions.

The Bank refused my request,  arguing that it would be met by the then-forthcoming “summary of submissions” which they would prepare.   Moreover they argued that while the OIA obliges the Bank to provide documents in the form sought by the requester, there was an exception if to do so would “impair efficient administration” or “be contrary to any legal duty of the …organisation in respect of the document”.

The Bank argues that it would “impair efficient administration” to provide me copies of the documents, with appropriate redactions, and that providing a summary of the submissions will fulfil its statutory requirements.  That is clearly not so.   I requested copies of all the submissions, which includes the ability to look at them individually.  When it produces summaries of submissions the Bank attempts to distill themes or representative arguments, on which it then comments.  If it were providing summaries of each of the submissions individually, I might be content, but a self-selected summary across a whole range of submissions is simply no substitute.   As I have pointed out previously, the contrast with submissions to select committees of Parliament is striking. The submissions on the legislation relating to offshore buyers’ and tax numbers are on the website in full.    Submitters include some of the same people who submitted on the Governor’s proposals ( eg one bank, and the Bankers’ Association).

And, as I noted this afternoon, the actual response to submissions that the Bank released did not contain, even remotely, a representative sense of the nature of the issues raised in my own submission (the only one I have a copy of).

In its response to my OIA request the Reserve Bank also noted that “much of the information contained in the submissions that you requested must be withheld in order to comply with the confidentiality provisions of section 105 of the Reserve Bank of New Zealand Act”.  And it seems that this provision is probably at the heart of the issue.

What does it say?  Here are the key provisions

105 Confidentiality of information

  • (1) This section applies to—
    • (a) information, data, and forecasts supplied or disclosed to, or obtained by,—
      • (i) the Bank:
      • (ii) a person appointed under section 99(2)(b), section 101, or section 119
      • under, or for the purposes of, or in connection with the exercise of powers conferred by, this Part:
    • (b) information and data derived from or based upon information, data, and forecasts referred to in paragraph (a):
    • (c) information relating to the exercise, or possible exercise, of the powers conferred by this Part.
    • 2) Information, data, and forecasts to which this section applies shall not be published or disclosed by the Bank, any officer or employee of the Bank, or a person appointed under section 99(2)(b), section 101, or section 119, except—
    • (a) with the consent of the person to whom the information relates:
    • (b) to the extent that the information is available to the public under any Act, other than the Official Information Act 1982, or is otherwise publicly available information:
    • (c) in statistical or summary form arranged in such a manner as to prevent any information published or disclosed from being identified by any person as relating to any particular person:
    • (d) for the purposes of, or in connection with, the exercise of powers conferred by this Part:
    • (e) in connection with any proceedings for an offence against this Act:
    • (f) to any central bank, authority, or body in any other country which exercises functions corresponding to or similar to those conferred on the Bank under this Part for the purposes of the exercise by that central bank, authority, or body of those functions.
There are lots of words, but if public submissions on proposed new regulatory controls could be considered as “information, data and forecasts” supplied to the Bank then it would appear, under 105(2)(c), that the Bank cannot release any information about individual submissions, except in summary form. Even when policies, like the LVR restrictions, are to be applied generally (as distinct from supervisory intervention that might affect only one banks) we cannot know the substance of the submissions made on those proposed restrictions.

This seems like a travesty of democracy. Submissions –  on major new public policy initiatives – can be disclosed to foreign central banks or supervisors, but not to the New Zealand public. Any views banks or members of the public might submit to the Reserve Bank on monetary policy would typically be discoverable under the OIA, but those on prudential matters are apparently not. And this is so, even though for monetary policy there is a relatively specific objective for which the Governor can be held to account, while there is nothing remotely specific about how the statutory objectives for prudential policy should be measured.

Probably no one has any real problem with keeping confidential some private information about individual businesses.  But opinions and material supplied as part of a law-making process, which is what these consultative processes are, should be a quite different matter.  Submissions to Parliament’s select committees are published, and yet select committees are not even the final decision-maker on anything.  On proposed new statutes the whole House has a final vote, and on proposals that came initially from a Minister and Cabinet.  By contrast, when (unelected) Graeme Wheeler makes laws  –  having proposed them himself  – citizens are apparently not entitled to see the evidence, and submissions, he receives before making these decisions.

Like so much about the Reserve Bank Act, it is past time to reform these provisions.  Good access to official information is vital if we are to ensure that such a powerful institution is to be robustly accountable.  At present, there is far too little effective accountability and scrutiny.  A system in which the Governor can tell us as much, or as little, and then with his own slant, on the submissions he receives should be seen as simply unacceptable.  In this case, quite a simple amendment to the Reserve Bank Act would rectify the situation, making explicit that submissions on proposed changes to conditions of registration, or any other restrictions that affect all institutions, are not covered by the section 105 exemption, and should routinely be published on the Reserve Bank’s website.

Of course, if anyone else wants to request copies of the submissions, the Bank should presumably respond immediately declining their request and explaining why.  Unless they want to reconsider and change their interpretation of section 105, any delay would itself be a breach of the Official Information Act.

Two central banks on property: a study in contrast

Luci Ellis, head of the Reserve Bank of Australia’s Financial Stability Department,yesterday  gave a speech titled “Property Markets and Financial Stability: What do we know so far?,  at a real estate symposium at the University of New South Wales.

The Reserve Bank of Australia is a fairly hierarchical organisation, and so although Ellis is a department head, there is an Assistant Governor (several of them) and a Deputy Governor and the Governor above her.  It is a reminder of how deep a bench of talented people the RBA has.

I didn’t agree with everything in Ellis’s speech by any means – among other things there is an uncharitable dig at the 1990s RBNZ, and I was surprised to find no references to land use regulation at all –  but it is the sort of speech that one comes away from with plenty of food for thought.  It is thoughtful and balanced, offering some fresh insights, and reframing other material in an interesting way. It will repay rereading.   Taken together with the speech from Wayne Byres, chairman of APRA, that I discussed recently, it is the sort of material that gives one some confidence that the key Australian institutions  have thought carefully and deeply about property market issues and risks.  And that they have sought to use historical experiences, and those of other countries, for illumination and not just for support.  Not everyone in Australia will agree with Luci Ellis’s way of looking at the issues, but it would be foolish not to grapple with the arguments and evidence that people like her advance.

The contrast with our own Reserve Bank is a sorry one. Our central bank does plenty of speeches, but most of them are pretty lightweight affairs.  As they will, and must, market commentators scour them for hints about near-term policy direction, but I don’t think any reasonably well-informed observer comes away from a Reserve Bank speech –  whether from Wheeler, Spencer, Fiennes, McDermott, or Hodgetts – feeling that they now understand the isssues, or even the nature of the questions, better.  Sadly, it isn’t only the Reserve Bank: the quality of the economic analysis from our key economic policy agencies more generally now seems patchy at best.  I bang on here about the New Zealand’s slow continued relative economic decline, but when I look at the quality of the policy advice etc (whether it is MBIE or Treasury on (eg) immigration, or the Reserve Bank) I sometimes wonder if we should really be surprised.

I’m not going to try to excerpt Luci Ellis’s speech, simply encourage anyone interested in the substantive issues to read it.  Little of it is Australia-specific and many of the insights and questions are relevant to the discussions and debates that should be occurring in New Zealand.

Rather than excerpt the core content of the speech, I want to draw attention to just one section about good public policy processes.  Here is what Ellis has to say:

But the policy imperatives inspiring the work make it even more important to be scientific in our approach. By scientific, I mean the idea that the celebrated physicist Richard Feynman talked about in a much-cited university commencement address (Feynman 1974).

“Details that could throw doubt on your interpretation must be given, if you know them. You must do the best   you    can – if you know anything at all wrong, or possibly wrong – to explain it. If you make a theory, for example, and advertise it, or put it out, then you must also put down all the facts that disagree with it, as well as those that agree with it.”

It’s an argument for nuance, for being rigorous about your approach and for being prepared to admit you might be wrong. But I don’t want to understate the challenges this poses in a policy institution.

I hadn’t come across Feynman’s speech previously, but it is also worth reading.   Here is the fuller version of the bit Luci Ellis quoted from.

It’s a kind of scientific integrity, a principle of scientific thought that corresponds to a kind of utter honesty–a kind of leaning over backwards. For example, if you’re doing an experiment, you should report everything that you think might make it invalid–not only what you think is right about it: other causes that could possibly explain your results; and things you thought of that you’ve eliminated by some other experiment, and how they worked–to make sure the other fellow can tell they have been eliminated.

Details that could throw doubt on your interpretation must be given, if you know them. You must do the best you can–if you know anything at all wrong, or possibly wrong–to explain it. If you make a theory, for example, and advertise it, or put it out, then you must also put down all the facts that disagree with it, as well as those that agree with it. There is also a more subtle problem. When you have put a lot of ideas together to make an elaborate theory, you want to make sure, when explaining what it fits, that those things it fits are not just the things that gave you the idea for the theory; but that the finished theory makes something else come out right, in addition.

In summary, the idea is to give all of the information to help others to judge the value of your contribution; not just the information that leads to judgement in one particular direction or another.

The easiest way to explain this idea is to contrast it, for example, with advertising. Last night I heard that Wesson oil doesn’t soak through food. Well, that’s true. It’s not dishonest; but the thing I’m talking about is not just a matter of not being dishonest; it’s a matter of scientific integrity, which is another level. The fact that should be added to that advertising statement is that no oils soak through food, if operated at a certain temperature. If operated at another temperature, they all will–including Wesson oil. So it’s the implication which has been conveyed, not the fact, which is true, and the difference is what we have to deal with.

And this, I think, is what most seriously troubles me about our own Reserve Bank’s contributions to the discussion of property risks etc.  Whether it is speeches from the Deputy Governor, the Governor’s own comments at FEC, consultation documents, and responses to consultation documents, we’ve seen far too little of the sort of scientific integrity that Feynman was talking about.  We might not expect much from advertising agencies, or from politicians.  But we really should expect it from an independent technocratic agency such as a central bank.

We had some glaring examples of how not to do policy in the Reserve Bank’s processes that led to the decision to treat lending on investment properties as riskier than other housing lending.  Ian Harrison documented various examples of selective quotation, dubious use of published studies etc. I gather that the Bank reckons it has found some holes in Ian’s arguments, but it shouldn’t have needed him to be raising the issues at all.  We should expect an organisation like the Reserve Bank to go out of its way to make its case, and to make its case more convincing by showing that it was aware of, and had drawn attention to, any potential pitfalls or weaknesses in the arguments, or case, it was making.

My own concern is much more with the new investor finance restrictions.  Perhaps they are an appropriate response to the situation, but even if so we will never be able to have a well-founded confidence in such a conclusion because of the poor quality, highly selective, case the Bank has made, the secrecy with which it guards the submissions that were made on its proposals, and the cursory or non-existent responses it has made to concerns and criticisms of its consultative document.

My submission to the Reserve Bank  on the proposed restrictions is here. Here is an extract that summarised some of my key concerns

My concerns about the substance of the proposal fall under five headings:

  • The failure to demonstrate that the soundness of the financial system is jeopardised (this includes the failure to substantively engage with the results of the Bank’s stress tests).
  • The failure of the consultative document to deal remotely adequately, with the Bank’s statutory obligation to use its powers to promote the efficiency of the financial system.
  • The failure to demonstrate that the statutory goals the Bank is required to use its power to pursue can only, or are best, pursued with such a direct restriction.
  • The lack of any sustained analysis (here or elsewhere in published Bank material) on the similarities and differences between New Zealand’s situation and the situations of those advanced countries that have experienced financial crises primarily related to their domestic housing markets.
  • The failure to engage with the uncertainty that the Bank (and all of us) inevitably face in making judgements around the housing market and associated financial risks, and the costs and consequences of being wrong.

The absence of any substantive discussion of the likely distributional consequences of such measures is also disconcerting.  Distributional consequences are not something the Reserve Bank has ever been good at analysing.  In many respects they were unimportant when the Bank’s prudential powers were being exercised largely through indirect instruments (in particular, capital requirements) but they are much more important when the Bank is considering deploying direct controls.  In particular, the combination of tight investor finance restrictions in Auckland and the continuing overall residential mortgage “speed limit” is likely to skew house purchases in Auckland to cashed-up buyers.  In effect, to the extent that the restrictions “work” they will provide cheap entry levels.  New Zealand first home buyers and prospective small business owners will be disadvantaged, in favour of (for example) non-resident foreign owners.    At very least, it should be incumbent on the Bank to spell out the likely nature of these distributional effects.

Conclusion 

The restrictions proposed by the Reserve Bank do not pass the test of good policy.  The problem definition is inadequate, the supporting analysis is weak, and the alignment between the measures proposed and the statutory provisions that govern the use of the Bank’s regulatory powers is poor..

The Reserve Bank refuses to release the submissions it receives (unlike, say, parliamentary select committees) and instead published what it loosely describes as a “response to submissions”, together with a Regulatory Impact Assessment(RIA).   I had intended to comment in detail on these documents, but did not get round to it when they came out a few weeks ago, and won’t bore readers with that now.  Instead, lets take a higher level approach.

The RIA is barely five pages long, and two of those pages are largely devoted to three simple charts.  There is no attempt at a cost-benefit analysis, or to quantify any of the judgements. There is also little or no engagement with the relevant statutory provisions of the legislation the Reserve Bank operates under.

The response to submissions was 10 pages long, but most of this is devoted to operational details of the proposal, with only three pages given over to the policy issues themselves (is such a restriction an appropriate, and net beneficial, policy response to a real and substantive issue).  Although the document is described as a response to submissions, most of the points I included in my summary above are not even mentioned, let alone dealt with or responded to.  Since the Bank keeps submissions secret, it is only if submitters themselves choose to publish their own submissions that we can know what points are being made.  We should be able to count on a more honest reporting of the issues that have been raised (there were, after all, only 13 submissions).

The Bank may have a strong case for its position, but all it has done –  in the consultation document and response – is a piece of advocacy work.  It has made no sustained attempt to outline the strengths and the weaknesses of its case. There is, for example, no substantive discussion of the efficiency issues even though financial system efficiency is a key element in the statutory objective and LVR limits cannot but impair the efficiency of the system.  And there is no recognition, or consideration of the implications, of the fact that many countries have had rapid credit growth and high house prices, while avoiding a financial crisis.   It is simply poor science (in Feynman’s terms) and poor public policy.   And the points around the distributional effects of the policy are not even touched on.    Such selectivity speaks poorly of the Bank as a public policy agency.

I don’t want to idealise the Australian institutions, which (being comprised of human beings) have made their own misjudgements over the years.  But at present the quality of the material the RBA and APRA are putting out shows up the Reserve Bank of New Zealand in a particularly poor light.  New Zealanders deserve better from such a powerful institution, and from those who are paid to hold it to account.

Let’s hope they manage a better quality of argument and engagement in the Monetary Policy Statement tomorrow.

Economic performance since 1952 for Her Majesty’s realms and territories

Today Queen Elizabeth becomes the longest-reigning British monarch (as others have noted, she became New Zealand’s longest-reigning monarch a couple of years ago).

By 1952 a few places that had been British possessions or protectorates had already become independent (eg India, Pakistan, Israel, Ireland) but the extent of Her Majesty’s territories was still quite astonishingly large.  The Conference Board has GDP per capita numbers back to 1950 for a fairly large number of countries.  I found useable data for 24 countries (probably fewer than half the total) that in 1952 were either British possessions or (New Zealand, Australia, South Africa, and Canada) were independent but shared the Queen as head of state.

Here is how those countries have grown since 1952.  The green bars represent those countries in this sample which have the Queen as head of state today.

1952

In 1952, on this measure, New Zealand has (just narrowly) the highest GDP per capita of any of the three old dominions.  And although the point of this post is mostly whimsical, it is hard to go by without the sad picture of New Zealand’s deep and prolonged relative decline.

dominions

Closing the gap with Australia: only the OECD seems to think so

A friend asked me yesterday for the latest GDP per capita numbers for New Zealand and Australia.  His interest was a point estimate, to compare current levels in the two countries.  I went back to him with the series I would normally consider best for that purpose: the OECD’s measure of current price GDP per capita, converted to a common currency (usually USD) using the estimated purchasing power parity (PPP) exchange rates.  Unlike constant price measures, current price measures take full account of changes in the terms of trade –  which aren’t things governments can do much about, but which can materially affect living standards in countries like ours (in which the terms of trade are quite variable).

To my surprise, Australian per capita GDP on that measure was only about 22 per cent higher last year than New Zealand’s (= New Zealand’s being 18 per cent below Australia’s).   And if one believed that measure, the last few years had been just great for New Zealand (at least relative to Australia).  On this measure we’d long been drifting gradually further behind Australia, only to have experienced a startling reversal in the last few years.  It was as if that once-upon-a-time goal of catching Australia by 2025 was coming into view, all without actually doing any significant economic policy reforms.

gdp pc nz vs au

Of course, it was too good to be true.  But it prompted me to have a look at a variety of other measures of how the two countries have done since 2007 (just prior to the global recession).  I started with national data, calculated in local currencies, and deflated by domestic estimates of changes in prices.

Here is real GDP per capita for the two countries, where we’ve done a little worse than Australia.

national real GDP pc

And here is real GDP per hour worked, where the differences are quite extraordinarily large (and not in New Zealand’s favour).

national real GDP phw

Australia’s terms of trade rocketed up over 2010 and 2011, but have since fallen back very sharply. Over the full period since 2007, we’ve now done a little better than them, and foreign trade is a larger share of our economy that it is of Australia’s.

terms of trade since 07q4

And here are the two countries’ respective measures of real income, which take account of the effects of the terms of trade.  We are now just slightly ahead of them over that full period.

national rgndi

And what about the international databases?  The Conference Board has measures of real GDP per capita and real GDP per hour worked, converted to a common currency using PPP exchange rates.  They have much the same picture as the national data.

Here is real GDP per capita –  we’ve lagged further behind.

conf board real gdp pc

And real GDP per hour worked, where again the New Zealand numbers have been very poor.

conf board real gdp phw

And the OECD’s real (constant price) measures also show something similar.  Here they use 2005 PPP exchange rates.

oecd real gdp pc

oecd real gdp phw

So none of these national or international measures suggest anything particularly encouraging about New Zealand’s performance in recent years.  So far, our terms of trade have held up a bit better than Australia’s, but they are outside our control, and at best all that terms of trade strength has done is offset a lamentable productivity performance.  And most observers expect our terms of trade to fall further (as, of course, may Australia’s).

Which brings us back to the OECD’s current price estimates.  Here is how we are shown as having done relative to Australia since 2007.

current price gdp pc oecd

It looks too good to be true, and it is.

The OECD generates these numbers by converting national data into a common currency using estimated PPP exchange rates.  PPP exchange rates are, broadly, the exchange rates that would equalise price levels in the respective countries.  They can’t be directly observed and have to be estimated.  For established advanced countries you would not expect the PPP exchange rates to fluctuate much, and the biggest influence over time will often be any differences in inflation rates.  Thus, Australia has a slightly higher inflation target than New Zealand does, and Australia’s inflation rate has averaged a little higher than New Zealand’s over the inflation targeting period.  That should have been reflected in a very gradual, quite modest, rise in the NZD/AUD PPP exchange rate.

ppp nzd aud

And that is exactly what we saw until 2005.  But since then the OECD estimates that the exchange rate that would equalise prices in the two countries has risen by 15 per cent.  It simply doesn’t seem plausible – there has been nothing that structural in the two countries that could explain such a change in such a short period of time.  I’ve asked the New Zealand desk at the OECD if they have any idea what is going on, but in the meantime I will be steering very clear of the OECD’s current price estimates.

There is no one “right” international comparison of income/GDP levels. But whatever the “true” difference between Australia and New Zealand – perhaps 35-40 per cent – it remains large.  On some key measures – notably productivity estimates – it has continued to widen.  But then why would we be surprised?  If we keep on with much the same policies why would we expect much different outcomes?  New Zealand has been one of the least successful Western economies in recent decades –  indeed, probably for the last 100 years.  As I’ve highlighted previously, since 2007 many European countries have done extremely badly but even in that period, when floating exchange rate commodity exporters haven’t done as badly, we’ve not managed to make any progress in closing the large gap to Australia.

We can do better, and the failure to even start doing so reflects poorly on our political leaders and their senior official advisers, neither of whom seems to have a credible alternative strategy.

What New Zealanders thought of immigration and population issues

I got onto the New Zealand Election Survey when I was going through some old files and found a hard copy of a blog post Eric Crampton had run in 2011 on some earlier polling questions (including from previous NZES surveys) about immigration.  That prompted me to look up the 2014 survey to see if it had anything on immigration.

There is only a single question this time:

The number of immigrants allowed into New Zealand should be

Increased                                            10.7 per cent

About the same as now:                     37.4 per cent

Reduced                                              45.1 per cent

That seemed consistent with some other polling I’d seen.  Plenty of people seem to be happy with the current level of immigration, but a large number would prefer a lower level.

The 2011 survey, by contrast, had a variety of questions about population and immigration.  NZES uses many of the same respondents from survey to survey, and there was a very similar question to the 2014 question, producing very similar results.

Should the number of immigrants allowed into New Zealand be changed?

Increased                            13.1 per cent

Left about the same            34.1 per cent

Reduced                              44.5 per cent

But the 2011 survey also had four other questions about population and immigration.  The first was about the economy.

New Zealand needs more people to grow its economy

Agree                                    41.7 per cent

Neither/don’t know               26.1 per cent

Disagree                              29.2 per cent

The next was about skilled migration.

New Zealand needs to import more skilled workers

Agree                                  40.2 per cent

Neither/don’t know              18.3 per cent

Disagree                              38.3 per cent

Respondents were then asked about wider impacts

Immigration threatens the uniqueness of our culture and society

Agree                                   37.7 per cent

Neither/don’t know              21.3 per cent

Disagree                              37.8 per cent

And finally

A bigger New Zealand population would overstress our environment

Agree                                    55.4 per cent

Neither/don’t know               19.0 per cent

Disagree                              22.6 per cent

The first three 2011 questions seem broadly consistent.  People think that a rising population is good for the economy, and so don’t support (say) closing off immigration.  In fact, many think the current level of immigration is just fine.  The skilled worker question is potentially ambiguous –  do the people saying we need to import more skilled workers mean increasing the stock (which any immigration of skilled workers does) or increasing the flow (ie increasing the rate of skilled immigration beyond current levels)?

On the “uniqueness of our culture and society” question, opinion is evenly split.  In principle, and for some, losing “uniqueness” might be a good thing –  those emphasising the benefits of so-called “super-diversity” might have answered “agree” and still favour current or higher levels of immigration.

But, in some ways, the question I found most interesting was the environmental one, in which a huge majority think that a bigger New Zealand population would “overstress” our environmental.  Perhaps it is worded in a loaded way, but the margin is so large that can’t be the whole story.  It was a surprise to me –  personally I’m very fond of England’s green and pleasant land, even with 50m+ people.

Overall, there seems to be quite a tension among these respondents.  They believe a story that a larger population would be good for the economy, while worrying that it would “overstress” the environment.

The 2014 survey asked respondents about where they stand between protecting the environment and promoting economic development (thus skewing choices even in the way the question was posed).  22 per cent of respondents put themselves in the middle of the 7 step scale.  24.1 per cent leant towards “do more to encourage economic development” while 46.3 per cent leant towards “do more to protect the environment”.

Perhaps consistent with all this is the ambivalence about the current level of immigration.  A plurality want to reduce it somewhat, but perhaps mostly for environmental reasons.   A large proportion of people are comfortable enough at current levels, and a small proportion –  perhaps the strong believers in the potential gains (or libertarians simply focused on the likely benefits to the migrants  – favour a higher level of immigration.

There hasn’t been much of a public debate around immigration, but these sorts of results provide some small insights into what is shaping public attitudes to immigration.

Constitutional monarchs of economic policy

I don’t subscribe to the NBR but in their newsletter this morning I noticed one of the odder description of the role of Governor of the Reserve Bank I’ve ever seen.

 Paid content  •  Rob Hosking
RBNZ: Wheeler to cut, to advise, to encourage, and to warn
Mon 07 Sep

Central bank governors are kind of the constitutional monarchs of economic policy.

No monarch in New Zealand’s history has had anything like the power that Graeme Wheeler has (or that his two predecessors  had).  And unlike the powers and responsibilities of the monarch (or Governor General) the powers of the Governor have been increasing not diminishing.

The monarch has a handful of reserve powers, and other than that has only the responsibility to do good, to be seen, and to do as her ministers tell her.    As Bagehot put it 150 years ago, she has a right to advise, encourage, and warn ministers, but in private. It is not clear that there are any material cases in New Zealand’s history in which the monarch, or Governor General, has had any material influence on the choices made by governments and ministers.  And that is probably as it should be (he says as an instinctive monarchist).

Compare that to the position of the Governor of the Reserve Bank.  Like the Queen (or Governor General) he also holds a position established by Parliament, and is an unelected holder of that office.  He is not required to act on advice, and in fact the main argument for our current governance structure was to focus accountability –  the Governor, ultimately, can blame no one but himself for any mistakes that he makes.  We don’t hold the monarch, or the Governor General, responsible for whatever bad bits of legislation they sign over the years.

And what does the Governor get to decide:

  • He sets the short-term interest rate for New Zealand, and can do so in ways where, if he makes mistakes, we end up with inappropriately large booms or persistently high unemployment and recessions.
  • He gets to decide who can and can’t borrow money from our banks
  • He gets to decide the designs of the only lawful bank notes in the country
  • He has (legally unfettered) capacity to commit taxpayers’ money to speculate in foreign exchange or other financial markets.
  • He gets to decide who can operate as a bank, or non-bank deposit-taker, or insurer, in New Zealand.
  • And so on.

Oh, and he has some statutory duties that might be compared to “advise, encourage, warn”

Section 10 of the Reserve Bank Act says

10 Formulation and implementation of monetary policy

  • In formulating and implementing monetary policy the Bank shall—
    • (a) have regard to the efficiency and soundness of the financial system:
    • (b) consult with, and give advice to, the Government and such persons or organisations as the Bank considers can assist it to achieve and maintain the economic objective of monetary policy.

And section 33 says

33 Policy advice
• (1) On request by the Minister, the Bank must provide advice to the Minister on any matter specified in the request that is connected with the functions of the Bank.
(2) A request may not be made under subsection (1) that may limit the Bank in exercising its primary function in section 8.
(3) The Bank may also provide advice to the Minister, at any time, on any matters or subjects within the responsibility of the Bank.

Central bank Governors also prone to lecturing the public on how we should behave. Such advice is mostly harmless – since we can ignore it – and ineffective, although if done badly (as it often is, here and abroad – by Graeme Wheeler, Don Brash, or Alan Greenspan) it risks damaging the standing of the institution.

Some people will be quite happy with the powers the Governor of the Reserve Bank. But don’t pretend his powers are remotely comparable to those of the modern monarch.

Both the monarch and Governor of the Reserve Bank are unelected creatures of Parliament. One now has almost no power, and one has huge powers. It is the Governor’s powers that look anomalous in modern times. Reforms are needed, to markedly reduce the powers of the Reserve Bank as a whole, and to largely eliminate the ability of the Governor to make key policy decisions on his own. Few Governors in other countries have ever had as much power as Graeme Wheeler does.  No modern monarchs do.

More please (or “What New Zealanders think of public spending”)

The New Zealand Election Survey (NZES) has been running since 1990

NZES’s main source of data are questionnaires which are posted to randomly selected registered electors across the country immediately following each election.

Some of the questions stay the same but others reflect some mix of the issues of the day and researchers’ interests. There usually seem to be quite a range of economic and social policy questions.   They achieve quite a large sample (in the 2014 survey they had 2835 responses) and the reported responses are weighted to, as far as possible, reflect the demographic characteristics of the population (age, sex, race, qualifications and party support)..

I haven’t seen any media coverage of the results of the 2014 survey, but reading through the responses to the policy questions over the weekend I thought some were worth highlighting.

Perhaps the responses that most caught my eye were those around government spending.  These were the first set:

Should there be more or less public spending on:
More Same Less Net (more- less)
Health 66.8 26.7 1.6 65.2
Education 64.2 29 1.6 62.6
Housing 48.6 36.3 8.3 40.3
Police and law enforcement 42.8 45.3 5.2 37.6
Public Transport 41.8 43.3 7.5 34.3
Environment 40.2 45.4 6.5 33.7
Superannuation 31.8 55.4 5 26.8
Business and Industry 29.7 47.8 9.7 20
Defence 18.2 54.3 18.7 -0.5
Welfare benefits 15.4 41.6 24.6 -9.2
Unemployment benefits 12.4 38.6 40.5 -28.1

In most categories, more people favoured keeping expenditure at current levels than favoured either raising it or lowering it, but, equally, for most categories the net balance of respondents were much more in favour of raising public spending than of lowering it.  The only area in which respondents favoured cuts in public spending were “welfare benefits” and especially “unemployment benefits”  (while by similar margins they favour spending more on superannuation).

I was a little surprised.  There are areas where I would favour increased government spending (eg statistics and legal aid), but I’m pretty sure that if faced with this survey I’d not have answered “more” to any of these questions.

Despite the answer on superannuation, respondents narrowly favoured raising the NZS eligibility age to 67 (as they did when the same question was asked of an overlapping sample in 2011)

Agree Disagree
Raise NZS age to 67 between 2020 and 2033 42.2 38.3

That left me wondering why people wanted to increase public spending on superannuation.  Perhaps they want fewer people getting superannuation, but for each superannuitant to get more?  But as we have one of the lowest rates of poverty among the elderly of any OECD country that would be a surprising stance.  Perhaps it is just that people are more hard-headed faced with a more specific question?

The survey also had a few questions about whether some types of government spending is good or bad (ie not asking whether the current level should be raised or lowered).  I found those responses a bit eye-opening as well.

Should government give financial help to
Yes No
Companies for research and development 66.7 11.8
Companies to help them develop products for export markets 61.3 14.3
Sportspeople to allow them to compete internationally 56.6 19
Film makers to encourage filmmaking in NZ 50.7 18.6
Banks to help them in time of economic crisis 26.2 40.9

I’m not sure how I’d have answered the banks question –   there wasn’t an “it depends” option.  I’d like to think I’ve have answered “no”, but revealed preferences matter and in Treasury in 2008 I argued strongly for the use of guarantees and, on balance, still think that was the right advice.

In fairness to respondents, there are no questions in the survey about how they would propose that the country should pay for this spending.  The presence of a budget constraint – even a hypothetical one in a survey –  might have changed how some respondents answered.  But perhaps not by that much.

There was one tax question in the survey, in which respondents narrowly opposed a capital gains tax.  In principle the question was ambiguous  –  asked if we needed a “capital gains tax excluding the family home”, some respondents might have objected to the exclusion of the family home, but would have favoured a more textbook comprehensive CGT.  But I don’t suppose there were many such respondents.

Overall, I’m not quite sure what to make of the results.  One person I showed them to suggested that “ACT should read them and give up”.  They were suggestive of a New Zealand with attitudes perhaps not much different than similar surveys might have found 50 years ago.  There is quite a strong suspicion of (non-superannuation) welfare in these and other questions in the survey, but also a quite striking degree of belief in a role for a fairly large and active government.

Then again, for better or worse, although government spending in New Zealand is very large –  central and local government current spending totalled 37.1 per cent of GDP last year –  there were only three OECD countries where current government spending now accounts for a smaller share of GDP than in New Zealand.  And in all but a handful of countries the government spending share of GDP has risen somewhat over the last decade or so (as it has in New Zealand).  Korea is at the low end of this chart, with current government spending of 28.6 per cent of GDP last year, but as recently as 2002 that share was only 22.0 per cent.  Between rising government spending and the continuing encroachments of the regulatory state, whatever ails the world economy at present doesn’t look to have been an outbreak of small government.

gen govt spending

How well has Japan done since its asset markets crashed?

Gillian Tett’s column in the Financial Times yesterday was devoted to a cautionary note to the Chinese authorities to beware of following Japan’s example following the share market bust that took place after 1989.

There were many things the Japanese authorities could no doubt have done better after 1989, but I’ve long found it a bit surprising just how relatively well Japan has done over the last 25 years.  It isn’t a spectacular performance by any means, and Japan isn’t one of the top tier of OECD countries in terms of either GDP per capita or GDP per hour worked.  That shouldn’t be too surprising –  on most measures of institutional quality/deregulation, Japan tends not to score that well.  Microeconomic reform and liberalisation haven’t been a hallmark of Japanese economic management (see, for example, the TPP negotiations).

But looking at growth in GDP per hour worked for the OECD countries since 1989, Japan has been pretty much in the middle of the pack, with total growth (over 25 years) only about 2 per cent less than the median country.  New Zealand is 4th from the bottom on that measure.

Here is how Japan has done relative to the Anglo countries (and to Germany) since 1989, using OECD data.

GDP phw jap and anglos

This measure takes full account of the changing terms of trade.  Over the full period, Japan has done worse than three of these countries (the US, Australia, and Germany), and rather better than the other three (New Zealand, Canada, and the UK).  Over the last 15 years or so, Japan looks to have done a little less well, but that was well after the equity bubble burst.  It may well have to do with the surge in the terms of trade in the commodity-exporting countries from around 2003/04, matched by a severe decline in Japan’s terms of trade.

Another way to look how Japan has done is to look at growth in total factor productivity since 1989.  I’ve run this chart previously.  Over 25 years, Japan has been in the middle of the pack, a quite unremarkable performance (but materially better than New Zealand, Australia, Canada).

tfp since 89

Would, I trade New Zealand’s economic performance since 1989 for Japan’s?  The large Japanese government debt counts against that, but income/productivity are what pay the debt, and Japan has managed more productivity growth than we have.

Out of interest, here is how OECD countries rank in 2014 on this measure of GDP per hour worked, in current prices, converted to USD at PPP exchange rates.  For New Zealand, bear in mind that (a) 2014 saw the highest terms of trade for decades and (b) we were still ahead of Japan in 1989.  Oh, and Japan hasn’t had the advantage of New Zealand’s “critical economic enabler”, the large scale skills-focused immigration programme.

gdp phw 2014

Immigration: a “critical economic enabler” or a deeply-troubled programme?

MBIE (and the Minister of Immigration) believe that immigration is “a critical economic enabler” and, for example, that “immigration has been a driving force in the development of the country’s economy”.  Phrases like these, or that immigration is crucial for the success of the government’s Business Growth Agenda, pop up all the time in the papers MBIE released.  It is like a mantra they chant, even in face of their own evidence.

The papers repeatedly tell ministers that immigration is a “good thing”, serving not just economic ends but a whole variety of other goals.  And yet across all the papers there is hardly a shred of evidence advanced to support the belief –  for belief is all it seems to be – that, in the specific circumstances of New Zealand, as the New Zealand immigration system has actually been run over the last 25 years, that there have been any real economic gains for New Zealanders.

And yet, in parallel with the beliefs that appear to drive the system, the papers are full of details and observations which suggest that even officials recognise that actually the immigration system isn’t really working that well. Officials explicitly recognise that large proportions of the people we give permanent residence approvals to (eg lots of family approvals) can’t really be expected to add anything much economically, and many represent a significant net fiscal cost.  Officials note that a large proportion of skilled migrant category approvals are to former students in New Zealand, while observing that a large proportion of those have fairly low-level qualifications, and “we seem to have become less effective in retaining the skilled graduates we want”.  MBIE notes that “we are seeing a higher proportion of recent migrants (temporary and permanent) employed in industries with overall low or declining productivity.  In particular, we are seeing temporary migration increasingly becoming a structural feature of the workforce –  with certain sectors (eg dairy) increasingly relying on a ‘permanent pool’ of temporary migrant labour”.  I’ve noted previously the MBIE research suggesting that the investor visa approval show little sign of generating much investment in innovative or productivity-enhancing areas.  At the other end of the spectrum, MBIE observes “nearly a quarter of recent migrants are working in retail trade and accommodation and food services.  They are also likely to occupy a larger proportion of full time positions in these commonly part time industries.”

These issues have become increasingly more serious.  The fairly unskilled positions I highlighted yesterday have become a much larger share of residence visa approvals approvals of the last few years (MBIE included a chart in one of the papers, but it won’t reproduce well), and the number of Working Holiday visa approvals has more than doubled in the last decade (to around 55000 per annum now).  I had not previously paid much attention to these visas, granted under programmes that seem to have been more about foreign policy objectives (support for a Security Council seat?) than the economic interests of New Zealanders.  But MBIE themselves point out that whereas previously most working holiday makers were from wealthier countries, and often didn’t work for much of their time in New Zealand, many more are now from poorer countries (eg Latin American ones), who are working (rather than holidaying) for a much larger proportion of their time.

Here is a paragraph from one of the MBIE papers.

“As noted above, our current immigration settings have resulted in a reducing proportion of labour market-tested work visas.  In particular, we have seen a large growth in the number of people on Working Holidays.  Many of these people are relatively highly-skilled but take up relatively low skilled jobs in the agriculture, retail trade, and hospitality industries.  Given the ease with which these migrants can be employed and the skills they have, it would be unsurprising if employers preferred them to unskilled or otherwise less attractive local workers”.

Officials blithely talk of these visas serving “tourism and foreign policy objectives”, but at whose cost?  Isn’t it rather likely that the influx of unskilled workers, or temporary workers doing unskilled jobs, is driving down the relative real wages that these unskilled positions in New Zealand can command?  It is a controversial issue in the international immigration literature, but my reading of that literature suggests that in general the effect is real. In the specifics of New Zealand over the last decade, it seems quite likely that it is true here.  The effect may well be concentrated in some particular industries.  MBIE mention retail trade and hospitality/accommodation, but I suspect it also has real relevance in the aged-care sector.  One of the unions has been pursuing a dubious pay-equity case (“dubious” in that I think all such cases are largely meaningless, and probably should be disallowed by statute) in that sector, but it seems much more plausible to me that the huge number of visas given to people working in relatively unskilled positions in that sector will explain part of why wage rates in the sector remain very low.  As the government bears a huge proportion of the cost of aged care, this is a direct transfer from relatively unskilled New Zealand workers to the government.

Here are a couple of statistics.  Over the last decade (to 2013/14), there has been an average of 44900 residence visa approvals each year (just a touch under the target level of 45000 to 50000 per annum).  Of those, only an average of 11600 (or 26 per cent) have been for primary applicants for a visa under the Skilled Migrant or Investor categories.  In other words, only a quarter of the permanent migrants we’ve allowed in have been subject to a labour market test at all.   That doesn’t sound particularly high, but it gets worse.  Recall that, as we saw yesterday, at least 20 per cent of such approvals are for jobs that don’t seem particularly skilled at all, and many of the former students who get residence visas have quite low level qualifications.  There is no sign that New Zealand is short of people with certificates/diplomas or even bachelors’ degree (indeed, the empirical evidence is pretty clear that the returns to education here are among the lowest in the advanced world, suggesting a relative glut rather than a shortage that we need to remedy by immigration).  Of the primary applicants who were former New Zealand students, over the last decade an average of 318 per annum had honours, masters, or doctoral degrees.  Probably no one would quibble too much with allowing these people residence if they wish to stay, but that is a pretty small proportion of the overall permanent migrant inflow.

It isn’t very plausible that such a small group of genuinely highly-skilled migrants –  perhaps not many more than 5000 per annum – will have the sort of transformative capacity that officials and governments appear to have been hoping for.  And in that sense therefore it isn’t very surprising that we’ve seen no hard evidence of the economic gains to New Zealanders from immigration that keep being touted. Even if the theoretical model of potential gains from immigration were valid for highly-skilled workers, it is hard to expect to see much real empirical gain when 80 per cent or more of the permanent migrants actually simply aren’t that skilled (and in many cases, aren’t even in the workforce), and when there has been a rapidly growing revolving stock of temporary workers mostly doing pretty unskilled jobs.

And, actually, the Minister and MBIE appear to recognise a problem.  There is a review of the residence programme taking place at present, which is due to report to Cabinet in November.  It is surprising that the media has not paid more attention to this review.  On the papers released to me, much of the material is withheld (and it wasn’t what I was after anyway, as when I lodged the request I hadn’t even been aware the review was going on), but the material that was released –  in papers only a few months old –  is full of talk about reorienting the programme to better maximise the potential economic contribution from the immigration programme.   Here are some extracts from a May 2015 paper from Michael Woodhouse to Cabinet’s Economic Growth and Infrastructure Committee.

We already apply a strong focus on the contribution migration can make to economic growth but I believe more can be done. I propose a programme of work to improve:

  • The contribution of migration to the labour market
  • …..
  • The attraction, selection and integration of the investors and entrepreneurs who will help our economy to grow, and to become more innovative and productive
  • …..
  • The openness of the immigration system to better facilitate the entry of people that contribute to economic growth, whilst more efficiently managing risk.

To maximise the economic contribution of immigration a more strategic approach is needed.

I propose a more strategic approach on when, where, and how to use the immigration system, focusing more deliberately on its contribution to the Government’s wider long-run economic growth agenda.

We have already started using this approach to respond to immediate pressures and opportunities, such as demand for labour in the tourism industry in Queenstown, ICT skills shortages, and the targeting of high-value investor and entrepreneur networks.

Adopting a more strategic approach does not mean that we will place less emphasis on objectives such as family reunification or refugee settlement, but it will mean that policies designed to achieve these objectives will be considered with a more deliberate focus on long-term economic growth.

I intend to also instruct officials to consider the extent to which our immigration settings should target certain industries and regions.  For example, we provide some incentives to encourage migrants to settle outside of Auckland…but we can investigate other ways to encourage migrants to settle more evenly across New Zealand.

At one level it sounds good.  If immigration is to be a key economic lever or “critical enabler” it would be good to actually maximise the chances of that happening.  But the signs are not particularly promising.  We’ve already seen the new policy giving many more points to people with job offers outside Auckland.  As I’ve noted previously, to the extent that it works at all it must, almost by definition, actually lower the average quality of the “skilled” migrants we allow in.  One other aspect of that same package was providing a pathway to residence for people in low-skilled occupations who had been here for several years on work visas.  It might be charitable to think about doing so, but it doesn’t have the ring of a ruthlessly skills-focused policy.

But perhaps my bigger concern is the tone that pervades these documents, and Cabinet papers for a minister in a centre-right government, that officials and ministers think they can pick which sectors, firms and regions to favour.  The central planning tone is strong, and there is no sign of any evidence that officials and ministers know what they are doing, and can expect to produce the right outcomes.  Much of MBIE’s focus appears to be on meeting specific skill shortages –  a flavour redolent of the 1960s.  Never (I’m pretty sure) in any of the papers do ministers and officials stand back and ask how the market deals with shortages.  The usual response is higher prices, not quantitative government interventions.

And never once do the papers recognise that in the short-term the demand effects of increased immigration outweigh the supply effects.  That is not just some weird Reddell proposition, it is the standard result that all macro forecasters and analysts (and economic historians) in New Zealand have recognised for decades.  Outfits like the Reserve Bank don’t have a dog in the fight about whether immigration is good or bad in the longer-term, but their research has consistently found, and their forecasts have consistently assumed, that when immigration increases, all else equal, inflationary pressures increase.    The most recent piece of published research in this area is only a couple of years old.

What that means is that increased immigration does not ease overall labour shortages.  In a particular sector immigrants might ease stresses and keep pressures off relative wages for jobs in that sector (aged care workers etc), but in aggregate, immigrants add more to demand than they do to supply in the short-term (a short-term that lasts several years, and each year we have a new large wave or permanent or temporary migrants) and so increased immigration actually exacerbates any net shortages of labour (which is why, all else equal, increased immigration is typically followed by increases in the OCR).

As I said, these issues have been discussed in the New Zealand literature for a long time.  Sir Frank Holmes was, in his day, one of the New Zealand’s most eminent economists, straddling the boundaries between academe and public policy (and the private sector) in ways rarely seen today.   In 1966 and 1967, when he was Macarthy Professor of Economics at Victoria, he wrote a series of substantial articles for the NZIER on immigration.  In some respects they are specific to their time, but they still repay reading.  Since coming across them a few years ago, perhaps my favourite quote from them is this

“Give me control of the Government and the Reserve Bank and I can create a labour shortage for you very easily…The resultant boost in demand for goods and services would soon have employers competing vigorously with one another for more workers to help them meet it. If we had started  with full employment, we should soon have plenty of vacancies, money wages and prices would rise, and there would be a splendid rise in demand for imports. I think that you might agree that the best cure for that problem might be not more immigration but my replacement by a politician with less generous impulses towards the community.  I hope that you will also agree with me that our experience in New Zealand indicates that a big increase in the supply of labour does not necessarily cure labour shortages and certainly does not cure balance of payments problems”.

Persistent shortages across the economy as a whole are usually a sign of too loose a monetary policy (the story in New Zealand in the 00s –  and in the much of the 1960s for that matter).  Persistent “shortages” in particular sectors are usually a sign that real wages for jobs in that sector should be rising.  The central planners at MBIE seem to have a problem with that, or to have barely considered it as a solution.

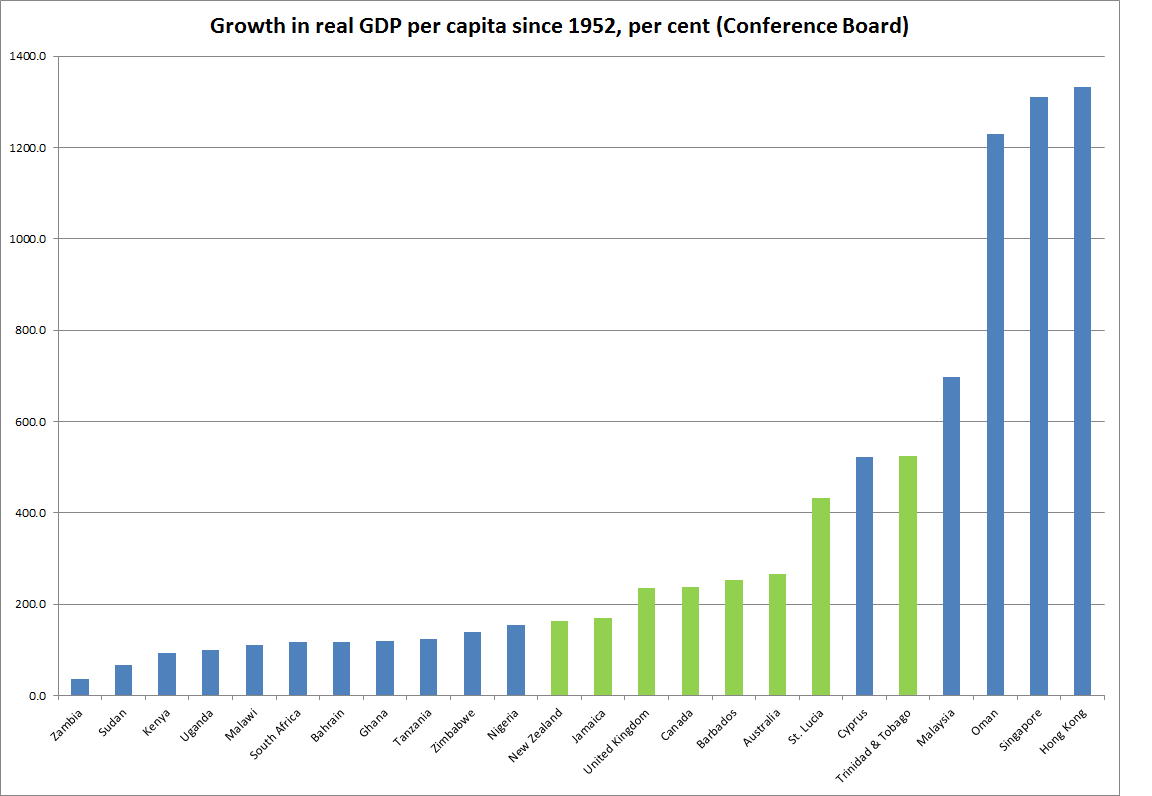
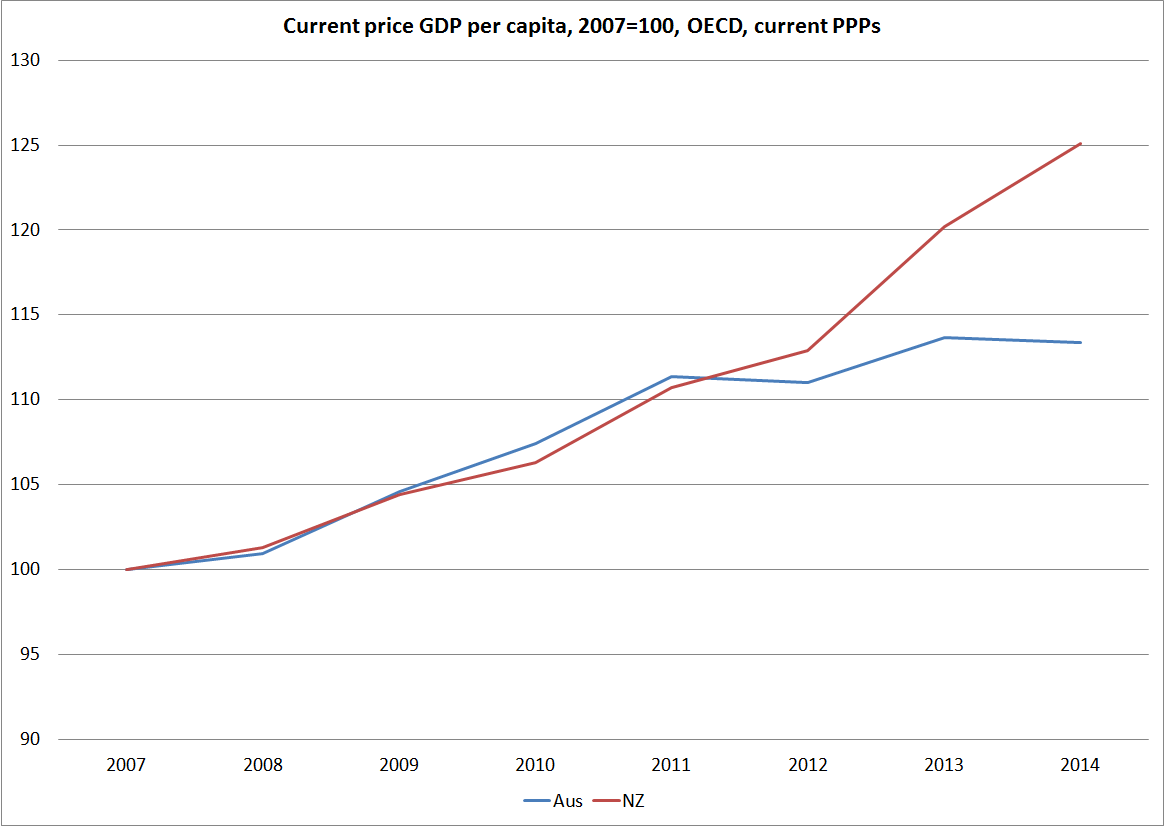
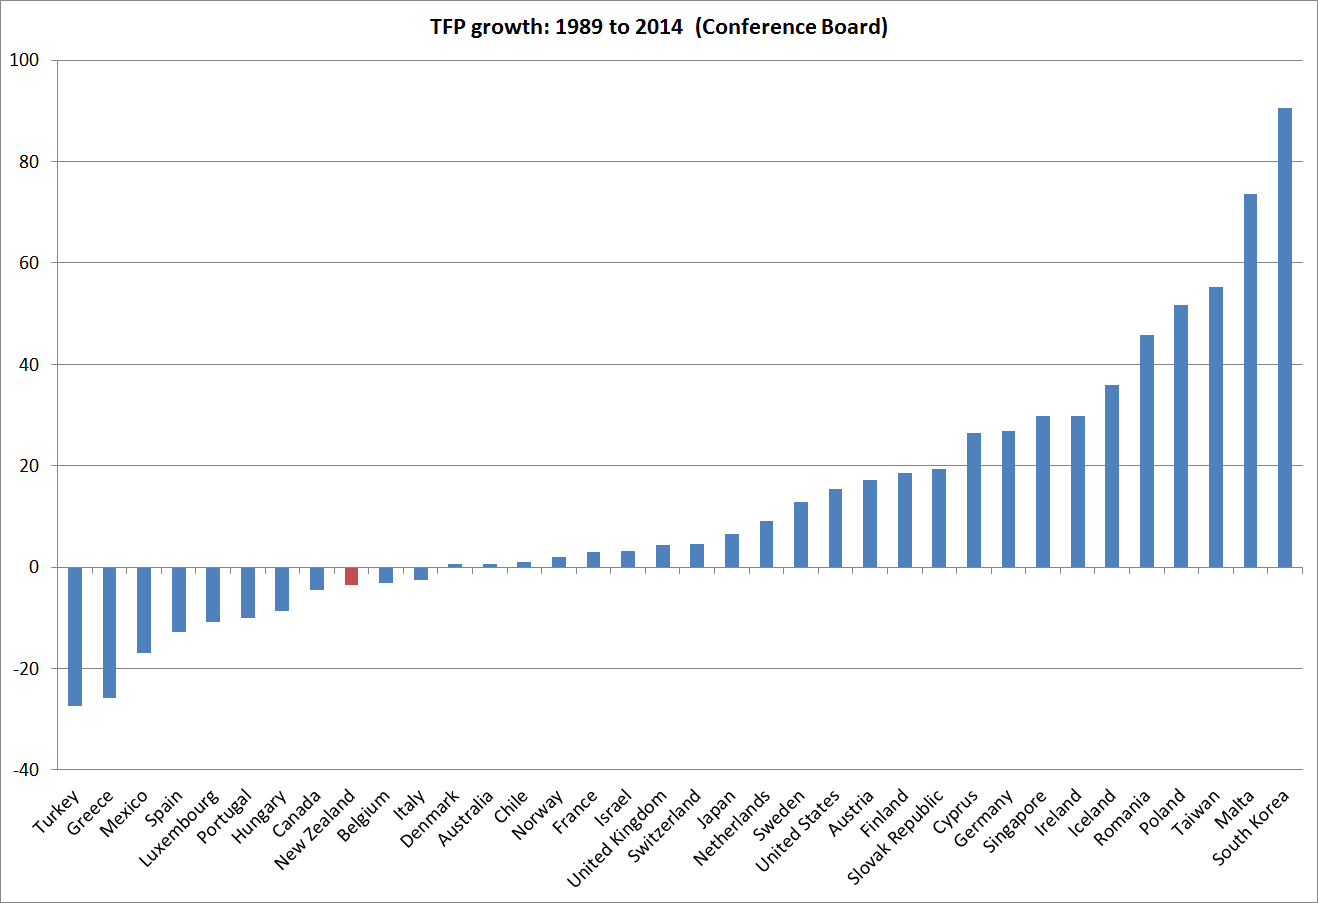
There is an old line about the definition of insanity being doing the same thing over and over again and expecting a different result.  We’ve had one of the advanced world’s largest immigration programmes –  almost entirely under government control, since we have total control of our borders  – for 25 years, and have little or nothing positive to show for it.  We’ve had among the worst productivity growth of any advanced economy in that period, and persistent excess demand pressures reflected in the highest real interest rates in the advanced world, and a persistently overvalued real exchange rate.  What gives people any confidence that things are likely to be any better in future?

If the Cabinet is serious about a strategic review, and about maximising New Zealanders’ long-term prosperity by capturing any long-term economic benefits from immigration, I think they need to put a lot more material into the mix, including asking hard questions about why we haven’t seen obvious gains from the large and longrunning programme to date.  I’d suggest going back to the drawing board.  A helpful input in that context would be a Productivity Commission review, as they are (again) doing in Australia at present.