I’ve been reading a wave of books in the last few weeks about modern Japan – the rapid economic rise from the mid 19th century, the out of control militarism that led to the war from 1937 to 1945, and the post-war revival (rather than the last few decades). And as I read, it left me pondering the relative economic fortunes of Japan and China.
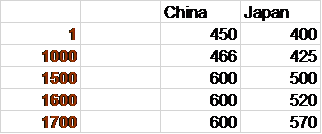
According to the standard reference source for such things – Angus Maddison’s collection of estimates of GDP per capita since the year 1 AD – in earlier centuries Japan and China were more or less level-pegging for centuries, with China a bit ahead of Japan (a thousand years ago, China is generally accepted as having the highest material living standards anywhere). Here are the estimates (in 1990 international dollars) through to the 18th century.
There was, of course, a great divergence between economic progress and living standards in the leading European (and offshoots) economies and those of east Asia, but today I’m more interested in the less-highlighted, but scarcely less dramatic, divergence between economic performance in Japan and that in China.
Maddison’s estimates report that – despite having turned its back on the world – Japan had moved ahead of China over the 18th century and the first half of the 19th century: for 1850 the reported estimates are Japan $679 and China $650. There are only scattered estimates for China for the following few decades, but here is the reported estimate of average per capita real GDP per capita, China as a per cent of Japan.
| China GDP pc as % of Japan | |
| 1850 | 88 |
| 1870 | 72 |
| 1890 | 53 |
| 1900 | 46 |
| 1913 | 40 |
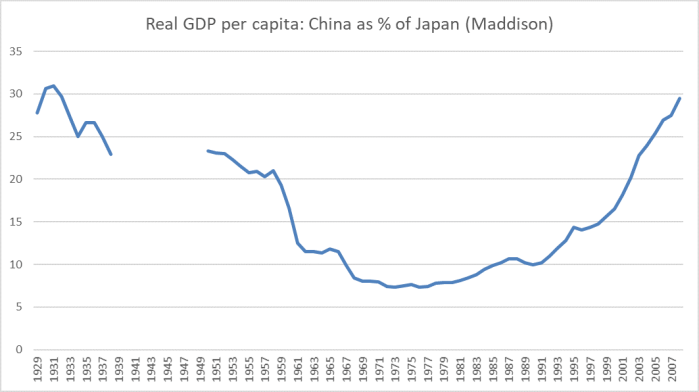
A bit later, the annual estimates start – with a break when Japan was attempting to conquer China. Here is the chart to 2008 when Maddison’s estimates end.
The Conference Board has estimates through to the present day, but they only start from 1950. Here is the PRC’s real GDP per capita as a percentage of Japan’s.
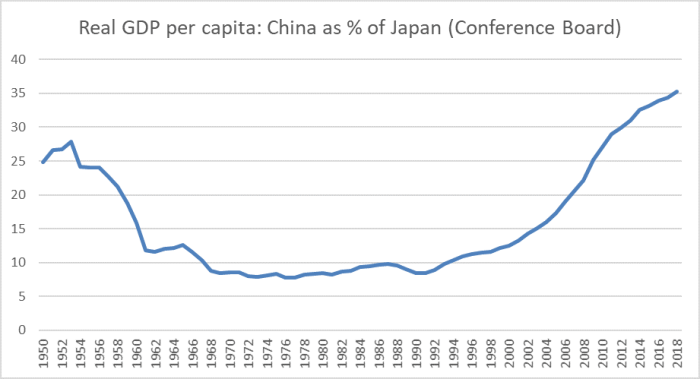
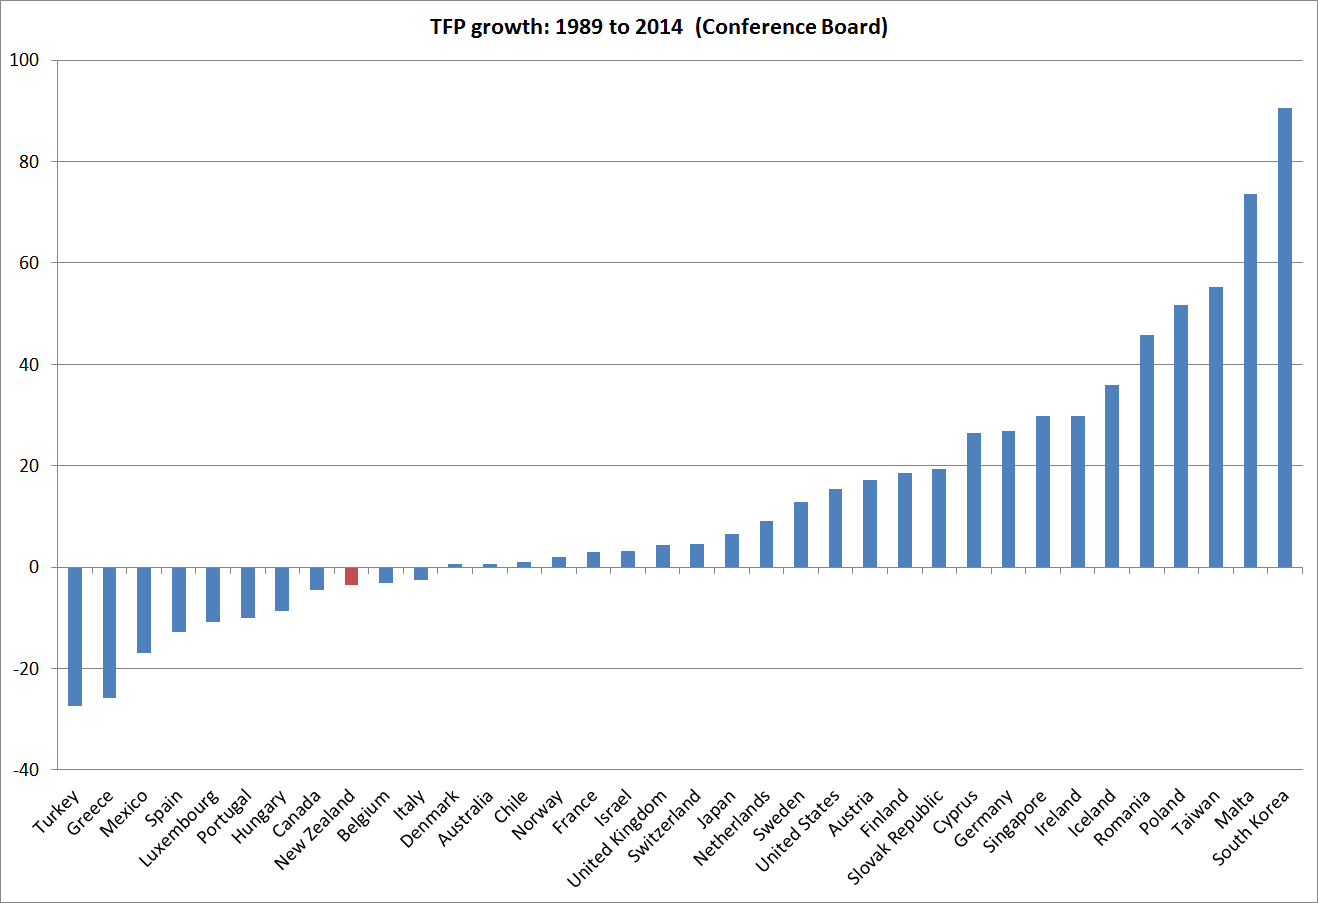
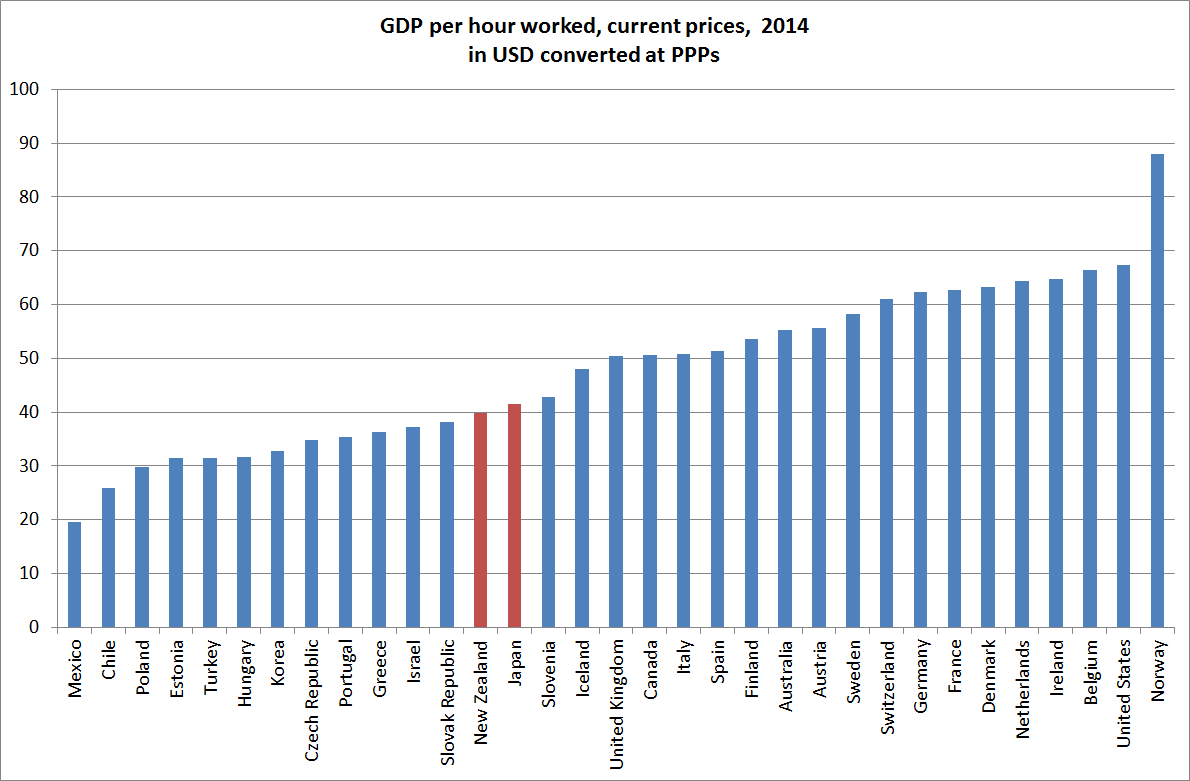
Productivity estimates are available only for even more recent periods, but on Conference Board numbers they show a pretty similar picture: as at last year, average productivity in the PRC just over 30 per cent of that in Japan. And that is still probably worse than the situation at the turn of the last century (when – see above – China’s real GDP per capita was about 45 per cent of Japan’s).
Of course, it isn’t only Japan that China has fallen so far behind. Taiwan was a Japanese territory for 50 years after the Sino-Japanese War in the 1890s, and Korea was a Japanese colony/conquest for 40 years. On the Maddison estimates, 150 years ago both Korea and Taiwan had GDP per capita (estimated at) not much different from that of China. These days, South Korea (historically less well-developed than the north) has real GDP per capita about 10 per cent less than that of Japan, while Taiwan has real GDP per capita about 15 per cent more than that of Japan. Both, in other words, are far ahead of the PRC.
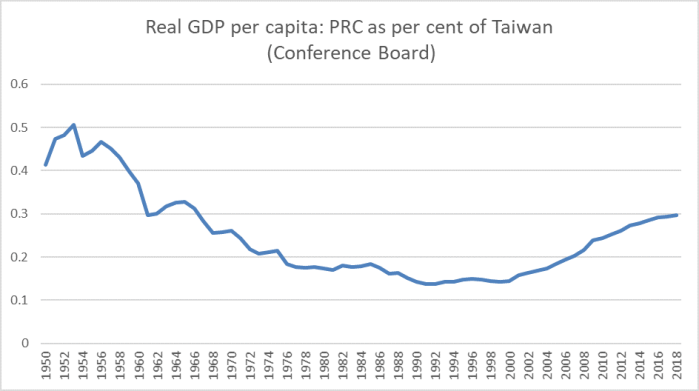
Relative to Taiwan, the PRC has just now managed to get back up to the relative living standards just prior to the Cultural Revolution. (And yet this is the regime whose “successes” Simon Bridges lauds.)
There isn’t really much debate about why the PRC has over recent decades still been the disastrous laggard among the historically more advanced east Asian economies (North Korea of course marking out an even worse extreme) – absence of the rule of law, absence of the sorts of incentives that make for the efficient allocation of capital, primacy of the Party etc etc will do that to a country (the Soviet Union in the 80s was closer in living standards to Japan then than the PRC is to Japan now).
But in some ways I’m more interested in how the gaps opened up in the first place – before 1950, or even before the overthrow of the Manchu emperors in 1911. It is easy to say that Japan embraced greater openness, Western technology etc – initially under external pressure – but what was it that meant Japan (having, if anything, been more isolated than China for the previous few centuries) made that choice and China did not? In looking around, I’ve found a couple of relevant journal articles, but if any readers happen to have suggestions of good treatments of the issue (book or article) I would really welcome them.