Real economic costs of financial crises – Part 2

I did a post a couple of weeks ago suggesting that some of the talk about the long-term real economic costs of financial crises had been exaggerated.  My example was US growth over 150 years or so, in which the trends seemed largely undisturbed by the numerous financial crises.  It makes a lot of sense that, disruptive as severe recessions can be in the short-term, the long-term economic prosperity of nations is not much affected by financial crises.  Growing prosperity is primarily about innovation, in all its dimensions (new technologies, new ways of using them etc), and it isn’t overly plausible that a financial crisis could make that much difference in the medium-term.

The previous Reserve Bank of New Zealand Governor Alan Bollard made this point in a speech he gave in 2012, just before the end of his term (He graciously listed me as co-author, but it was his speech).

dealing with debt

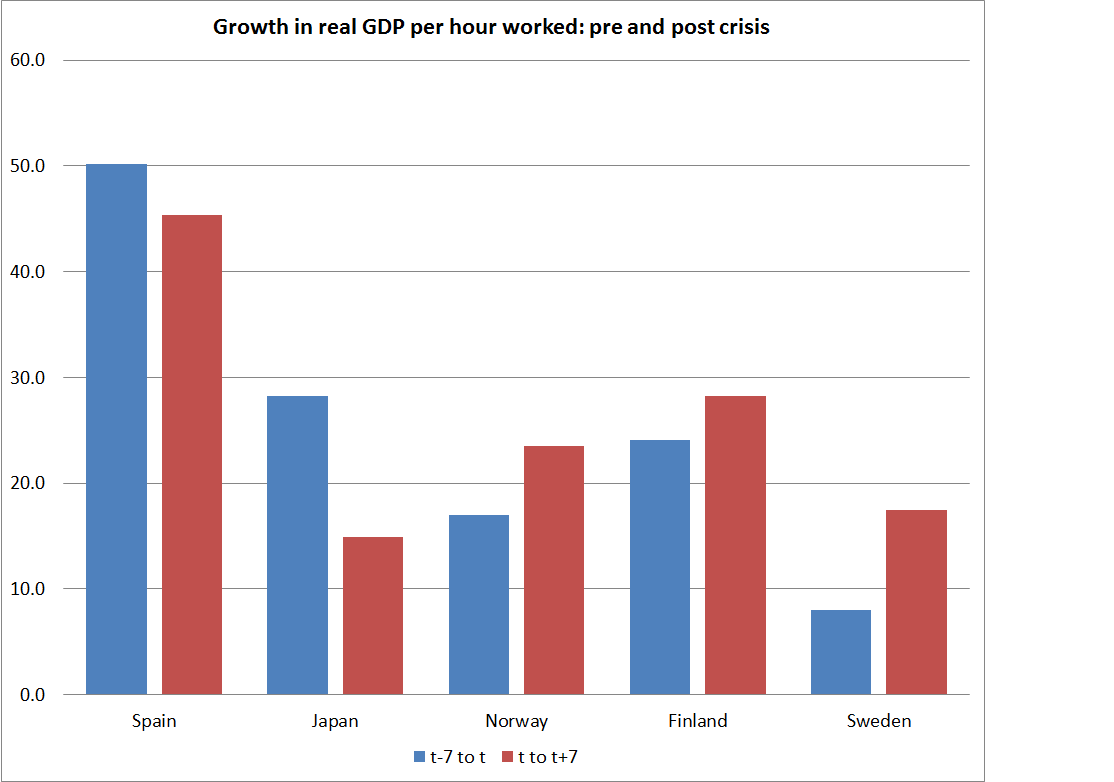
Prior to 2008, the classic post-war systemic financial crises in advanced countries were in Spain, Japan, and the three Nordics (Norway, Finland, and Sweden).  Reinhart and Rogoff label them the “big 5”.   Since it was close to home, I’ve also had a look at New Zealand’s experience with the crisis of the late 1980s (for offshore readers, this saw – inter alia  –  a collapse in the share market, numerous major corporate collapses, the failure of a major investment bank, and the near-collapse (twice recapitalised) of the government-owned largest commercial bank) and at the Korean crisis of 1997/98.

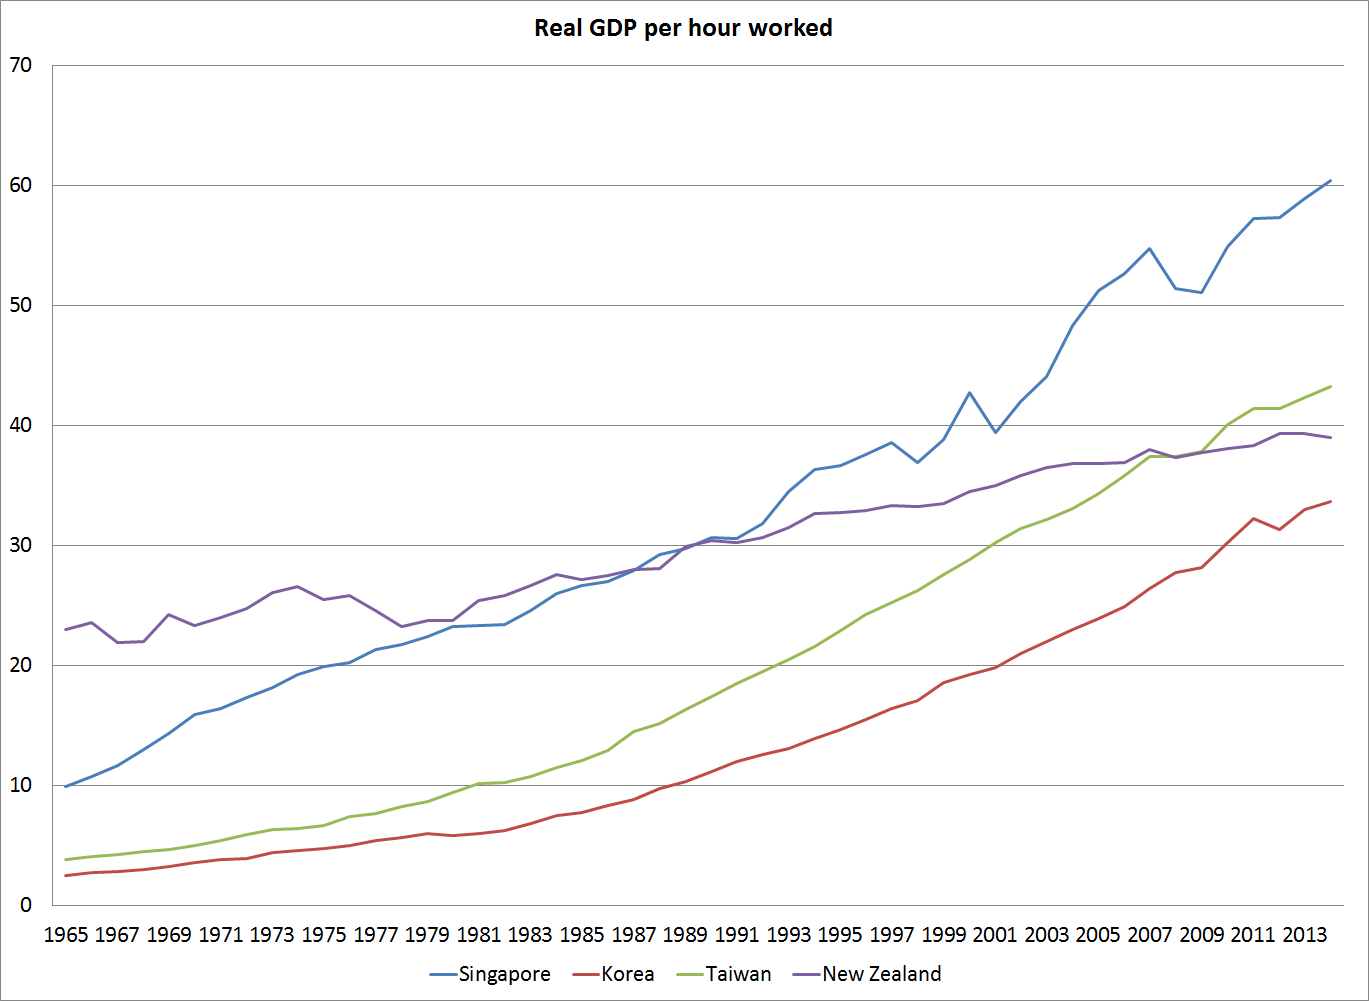
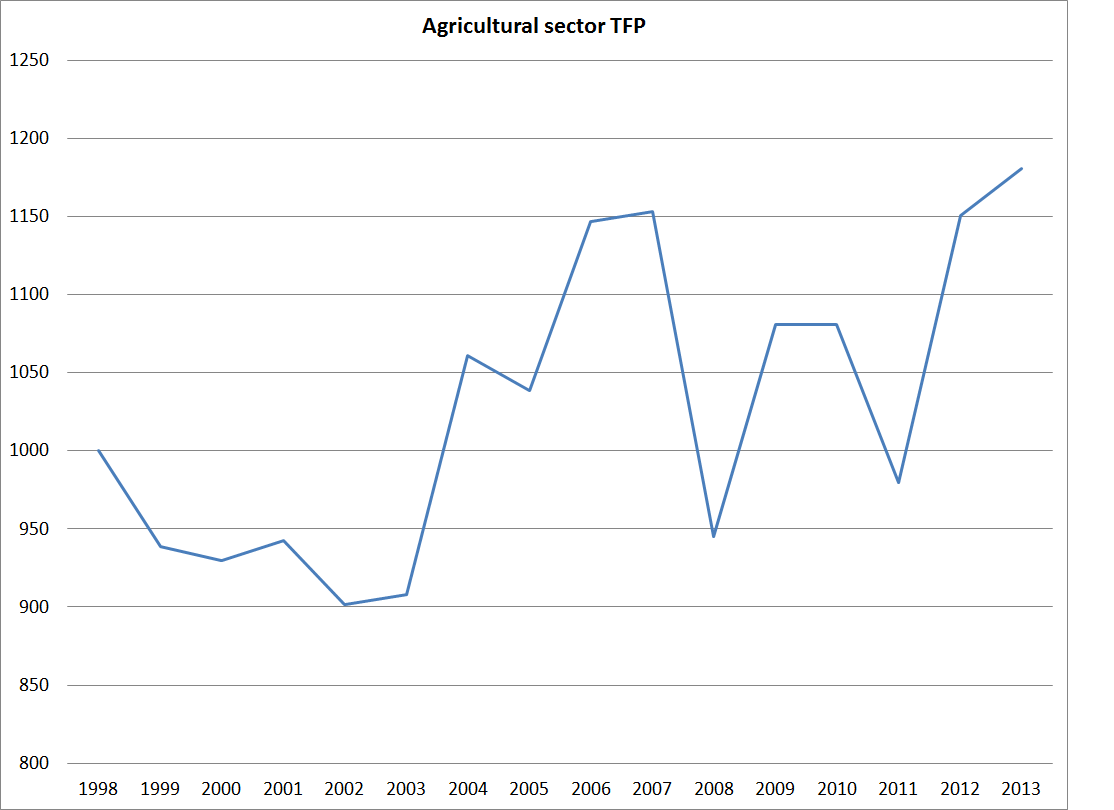
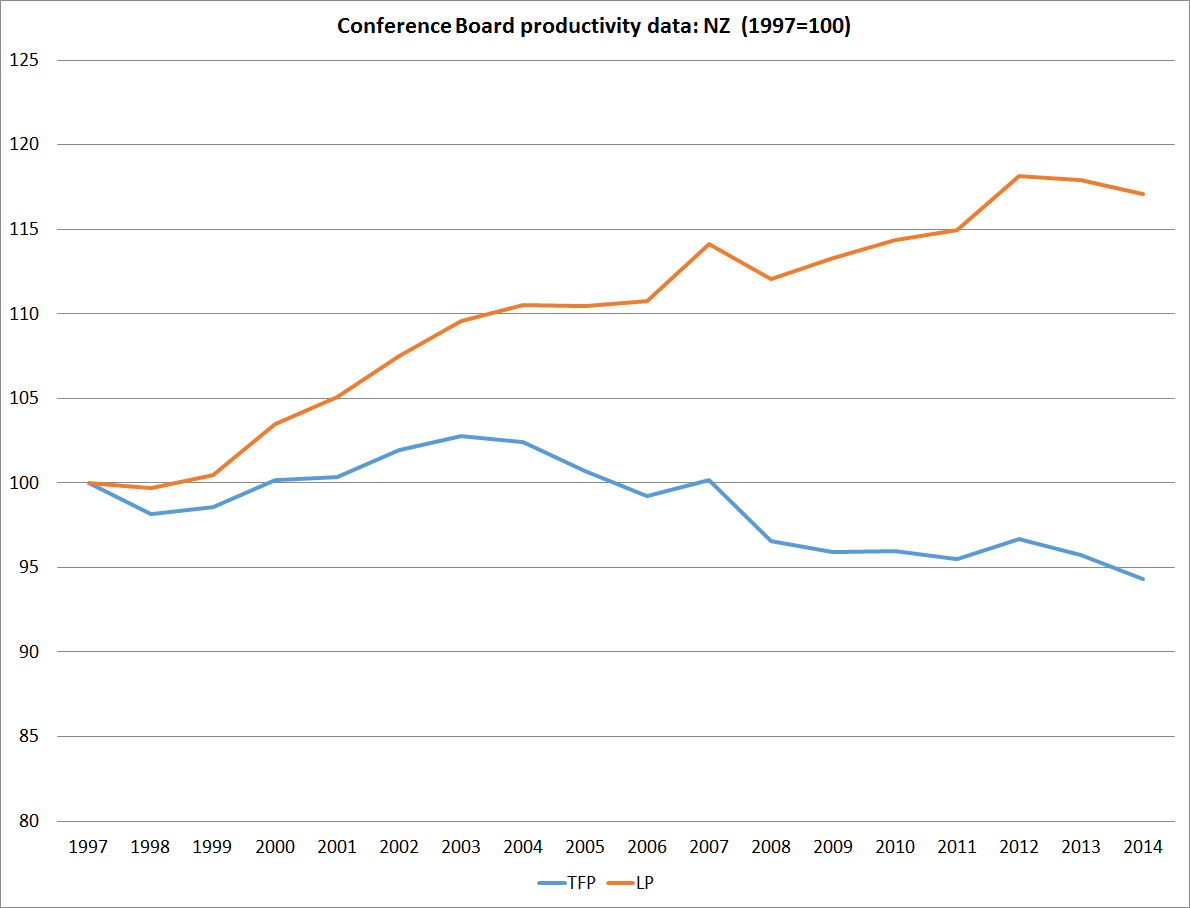
Ideally, one might look at TFP data, but it is not available, consistently compiled, for most of these countries in these periods around crises.  So I had a look at labour productivity –  real GDP per hour worked, drawing from the Conference Board’s database.  I was curious how growth in the years after a crisis compared with that in the years leading up to the crisis.  In this case, I looked at data for seven years each side of the crisis date.

Crisis dating is itself an imprecise business.  For the big 5, I’ve used Reinhart and Rogoff’s dating, and for Korea I’ve used 1997.  Dating the New Zealand crisis isn’t easy.  I’ve used 1989, which was the year in which several major failures occurred.  I could have used 1987, which is when the share market collapsed, never really recovering.   I’m not suggesting anything very definitive can be drawn from the comparisons, and there is always a great deal else going on in any economy (at times, structural reforms might be an endogenous response to the crisis, or –  as in New Zealand –  structural reforms had been going on in parallel.

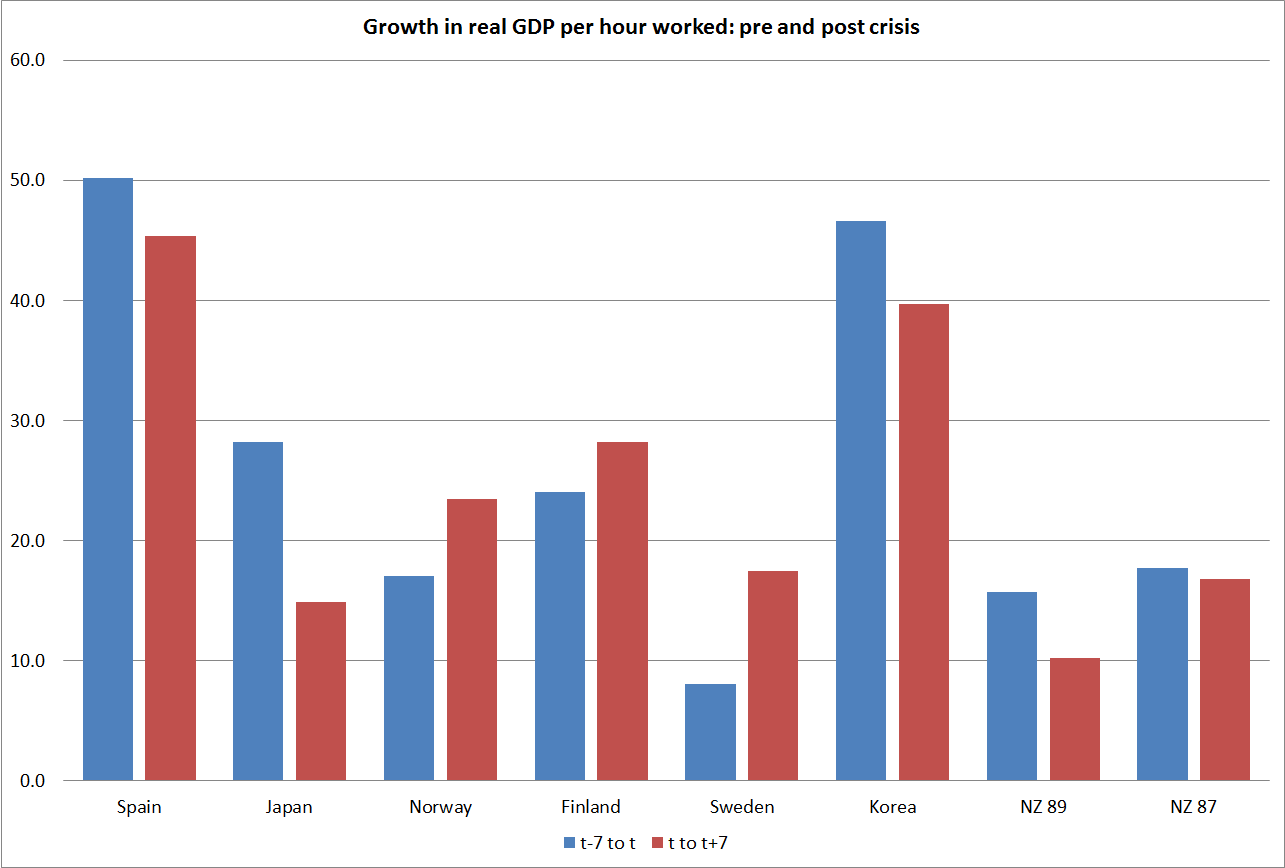
Here are the results for the big 5 financial crises.  In three of the five countries, productivity growth was faster in the years following the crises than in the years prior to the crisis.

big 5

And here is what the picture looks like if we add in New Zealand (with 2 possible datings –  1989 is my preference) and Korea.  These examples balance up the illustrative sample, but they hardly provide a clear-cut illustration of the idea that financial crises cause permanent costs.

big 5 +

What of the most recent period?  If we date financial crises to 2008 (which seems reasonable), there is only six years of annual data since the crisis, and those data are still likely to be subject to considerable revision.  But for what it is worth, if we multiply productivity growth since 2008 by 7/6, here is what a chart of pre and post 2008 productivity growth looks like for the US, Ireland, the UK, and for New Zealand, Australia, Canada.  No one would dispute the US and Ireland had systemic financial crises rooted in problems in their own countries.  My reading of the UK is somewhere in the middle –  several of its major banks failed and were bailed out, but in considerable part based on offshore exposures.  New Zealand, Australia, and Canada did not experience systemic financial crises.

post 2008

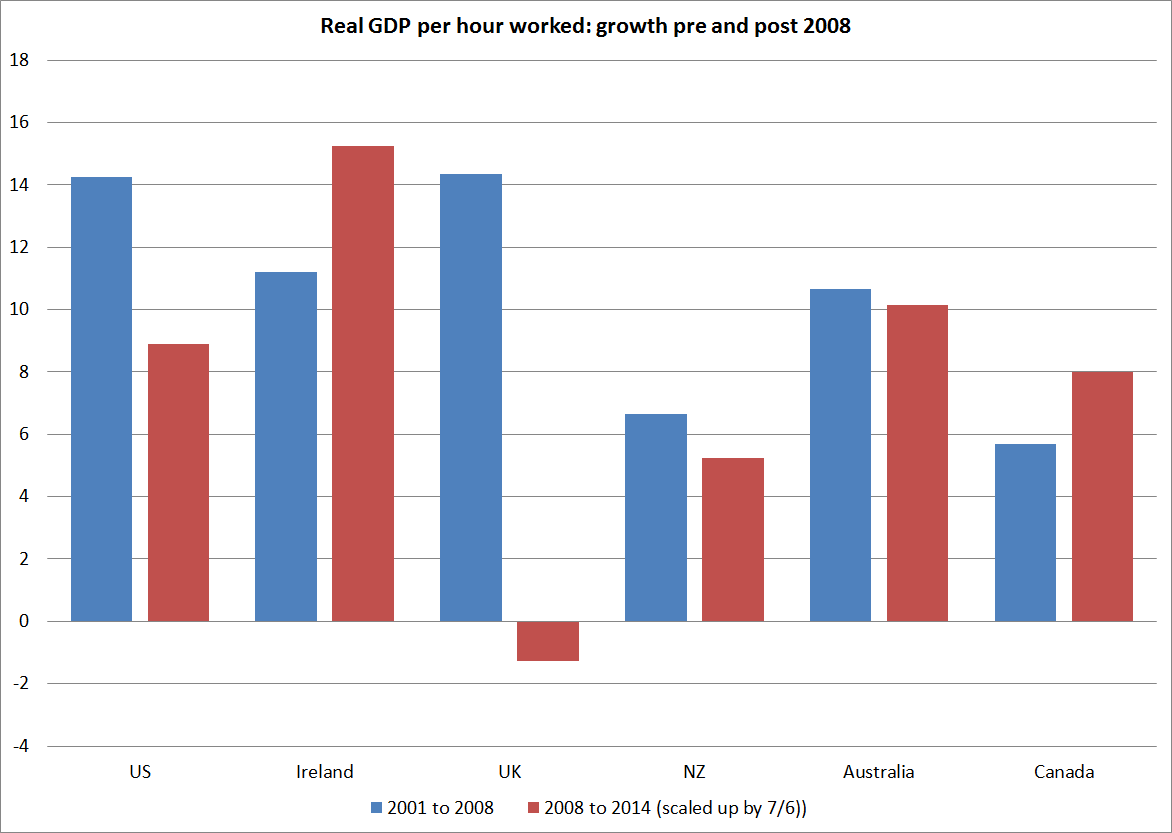
Across advanced countries as a group, labour productivity growth in recent years has been slower than it was in previous years.  But as I’ve discussed previously, this isn’t restricted to (or focused among) countries that have had financial crises.  Indeed, the Irish crisis was probably the most severe of any of those in OECD countries, and yet Ireland has reported faster labour productivity growth since 2008 than in the seven years prior to it.

Misallocation of resources that leads to eventual recessions and financial crises come at a cost.  With the exception of Japan, each of the crisis countries (pre 2008 and 2008) had nasty recessions associated with their crisis.  But to what extent the severity of the recessions was caused by the crises, as distinct from the severe initial misallocation of credit and possibly of real resources, is an open question.  And in Japan, and in the post 2008 experience, the role of demand shortfalls (resulting from combination of the near-zero lower bound, and fiscal constraints) is also likely to be very relevant in many countries.

We should be hesitant about concluding the financial crises have material long-term economic costs.  If they don’t, the case –  embraced by regulators, whose incentives might be somewhat skewed – for more extensive and intrusive financial regulation is materially weakened.  Indeed, if the crises might have been caused in large part by policy choices, we want to be even more wary of handing additional powers to regulatory agencies of the same state whose actions/choices caused the problems in the first place.  The role of active or passive policy choices in creating conditions that drove down lending standards in the recent Irish and US cases is pretty clear, but policy also played a key part in many of the 1980s crises (fixed exchange rates in the Nordic countries, and the difficult transition from hitherto excessively regulated banks and financial markets in the Nordics and in New Zealand).

Never send to know not for whom the bell tolls

A remarkably decisive vote coming in now from Greece.  I’m school holiday bonding with my son, watching CNBC’s coverage (Steve Keen and all).  No one can say with any confidence how things unfold from here.  No doubt, establishment leaders in other vulnerable countries  desperately don’t want the Greeks to leave the euro, but those in other countries might be glad to be rid of them.  No doubt, the ECB won’t want to find itself as the agent who finally determines whether or not the first brick is removed from the wall.  No doubt, Greek opinion is still reluctant to face up to leaving.  But further default is surely coming very soon.  And the banks must re-open eventually and even if there is more ELA support, who would sensibly leave more than transactions balances in a Greek bank account.  It is very hard not to see Grexit happening some time very soon.  And that is unlikely to be the end of it.  Yes, the ECB and national authorities can ensure adequate liquidity buffers for banks in other countries for the time being.  But central banks can do nothing about the tide of public opinion, which –  in the north and the south –  seems increasingly unsure about just what good the euro is doing.

In reflecting on Greece and the wider edifice of the euro, John Donne’s 17th century words spring to mind.

No man is an island,
Entire of itself,
Every man is a piece of the continent,
A part of the main.
If a clod be washed away by the sea,
Europe is the less.
As well as if a promontory were.
As well as if a manor of thy friend’s
Or of thine own were:
Any man’s death diminishes me,
Because I am involved in mankind,
And therefore never send to know for whom the bell tolls;
It tolls for thee.

Towards a new Policy Targets Agreement

The Reserve Bank continues to obstruct, at least as far as they legally can, Official Information Act requests. Some time ago, I recounted my experience with a request I lodged for older papers I had written while at the Bank. To cut the story short, I eventually did get the handful of papers I had written in the second half of 2010, with the exception of one which they had missed going through their document management system. So I put in a specific request for that paper. It was a paper, for the Bank’s internal Monetary Policy Committee, which I had written on fiscal and monetary policy interactions in 1990/91. To be clear, this is a five year old paper, about events that are now almost 25 years old. As it happened, the paper had been prompted by a meeting Graeme Wheeler, then still a private citizen working at the World Bank, had had with the Prime Minister and the Minister of Finance, but my paper was about the historical events and interactions. It drew from public documents, my contemporary Bank files, and my personal diaries. Doing the paper was an interesting reminder of the tensions in that period, and of just how difficult the political environment was, both for reforming ministers and for the Bank. Treasury officials on occasion exerted pressure on the Bank to ease policy specifically to assist the political position of the Minister of Finance.

It was no real surprise that this week the Bank once again extended the time for dealing with my request, citing the need for consultations to occur that could not – it asserted – take place within the statutory 20 working days. About a single document that is five years old, about events quarter of a century ago.

But a couple of weeks ago I did get a response to my request for background papers to the 2012 PTA. Having been threatened with a large bill in response to my first request, I took the Bank’s suggestion as to how to narrow the request, and they did subsequently release that handful of papers. As it happened, the papers covered by the revised request proved not to be very interesting. The one paper of interest was a six page letter to the Minister of Finance on 2 May 2012 outlining the outgoing Governor’s thinking on PTA issues. This was well before Graeme Wheeler’s appointment was announced (or probably confirmed). For the record, a copy of that advice is here:
2012 PTA Papers Bollard advice

The revised OIA request captured nothing of any interactions between the Bank and the Treasury, or between Graeme Wheeler and either Bank staff (including Alan Bollard) or the Minister. Given my experience with the Bank’s document management system, it does not greatly surprise me that this material did not get into the folder for issues relating to the new PTA. I might, in time, lodge some further requests. But the original background to this request had been a point about the relative lack of transparency around many aspects of the Reserve Bank and monetary policy. A genuinely transparent Reserve Bank, or a Minister committed to open government, would have pro-actively released the papers around the new PTA at the time it was released. Had that slipped their mind, a request like mine might have prompted a fuller release now. As it is, we still know little about the considerations that were taken into account in settling on the new PTA – even though it is the major instrument governing macroeconomic stabilisation policy, for five years at a time. Was there any discussion, for example, of the possible relevance of the zero lower bound for New Zealand? What pros and cons of adding the explicit reference to the target midpoint were considered? What debates happened around so-called macro-prudential policy,  And so on.

In some respects, this material is now of mostly historical interest. The PTA is what it is. The Governor is responsible for implementing policy consistent with the PTA, and the Minister is responsible, on behalf of citizens, for holding the Governor to account for doing so. But the background papers would help provide insights on what the parties thought they were signing up to, and why. And they would also shed some light on just how satisfactory (or otherwise) the current process is – in which a nominee as Governor must agree a PTA before he or she is even appointed, or necessarily has any exposure to (for example) staff advice.

But the lack of openness around the historical documents also reminds us that, without process changes, that is how the next PTA is likely to be handled. The clock is ticking on the Governor’s term, and it is only two years now until a new Policy Targets Agreement will need to be agreed – before a Governor is appointed or reappointed. Issues and risks around the zero lower bound have not gone away. If anything they have come into sharper focus since 2012, as countries have been cutting interest rates again. In New Zealand, the prospect of the OCR falling below the previous low of 2.5 per cent, even on the macro data as they stand today, reminds us that zero interest rates are far from impossible here either, if events turn nasty at some point.

Discussions around these issues should not just be occurring behind closed doors. It would be preferable if the Minister – the initiating agent in things around the PTA – and the Treasury would commit to a more open process of consultation and debate. For example, by the middle of next year perhaps some issues papers could be released for discussion, and a consultative workshop held to discuss and debate the issues and risks, as they affect New Zealand. Perhaps there would not be support for a higher inflation target, even if nothing is done about the ZLB, but at least we should understand the costs, benefits and risks of eschewing that option. Given that 2017 is election year, it would be good to have those discussions relatively early

When the key parameters of a major arm of macroeconomic policy are set only every five years, and implementation power (and associated wide discretion) is then handed over to a single unelected official, it becomes particularly important that there are opportunities for adequate scrutiny and debate at that five year review point. I noted recently that when the Bank’s five year funding agreement is put through Parliament there is no more transparency around expenditure plans than there is for the SIS. The situation is not really much better for the PTA, which probably matters rather more. Yes, outside parties can debate and analyse the issues themselves, but none of them have the analytical and research resources that the Treasury and the Reserve Bank have.

Reflecting on Puerto Rico

For those not totally absorbed in the hour by hour machinations of Greek politics, another highly indebted area that has been getting attention this week is  the US territory of Puerto Rico.  The focus is on the debt, and Gillian Tett has a nice column in today’s FT on the complexities of trying to deal with that.

But the piece that got me more interested was a short post by Paul Krugman on the economic challenges of Puerto Rico.  Many probably disagree with Krugman on macro issues, and on politics, but issues around trade and economic geography are where he made his name.  He concludes:

But I’d argue for paying a lot of attention to the non-specific forces affecting the island, and in particular the economic geography side. Puerto Rico may to an important extent just suffer from being a slightly hard to reach island in a time when corporations place a high premium on easy, just-in-time shipments.

It got me thinking again about New Zealand and Australia.  Now, to be clear, I’m not suggesting that most of the parallels are close:

  • We have our own exchange rate, currency (and minimum wage).  Puerto Rico doesn’t.
  • And our public debt, while not low, is at pretty comfortable levels.  Issues of public debt unsustainability just don’t arise here.

But, on the other hand, we are a fairly small country, quite distant even from Australia.  We have a lot more land than Puerto Rico (but no warm winters) –  and have historically have had a land-based economy,  And no more land is being made.  We used to have a big manufacturing sector, but only when we built up huge and costly protective barriers that meant manufacturing here was the only way into the market.   If we had 10 million people we would still be small and remote.

For decades, tens of thousands of our fellow citizens have been leaving for what they perceive to be a better life, and better economic returns, in Australia.  The annual outflow fluctuates a lot, but over time the numbers mount up.  935000 New Zealand citizens (net) have left since 1970, mostly to Australia.  Even though I use these numbers often, every time I calculate totals like that the scale of the cumulative outflow still takes me aback.

Puerto Rico has been seeing outflows too, and the pace has stepped up in recent years. The most recent census was the first ever in which Puerto Rico’s population has fallen.  As Krugman notes, this is not necessarily a bad thing

Put it this way: if a region of the United States turns out to be a relatively bad location for production, we don’t expect the population to maintain itself by competing via ultra-low wages; we expect working-age residents to leave for more favorable places. That’s what you see in poor mainland states like West Virginia, which actually looks a fair bit like Puerto Rico in terms of low labor force participation, albeit not quite so much so. (Mississippi and Alabama also have low participation.)

And outmigration need not be such a terrible thing. There is much discussion of what’s wrong with Puerto Rico, but maybe we should, at least some of the time, just think of Puerto Rico as an ordinary region of the U.S.; at any given time, we expect some regions to be in relative and maybe even absolute decline, as the winds of technology and global trade shift. I wonder, in particular, whether Puerto Rico is suffering from the forces that seem to be leading to a general shortening of logistical chains and the “reshoring” of manufacturing to advanced economies.

We’ve had plenty of  towns/regions in New Zealand in which the population has fallen.  My usual examples are Taihape and Invercargill.  In one sense, emigration from those places is difficult for those left behind but, given the changes in relative economic opportunities, the departures are better (even for those left behind) than the alternative.  If everyone had just stayed in Invercargill or Taihape, even though the opportunities had moved away, the social and economic outcomes would almost certainly have been worse.  No one argues that as a matter of public policy we should aim to replace those who’ve left such towns.

But at a national level that is exactly what we have been doing in New Zealand for the last 25 years.  Rational economic agents –  our fellow New Zealanders –  respond to changing economic opportunities by moving to Australia.  Basic economics –  and plenty of formal literature on the great migrations of the 19th century –  suggests that those outflows will not only have benefited those who left, but will have contributed towards factor price equalisation – closing the gaps (but only somewhat ) between returns in New Zealand and Australia.  But central government, endued  with (or rather implicitly asserting) a superior sense of what is wise or right, stands in the way of that process of  factor price equalisation by bringing in yet even more people than the number who are leaving.  Having just come from one hubristic disaster –  Think Big –  we stumbled into thinking big on foreign immigration too.

They don’t do it in other countries.   Plenty of fast-growing successful countries have attracted large number of migrants, to take advantage of the opportunities (Singapore is a recent example, and Ireland –  after it had already become successful –  was another).    But countries that are aiming to catch-up with the rest of the advanced world don’t use inward migration as a means to that end.    It doesn’t work.  Ireland didn’t, the eastern European countries didn’t, and Korea and Taiwan didn’t.

Advocates of agglomerationist arguments will be spluttering by this point.  But there isn’t a lot of evidence for such effects in comparisons between countries.  Over 100 years big countries haven’t grown faster than small countries.  Indeed, many of the countries with the highest per capita incomes are resource-based economies with small populations.  I occasionally run  the line that perhaps the optimal population of New Zealand (if there such a thing) is either 2 million or 200 million.  At 200 million perhaps we’d be like Japan, albeit still facing a “distance tax”.  At 2 million we might be maximising the per capita value of our natural resources.  Would, for example, any fewer cows be being milked?

We aren’t going to have a population of 2 million or 200 million in my lifetime.  But if we pulled inward migration of non-New Zealanders back to around 1980s levels, we’d now have a slightly falling population.  We’d have a much better chance then of beginning to close the income and productivity gaps, of sustainably slowing the outflow of New Zealanders, and perhaps even in  time of attracting home again some of those 935000 New Zealanders who’ve already gone.    We’ll do that when, and if, we succeed.  We won’t help the prospects of success by simply importing more other people.

Brian Fallow covers my criticisms of the proposed new controls

In his weekly column in today’s Herald, Brian Fallow outlines and reviews some of the criticisms I have made of the Reserve Bank’s proposed Auckland investor property finance controls.   The accompanying cartoon (only part of which is online) shows pygmies attacking the giant Wheeler, secure in his moated castle.

Fallow’s piece is a very fair presentation of some of the arguments I have made, particularly in my LEANZ address last week (and he also notes the Treasury’s evident disquiet about the proposed controls).  I’m not going to repeat old material here, but will just highlight a couple of the points that arose in subsequent discussion.

Brian noted that Grant Spencer, the Bank’s Deputy Governor, has often argued that even though the stock of debt is not currently growing rapidly, there are a lot of new loans occurring and hence the risks are rising.  My response to that point is that, in normal times, there will always be lots of new loans, and lots of repayments going on.  It is great that the Bank is now collecting more detailed flow data that enables us to better see that breakdown.  But because we have no historical time series, we don’t have any good basis for interpreting it, and knowing what it might mean about risk.  In particular, as I noted, we don’t know what the pattern of new loans vs repayments was in the credit and housing boom of 2003 to 2007 when, for example, housing turnover was much higher (and from which episode, as a reminder, banks emerged unscathed).   That drives me back to the international empirical literature on crises, which suggests that big increases in the stock of debt (relative to GDP) over short periods of time has been one of the best indicators of building crisis risks.  Of course, historical empirical work is also limited by data availability, but at this stage with no material increase in debt to GDP ratios, and no sign of any material deterioration in lending standards, there doesn’t seem a basis for great concern about financial stability in New Zealand.

I have also suggested that the Bank should be doing more careful comparative research and analysis on the similarities and differences between New Zealand’s situation and those of countries that have had nasty housing busts (US, Spain ,and Ireland) and those that did not (UK, Canada, and Australia for example).  Brian posed the reasonable question as to whether people won’t just focus on the superficial similarities and differences, cherry-picking points of similarity or difference that suit their own argument.  That is a risk, but in a sense that is the point of doing research and analysis (for which the Bank has far more resources than any else in New Zealand), and making it available.  It enables informed debate to occur, and each piece of data or analysis is open to scrutiny and challenge.  The contest of ideas and evidence is a big part of  how we learn.

Fallow concludes his article thus:

A financial crisis is a low probability but high-cost event, as the Treasury says.  If you focus on the low probability, like Reddell, the conclusion is that the bank should pull its head in.  If you focus on the high potential cost, like Wheeler, you would want to do whatever you can to slow the growth in house prices and buy time to get more built and for the net inflow of migrants to return to more normal levels.

Maybe, but actually I suspect that misrepresents both Graeme and me.  Graeme Wheeler probably thinks the probability of something nasty happening in the New Zealand financial system in the next few years is higher than I do.  And I’m not just focused on the low probability of serious financial stresses.  That is the importance of stress tests.  They aren’t probability-based.  Instead, they take an extreme scenario (in the Bank’s stress tests, a tough but appropriate extreme scenario) and examines what happens to banks if the scenario happens.  On the evidence the Bank has presented so far, the soundness of the financial system is not jeopardised in such an extreme scenario.  Whatever Graeme Wheeler’s personal inclinations or feelings, a threat of that sort is the only statutory basis on which the Reserve Bank should be acting.

What the government does is, of course, another matter. I reckon it should be doing more about liberalising land use restrictions and, since large scale change in these restrictions seems unlikely, should probably reduce the very high target level of non-citizen immigration.

Criticism of the RB is “bizarre”

Reading the Herald over lunch, I found a column by Matthew Goodson, the head of a funds management company.   Authors don’t get to write the headlines, but I think the gist of Goodson’s piece is summed up here in his own words:

“Thank goodness that Graeme Wheeler and the RBNZ are beginning to pay attention to the issue.  It is simply bizarre that they are being criticised for being the one official institution to show some leadership and tentatively use their limited tools to lean against Auckland house prices.”

I assume that I’m one of those whose views are being described as “bizarre”.

But let’s step through Goodson’s argument:

First, he seems to suggest that critics of the Bank think house prices will never come down.  Perhaps there are some who believe that, but I’m quite happy to work with an assumption that some event, at some point, could lower Auckland house prices by 50 per cent.  Indeed, that is what the Reserve Bank assumed when they did their stress tests.  And the banks came through unscathed.  Goodson does not mention this work, which has been published by the Bank, and Graeme Wheeler has not engaged with it.  Perhaps it is wrong or seriously misleading –  I’m open to the possibility –  but let’s see the evidence and argumentation.

Second, Goodson rightly stresses the bad economic consequences that have at times followed from credit-fuelled asset price booms.  As he says, the post-1987 New Zealand equity and commercial property crash springs to mind.  But the operative word is “credit-fuelled”.    Credit is growing at around 5 per cent per annum, just a little faster than nominal GDP, right now.  But over the years since 2007 the ratio of credit to GDP has fallen, not risen.  Big increases in the ratio of debt to GDP over quite short periods of time have been one of the better indicators of future problems (but there have been plenty of “false positives” too).  We had those sorts of increases from 2002 to 2007.  We’ve had nothing similar since.

Third, Goodson invokes Spain and Ireland, and fails to mention that these were economies that had German interest rates during the boom when they needed something more like New Zealand ones, and when the construction boom burst –  and construction booms do much more damage than pure asset prices booms – they were still stuck with German interest rates, not something lower, and couldn’t adjust their nominal exchange rates either.  There are plenty of lessons from Spain and Ireland if New Zealand is ever thinking of adopting a common currency.  But otherwise not.

Fourth, Goodson does not mention that all his points could have been made, more compellingly, about New Zealand in 2007.  We’d had rapid rises in the prices of all types of assets, rapid growth in credit across all components of bank lending books, signs of material deterioration in credit quality around dairy loans, and probably commercial construction, and big corporate-finance loans as well.  And yet, the banking system came through unscathed.  If controls had been put on back then, would they still be on today, at what costs to individuals and to the efficiency of the financial system?

Fifth, Goodson does not engage with the provisions of the Reserve Bank Act.  Perhaps what Graeme Wheeler is doing is in some sense good for the country –  I doubt it, but let’s grant the possibility.  But Graeme is not the elected Minister of Finance, proposing legislation to a Parliament of elected members.  He is an unelected official, supposed to operate within the confines of a specific Act.  That Act requires him to use his banking regulatory powers to promote the soundness and efficiency of the financial system.  But his own stress tests tell him that the soundness of the banking system is not impaired –  and even if it were to be, the capital buffers in the system are much bigger than they were in, say, 2007.  And what of the adverse impact on the efficiency of the system?  Equally creditworthy borrowers in Auckland will not, by the coercive power of the state, be permitted to take a loan from a bank that they would be able to if they were in Wellington or Christchurch. And non-banks can make such loans in Auckland, but banks can’t. Where is the evidence that banks and borrowers are behaving so recklessly that they cannot safely be permitted to have a single cent of debt secured on investment property if the loan is above a 70 per cent LVR?  Goodson doesn’t present it, and neither has the Bank.  Build bigger capital buffers if you must –  they have much smaller efficiency costs, and  don’t directly come between willing borrowers and willing lenders.

Finally, Goodson observes that “the RBNZ’s tools need to be sharpened rather than tempered, with other countries providing plenty of evidence for the success or failure of tools such as stamp duty, removing the tax advantages of so-called investors, overseas investment restrictions, loan restrictions et al”. To which I would make two responses.  The first is to say “Really?”   I think the evidence of the impact these differences make to house prices is much less clear.  Tax regimes differ enormously around the world, and if ours offer unjustifiable advantages to anyone it is to unleveraged owner-occupiers, rather than those operating residential rental services businesses (“so-called investors”).

But perhaps more importantly, I hope he isn’t suggesting that such tools should be wielded by the Reserve Bank.  We live in a democracy, where key economic policy decisions should be taken by those whom we elect, and whom we can vote out.  Goodson alludes to Sir Robert Muldooon.   Some of Muldoon’s interventions were pretty damaging and unwise, but we voted him into office, and we could (and did) vote him out again.

As I’ve said previously, the sense that “something needs to be done” seems to be  leading to sense that “anything is something, so let’s welcome anything”, with no proper problem definition, no sense of what should properly be done by whom, and no sense of the risks and costs if the authorities have it wrong.    The Reserve Bank has an important role to play. It should be doing two things.  It should be continuing to refine its stress-testing exercises, and the risk-weighting models used by banks in their internal capital models, to ensure that the banks really can cope with a very nasty shock.  And beyond that should be using part of the significant research and analysis capability the taxpayer funds to produce rigorous and well-grounded papers identifying the real issues in the local housing (and housing finance) markets, reviewing the lesssons from countries that have, and have not, had banking crises related to their house prices booms, reviewing lessons from past interventions (successful and otherwise).  They might even develop (or commission) expertise in things like capital income taxation or urban planning regulations, to better be able to provide advice on the costs and benefits of action, or inaction.  Considered analysis of this sort, complementing that from core government departments, can provide a good foundation for political decision-makers to act, or not act.  But these are the sorts of instruments that, in a free society, only elected people should be deciding on.

Serious liberalisation of planning laws, and/or a reduction in the non-citizen target immigration level would be good places to start.  Both would, very belatedly, lower house and land prices, probably rather a lot.  But they would not threaten the soundness of our financial system..

Productivity growth worse than in Greece

In the interview with Richard Harman I noted that one of my main interests and (rather more importantly) one of the bigger challenges for New Zealand was its disappointing economic performance over the last 25 years.    The liberalisation of the economy in the 1980s and early 1990s was generally expected to have reversed the earlier decades of relative decline.  Not everyone shared that optimism, but among the advocates of reform within government and the public service, and among most international observers (for example, the IMF and OECD, and financial markets), that sort of re-convergence was generally expected.

But it didn’t happen.  For a while there was a “the cheque is in the mail” hypothesis doing the rounds –  it hadn’t happened yet, but it surely wasn’t far away.   But 25 years is a long time, and it just has not happened.  Around 1990, the former eastern-bloc countries started serious liberalisation.  Their economies had been much more heavily distorted than New Zealand’s (notwithstanding the Bob Jones crack in 1984 about the New Zealand economy resembling a Polish shipyard), but they have subsequently seen considerable convergence.

Here is my favourite summary chart of our underperformance over that period.  Using the Conference Board data, it is total growth in real GDP per hour worked for 42 advanced countries (OECD, EU, and Singapore and Taiwan) since 1990.  Only five countries had had slower growth over that period than New Zealand –  and two of them (Switzerland and the Netherlands) had had among the highest levels of labour productivity in any of these countries in 1990 (so one might have expected unspectacular growth subsequently).  No cross-country comparative measure is perfect, but I don’t this one is particularly unrepresentative of New Zealand’s relative performance  On this measure, Greece and Portugal have done less badly than us  (but recall that this is GDP per hour worked, and in the current Greek Depression total hours worked have dropped away precipitously).

GDPphw since 1990

I’ve been running a story about the role of immigration policy in explaining that failure to converge –  total GDP has grown a lot, even if GDP per hour worked hasn’t.  In this wider sample of countries, New Zealand has had among the faster rates of population growth, despite the huge outflow of New Zealanders (around 525,000)  over that period.   Singapore (86%) and Israel (77%) have had much faster rates of population growth than New Zealand (30%) over this period.

My argument has been that in a country with a low savings rate, rapid population growth has put considerable sustained upward pressure on real interest rates and the real exchange rate, squeezing the share of GDP devoted to business investment and preventing the emergence of new tradables sector firms/products at the rate that (a) convergence would have required, and (b) the rest of NZ’s microeconomic policy framework might have suggested/warranted.  A few weeks ago, I showed how our real exchange rate against Australia had failed to decline despite the deterioration in our relative economic performance over decades.

Here is another way of looking at the same point.  The two countries with the fastest growth in the chart above were Taiwan and Korea.  Singapore has also done impressively well.  In 1990, Taiwan and Korea were well behind New Zealand, and Singapore had about the same level of real GDP per hour worked as New Zealand  (precise comparisons depend on which set of relative prices are used, but on any measure all three countries have had growth outstripping that of New Zealand).

And here is the picture over 50 years, again using the Conference Board data
gdpphw asia
All three Asian countries have had some of the more dramatic catch-ups in productivity levels seen anywhere.  New Zealand, by contrast, in 1965 was among the advanced countries with the highest levels of labour productivity, and has been in relative decline since.

But what has happened to the countries’ real exchange rates since?  As ever, there is no unambiguous way to measure that, but the BIS have real exchange rate indexes for each of the four countries going back to the 1960s.  Of course, real exchange rates can move around a lot from year to year, so in this chart I’ve shown the percentage change in the real exchange rate from the average for 1966-70[1] to the average for the 10 years to May 2015.

bis rer asia

The countries that have had such dramatic productivity improvements have all recorded modest falls in their real exchange rates, and by contrast New Zealand has had an increase in its real exchange rate.  That is opposite of what one might initially have expected.  One might have expected a strong real appreciation in the Asian currencies (as has happened in Japan), as much higher incomes supported more and cheaper consumption in these countries.  Fewer resources now needed to be devoted to the tradables sectors in those countries.   And in New Zealand one might have expected the deteriorating productivity performance, and hence declining (relative) future consumption opportunities, to have been met by a declining real exchange rate. That would have increased the returns to productive investment in New Zealand –  helping to reverse the decline – and raised the relative price of consumption.

How does my story explain what went on?

In last 25 years, Korea and Taiwan have had materially slower population growth rates than New Zealand has, and much higher savings rates.  That meant both less pressure on resources simply to maintain the capital stock per person, and more domestic resources available to meet investment demand.  The net result: little upward pressure on real interest rates and the real exchange rate, despite the continuing productivity gains.

Singapore is at the extreme.  The national savings rate has averaged 46 per cent in Singapore over the last 25 years, roughly double the rate for advanced countries as a whole.  With so many resources available (earned but not consumed) even the investment needs of an average population growth rate of 2.5 per cent puts no pressure on domestic resources, or hence on real interest rates and the real exchange rate, despite the continuing productivity gains.

And that is my story in a nutshell: with very high saving rates your country might need lots more people to make the most of the savings.  But in a country with only a rather modest savings rate (for whatever reason) then having lots more people –  and especially bringing them in as a matter of policy – simply looks wrongheaded.  It undermines what policy is setting out to achieve.

It isn’t that migrants somehow “take away jobs”, but rather that rapid population growth (whether migrants or high birth rates) tends to divert resources (jobs) away from growing the bits of the economy that sell to the rest of world (a huge and diverse market, and probably where our future prosperity is to be found) to ensuring that the physical infrastructure (houses, roads, shops, factories, schools) keeps pace with the needs of the growing population. It makes it very hard to catch up with the richer countries.   Israel has found something much the same.

No comparison of any pairs of countries, in any particular period, is ever going to be conclusive.  I use the examples in this post simply to illustrate the story.

[1] Starting the comparison from the start of the BIS series in 1964 would result in an even larger fall for Korea

The contrary views of Croaking Cassandra

For anyone interested in a bit of background to this blog, and on me, Richard Harman, proprietor of the new New Zealand political news and analysis site, Politik ran a profile of me this morning.

It is a pretty fair reflection of our interview, and reflects my interests and aspirations –  in particular, the issues around New Zealand’s long-term economic underperformance matter a great deal more to me than critiques of aspects of the Reserve Bank.  When I left the Reserve Bank, I intended that Bank-related material would represent a distinct minority of my posts.  That is still my aim, but it may take some time to get there (and as one journalist who came to visit said to me “I wouldn’t be here if you were writing mainly about long-term economic performance issues”).

Sadly, the description of the Governor’s attitude to some criticisms I made of a draft document around the first set of LVR controls is accurate.  After that episode –  where even the extreme disapproval was only conveyed indirectly –  our next conversation was two years later when we accidentally found ourselves alone in the same lift in the midst of the restructuring that led to my job being abolished.  I was clearing my desk and carrying a box of books down to my car.  To his credit, Graeme did actually manage to make conversation –  about Piketty’s book, a copy of which was on top of my pile.

I should make one clarification/correction.  I’m reported as saying, about LVR restrictions, “Furthermore the Bank had done no research on what the likely impact of the controls might be.”.  I don’t think that was what I said, but if I did say it, it was not what I intended.  My criticism of the Bank’s analysis and argumentation around LVRs has been around

  • the failure to produce research looking carefully at the lessons of countries that did, and did not, experience financial crises in the last decade,
  • the failure to meaningfully engage with the Bank’s own stress test results, which suggest the New Zealand system is very resilient to even quite severe adverse shocks, and
  • the failure to engage with the statutory requirement to promote the efficiency of the financial system.

And  in the final sentences, I’m not sure how my friend and former boss Don Brash ends up classified by Harman as a “non-practitioner”.

SNZ’s productivity growth estimates

Statistics New Zealand released a swathe of annual productivity data yesterday.

These annual productivity data focus on the so-called “measured sector”, whereas most often (for data availability reasons) productivity comparisons are done for the whole economy.  The measured sector currently covers 77.3 per cent of the economy.  It excludes ownership of owner-occupied dwellings, public administration and safety, education and training , and health care and social assistance –  all sub-sectors where market price information is difficult or non-existent.  The measured sector data are good quality but (a) are only available with a considerable lag (data released yesterday are up to the year ended March 2014), and (b) are mostly only useful for looking at New Zealand’s own performance over time (and only limited amounts of time, since the data on this measure go back only to the mid 1990s).  Other databases, typically using whole economy measures, are more useful for timely cross-country comparisons.

The chart below shows measured sector labour productivity and total factor productivity growth since the  year-ended March 1998.  These measures don’t just use a volume measure of labour inputs (eg hours worked) but adjust for the changing composition (improving quality of the workforce).  Simple measures based on hours worked in effect understate the role of inputs and, thus, overstate productivity growth.
measured sector
On this measure, labour productivity growth does not look too too bad.  In particular, although growth since 2007/08 has been slower than it was previously, the slowdown is less marked than many other series show for other countries.  But bear in mind that over the 16 years shown, total growth in labour productivity was only 20.3 per cent –  just under 1.2 per cent per annum.

By contrast, the TFP picture is sobering.  In the 11 years since 2003, total TFP growth has been around 1.5 per cent (little more than 0.1 per cent per annum).  As I’ve suggested previously, perhaps there is something in the notion that the higher terms of trade (since 2004) have undermined TFP growth, changing production patterns to take advantage of the higher output prices but in ways that reduced measured productivity.  Perhaps, but I doubt if the effect can have been quite that large.  And the sectoral TFP data back up those doubts.  Here is the chart for agricultural sector TFP (only available to March 2013).  It is a noisy series (droughts do that), but it looks as though there has been some TFP growth in the sector since 2003, unlike the picture in the aggregate TFP series.

agriculture

Finally, a quick comparison with the Conference Board estimates for New Zealand, which I used in my series on cross-country comparisons since 2007.    Here is the chart.

conference

The Conference Board uses a model to estimate TFP which ascribes more of New Zealand’s growth to the growth in capital services (than SNZ do).  (Like SNZ they make a correction for changing labour quality).   There is no point directly comparing the number from the SNZ measured sector TFP series with the Conference Board TFP series – different models produce different results.  But what is perhaps useful is to note that in both models New Zealand’s TFP growth has tailed-off markedly since 2003.  That should be pretty disconcerting.

And here is the international context for TFP growth, with a focus on the post-2007 period.