Reading the TWG report

You might idly dream –  or hope, increasingly desperately, for your own sake (younger readers), or for your children or grandchildren – that one day real house prices might be sustainably lower again. There is no good or defensible reason why they shouldn’t be.  It is just that our political “leaders” choose to keep on doing nothing real about it.  From time to time some of our politicians talk a good talk about fixing this national disgrace –  once upon a time the current Minister of Housing was foremost among them (embraced even by the libertarians at the New Zealand Initiative) –  but then do nothing, or attempt to distract us with interventions that have little or nothing to do with the real problem.

The Tax Working Group’s report, out last week, assumes this state of affairs goes on indefinitely.   Why do I say that?   Because in the revenue projections they include in the report (and on which they construct a case for permanent income tax cuts):

  • the bulk of the revenue is from gains in urban property prices (land and buildings), and
  • they assume that property prices rise (indefinitely) at 3 per cent per annum, only 2 per cent of which is general consumer price inflation.

Since actual physical buildings experience real depreciation, and since over the long term construction costs are unlikely to rise at a rate much different than general CPI inflation, the implicit assumptions seems to be that urban land prices will rise even faster.   (It has never been clear to me how anyone thinks they can safely forecast real asset prices, let alone plan responsible tax policy on such forecasts, but set that to one side just for the moment.)

So most of the revenue would arise from general consumer price inflation –  which simply shouldn’t be taxed (since no one is better off as a result; there is no addition to purchasing power) – and the rest apparently from assuming that the rigged (by central and local government) housing market continues to get even more out of line.   If we are going to have a capital gains tax on urban property, perhaps the government could at least consider using any proceeds to compensate the generation put in an ever-more-impossible position by their own policy choices/failures?   Alternatively, if the government (Mr Twyford) really is still serious about fixing the housing market –  and he claims to be so – they need to recognise that there will be little or no revenue from a capital gains tax for a very long time.  In principle, the ability to deduct capital losses from other taxable income would actually make it a net drain on the public finances were anything serious ever to be done about fixing the housing market (investors, but not owner-occupiers, would be partly compensated for their losses, upending most people’s sense of fairness).

There is a choice:

  • reasonable amounts of revenue, much of it plundered by taxing inflation compensation, if the rigged housing market is allowed to continue, while doing nothing to compensate the actual losers from that (governmentally) distorted housing market,
  • or little or no revenue (perhaps even net fiscal costs) if a government ever gets serious and fixes the housing and urban land market.

Reading the entire report yesterday, and even going back to read the interim report, I was struck by how thin and weak the economic analysis in the document was.  As someone noted to me yesterday, it had a strong feel of something in which the working group started with a conclusion and went pretty much straight to how to write rules, without thinking about the underlying economics.   I noted a year ago how little any concerns around productivity (lack of it) figured when the Tax Working Group set out their plans.  And they delivered –  there was very little about those considerations in their reports.  Not even a recognition that, for all the talk about reallocating investment, if anything probably too few real resources have gone into housebuilding over the years not too many (given the growth of the population).

There was lots of focus on raising more revenue, and little on the low rates of business investment we already have, or on the way in which we tax much of capital income more onerously than almost any other OECD country.   The idea of fixing inflation distortions directly didn’t get much space either.  The current system bears very heavily –  and quite unjustly – on people holding savings in the form of bank deposits, and it also gives away money, totally unnecessarily (and without economic justification) to business borrowers. Allow deductions of interest expenses only for the real component of any interest rate –  it wouldn’t be that hard to do –  and you’d both improve efficiency and get more money out of leveraged property investors (and in ways that didn’t rely on a continued rigged market).

The economic analysis around the proposed capital gains tax itself was also weak –  I’d say “surprisingly weak”, but there was an agenda going into this review, so I can really only say “disappointingly weak”.   I know I saw no mention of the idea that most real capital gains (and losses) are windfalls (since markets tend to price assets efficiently on the information available at the time) –  and that, in the case of windfalls, a capital gains tax is pure double taxation.   I don’t think I saw a single mention anywhere of the fact that, if these recommendations are adopted, New Zealand will have probably the very highest rate of capital gains tax in the world.   The discussion of the lock-in problems around capital gains taxes was threadbare –  it was noted, but there was no sustained analysis, no careful discussion of various published studies on the effect, and nothing linking back to the fact that if our CGT rate is the highest in the OECD, our lock-in problems are likely to be more significant.    There was little or no serious analysis of the potential impact on entrepreneurship and innovation –  and certainly nothing that put that issue in the context of an economy with low rates of business investment.

There was also nothing at all about the incentives a realisations-based CGT creates for assets to be held not by those best able to utilise them, but by those least likely to have to face a CGT charge and those best-placed to utilise any losses: capital gains taxes  (like ring-fencing, like the PIE regime) will create more of an incentive for more assets to be held by institutions, foundations etc, rather than directly by individual investors, not because those institutions are better managers or owners, but because they are less likely to have to crystallise a CGT liability.  Tax policy for the big end of town.

And, of course, there was nothing about the systematic asymmetry built into the system, in which gains are fully taxed (when realised) but many losses may never be able to be fully utilised.   Take two separate businesses each valued at $100 million on the day the CGT is implemented, both owned by individuals who are 55.  Over the following decade, one business does well and when the owner comes to retire he sells it for two hundred million dollars. He is liable for CGT on that gain. The other business does poorly and when the owner comes to retire, there is little or no value left in the business.    In principle, he can offset that capital loss against other income, but at 65 it is very unlikely that over the remainder of his life he will anywhere near enough income to fully utilise those losses (and even if he does, there is a further –  perhaps lengthy –  time delay).   In fact, the TWG proposes that some losses could only be used to offset other losses in that same sort of activity (not against, say, labour income).  Since the nature of a market economy is that some businesses do well and others don’t, mine isn’t at all an implausible scenario.  There might be a decent case (in equity, although not in efficiency) for taxing windfalls etc if the treatment of losses was fully symmetric –  the government then would be a pure equity stakeholder in all businesses –  but that isn’t what is proposed.

And finally, I was also struck by how threadbare was the discussion around the New Zealand Superannuation Fund.   That organisation appeared twice in the report.  The first was this bid.

35. The New Zealand Superannuation Fund (NZSF) has suggested the use of a limited tax incentive to spur investment into Government-approved, nationally significant public infrastructure projects that would benefit from unique international expertise.
36. NZSF suggested that investors pay a concessionary rate of 14% (i.e. half of the
current company rate of 28%) on profits made in New Zealand from qualifying projects. Qualifying investors would need to have a demonstrated capability to deliver world-class infrastructure projects; they would also need to bring expertise that is not ordinarily available in New Zealand and commit that expertise to the delivery of the infrastructure.
37. NZSF’s suggestion has merit. The Group recommends that the Government consider the development of a carefully designed regime to encourage investment into large, nationally significant infrastructure projects that both serve the national interest and require unique international project expertise to succeed.

I wrote about this bid when NZSF first published their submission.  I wrote then that

I’m all in favour of lower company (and capital income) taxes more generally.  Standard economic analysis supports that sort of policy, and all of us would be expected to benefit from adopting such a policy approach.  But that isn’t what is proposed by NZSF; it is just a lobbying effort to skew capital towards particular sectors they happen to favour.  It is a pretty reprehensible bid to degrade the quality of our tax system.  There is no economic analysis advanced in support of their proposal –  so little it almost defies belief –  no sense of considerations of economic efficiency, just the success of lobbying efforts in a few other countries (including two struggling middle income countries not known for the efficiency of capital allocation or quality of governance, and the United States –  which not only has plenty of poor infrastructure, but a corporate tax code  riddled with exemptions and distortions).

Same goes for the Tax Working Group’s treatment of the issue.  We deserve better.

The second substantive issue in which NZSF is mentioned is around the tax liability of NZSF itself.

56. During its discussions on retirement savings, the Group noted the oddity that the NZSF must pay tax to the New Zealand Government. The NZSF reports that it paid $1.2 billion in tax, or 9% of New Zealand’s corporate tax take, in the 2016-17
tax year.

That is a good thing. It helps to ensure that the NZSF –  operating at arms-length from the government of the day –  faces the same incentives as any other New Zealand investor.   Were it not so the ownership structure of various assets could look quite different, since NZSF would be in a position to pay more than other potential investors for any particular asset, not because they would be better owners, but just because they were tax-favoured.

There does appear to be a small substantive issue, relating to NZSF’s activities overseas

It is more difficult to argue that the NZSF should benefit from sovereign immunity when it is subject to tax in its home jurisdiction. The NZSF reported paying approximately $14 million in tax to foreign governments in the 2016-17 tax year (New Zealand Superannuation Fund, 2017). This is a cost to the NZSF that does not benefit New Zealand.
59. Tax-exempt status would better recognise the fact that the NZSF is an instrument of the Government of New Zealand and make it easier for the NZSF to apply for tax exemptions in foreign countries where they are available. Not all governments recognise the principle of sovereign immunity, so the NZSF may still have to pay tax in some jurisdictions, even if it becomes tax-exempt in New Zealand. Nevertheless, the NZSF will benefit from lower compliance costs in New Zealand and some reduction in foreign taxes.

That $14 million is a real cost to New Zealanders, but as the TWG themselves recognise even exempting NZSF from all New Zealand taxes would probably not reduce that number to zero.

But what is really striking is that there is no discussion –  not a word –  about the risks that exempting NZSF from taxes might pose to the efficient allocation of capital in New Zealand.  Instead we get shonky arguments like this

Tax-exempt status would also reduce the amount of contributions that need to be made by the Government over time in terms of the funding formula in the New Zealand Superannuation and Retirement Income Act 2001.

Well, yes, but so what?   Reduced contributions aren’t a real saving in this context, just a substitute for reduced tax revenue from the NZSF.

Ah, but “the NZSF will benefit from lower compliance costs in New Zealand”.   No doubt that is true, but NZSF with its $37 billion of your money is considerably better placed to cope with the inevitable compliance costs of the tax system than most of the rest of us, including most of the rest of the business operations that would become subject to the TWG’s capital gains tax.   Hard to believe that they could really run that line with a straight face.

More on bank capital proposals

( I guess Adrian Orr will now have to add to the “two bloggers” –  the only people he concedes were critical of his tree god shtick – a pretty well-respected columnist in the nation’s largest-circulation newspaper?   When you masquerade as a tree god –  weird metaphors, worse history and all –  it might risk someone suggesting you were away with the fairies? It is a bad metaphor, badly used and shedding little light, instead serving mostly to misrepresent and exaggerate the contribution and place of the Reserve Bank itself. )

The Governor’s proposals to increase massively the amount of capital banks have to have are back in the spotlight.  There was apparently a briefing on Friday for favoured media/commentators, but they still won’t lay out some of the basics that (they say) support their claims.  One journalist emerged from the Friday briefing and rang me seeking a bit of information (that I didn’t have at my fingertips) that you’d have thought the Reserve Bank would have been proactive about having out there.   We’ve seen nothing from them on the expected transition (eg a range of scenarios as to how banks and markets will respond, and what the output and efficiency implications might be) and we still don’t have any analysis supporting their claims that (a) the new proposed capital requirements would be “in the pack” internationally, or (b) that there is a free lunch on offer (more stability and higher GDP).  Remember this graph from the Bank’s consultative document.

something for all

They never spelled out the analysis in support of it –  indeed, they largely eschew modelling, suggesting that they really have no idea where that “optimal” point might be (or, thus, whether we might not already be near it, or even above it (in capital ratio terms)).  Perhaps in tomorrow’s speech the Deputy Governor might finally set out the case in a more convincing terms –  he might even consider discussing why it is that if his boss really thinks big bank failures are what we have to worry about, they plan to still insist on tiny banks having almost as high capital ratios as, say, the ANZ or BNZ.  Or why, for example, the Reserve Bank has refused until now to allow Kiwibank to compete on the same (capital) terms as the big banks.  Or to carefully recognise that “levelling the playing field” (perhaps a worthy goal) is something quite different  – and needs to be evaluated separately – to raising the hurdle for everyone.  The case for something like the former might be easy enough to make.  The case for the latter really hasn’t yet been made at all.

The Bank attempts it with more folksy analogies.

Bascand said at a news briefing that the bank’s proposals were about “putting the roof on while the sun is shining”

That’s generally a good idea –  putting a roof on.  But when credible analysis –  an internal commentary on which was released by the Reserve Bank here – suggests that the actual capital ratios of New Zealand banks are already relatively high by international standards a better analogy might be putting on a whole new roof over the top of an existing one when the existing one was perfectly serviceable and about only five years old.   That would be worse than gold-plating, it would be just a rank waste of resources and a whole new layer of regulatory inefficiency.

Much of the Bank’s rhetoric about these proposals has been built around the notion of the probability of crisis.  This is from the Governor’s speech notes of 30 November

In making this assessment, our recent work makes the explicit assumption that New Zealand is not prepared to tolerate a system-wide banking crisis more than once every 200 years.  

That is an annual crisis probability of 0.5 per cent or less.

It has a ring of science around it, but when one digs into the background papers the Bank has (belatedly) released, it is striking how flimsy this number seems to be.   Just a few weeks prior to that speech of the Governor’s a decision paper was put up

36. We believe a reasonable interpretation of ‘soundness’ in the context of capital setting is to cap the probability of a crisis at 1% (or 0.5% if we wish to mirror approaches taken in insurance solvency modelling).

So staff actually thought that a one in 100 year crisis was the appropriate number, but included the 1 in 200 approach almost parenthetically, very late in a longrunning review.  In principle, that difference should, in turn, make a big difference to the appropriate minimum capital requirements. In practice, it looks as though the Bank had some capital ratio requirement numbers in mind, and then cast round for some props to support them.

As it is, the risk-appetite framework (the 1 in 200 year benchmark) is pretty questionable as a starting point.  In part, that is because any well-designed regulatory intervention needs to look at both the costs and benefits of a particular intervention. It is largely meaningless to put a stake in the ground (whether 1 in 100 year or 1 in 200 year) without some robust sense of what the efficiency implications of the resulting interventions might be.  There is little sign that any serious analysis of that sort was done before the Governor plumped, late in the piece, for his 1 in 200 standard.

But there is also no “state of the art” when it comes to either defining financial crises, the cost of those crises, or the contribution that bank capital requirements could plausibly make in reducing those probabilities/alleviating those costs.   That really is the guilty secret here.  And it would involve no shame if the people involved were upfront and honest about what we don’t know –  there is lots in many areas of life.  Instead, largely-imaginary castles in the air are being built and marketed, used by people whose incentives aren’t necessarily that well-aligned with the longer-term public interest.

It is worth appreciating just how limited the data really are.  Consider that 1 in 200 year standard the Governor articulates. In principle, one might like 10000 years of data –  in fact we don’t have much more than 100 years of data, and for not much more than a handful of (advanced) countries.     And even of that supposed 100 years of data, a huge number of the observations of actual crises were really a single observation of one (interconnected) crisis, in 2008/09.   But even then, these are not physical processes (like storms or floods or earthquakes) we are dealing with, but human ones, and humans change and learn (for good and ill).   And there is rarely any serious consideration of the countries that didn’t experience crises, or of what contribution (if any) differential capital requirements made to those outcomes.

There is no agreement in the literature on whether the output effects of financial crises are temporary or permanent, let alone how large those effects actually are.  It makes a huge difference what you assume.   Perhaps it is fine for an academic modeller to drop in some median estimate, but that number will be almost meaningless if plucked from a relatively small number of studies, producing a very wide range of different results.

Linked to this (and crucially), it is very rare to see any papers in this area (and the Reserve Bank’s latest consultative document is no exception –  although its 2013 cost-benefit analysis supporting the now-current capital requirements did note the point) distinguishing between any costs that result from the misallocation of capital during the boom phase and any costs that results from systemic bank failures themselves.   Higher bank capital requirements can probably do something about the latter, but they can do nothing at all about the former –  in fact, there is an argument that unreasonably high capital requirements could induce some more reckless lending/borrowing, as banks attempt to maintain rates of return.   I’m not aware of any paper that has seriously attempted to estimate separately the two effects (if anyone is, please let me know).

Ireland over the last decade is a good example of the significance of this point, as are New Zealand (or the Nordics) in the late 80s and early 1990s.  There was plenty of reckless lending/borrowing, on over-inflated assumptions about future asset values, economic growth etc etc.  Much of the (building in particular) activity that followed simply involved wasted resources.  It wasn’t apparent during the boom –  it never is –  but the bust is partly about those effects crystallising.  If no bank had failed in the aftermath, all of those particular wealth losses would still have occurred, banks and potential borrowers would still have had to reconsider and review their business models, identifying better just what were good credits in thos particular economies.  I’m not suggesting that bank failures themselves had no adverse aggregate economic effects –  quite possibly they did –  but even if you could safely identify all the output losses relative to a pre-crisis trend, it would still no be remotely safe to ascribe all those to the banking failures.  And bank capital requirements will only affect the probability of banking failures.

One could throw in more points.  For example, the Reserve Bank has periodically tried to claim that there is good reason for New Zealand to be more cautious (in setting capital requirements) than other countries because of some specific New Zealand vulnerabilities.  But they simply never seriously spell-out the nature of those (asserted) greater vulnerabilities.  One might, for example, be more cautious if bank balance sheets were chock-full of complex instruments.  Our banks aren’t.  Or were very heavily exposed to new and highly uncertain industries. Our banks aren’t.  Or if your big banks were co-ops (with little ability to raise new capital if times get tough).  But our banks aren’t.  Or even if the government’s own finances were severely impaired.  But our government’s aren’t.  Or if your banks and country were part of a monetary area such that you had no independent monetary policy and no floating exchange rate.  That is the situation for much of the OECD, but it isn’t for New Zealand.   These are plain vanilla banks, mostly with parents that are among the better-rated banks in the world, operating in a country with a floating exchange rate and robust government finances.    But you won’t here those lines from the Reserve Bank –  well, you will when they proclaim, in every FSR, that the New Zealand financial system is sound and robust, but not when they assert (as here) that the system is far less sound than it should be and (expensive) core capital should be almost doubled.

And then there is question of the appropriate discount rate.  If we are worrying 1 in 200 year crisis we are worrying about events that are (probabilistically) a very long way in the future.   As even the Reserve Bank acknowledges (page 9, they don’t do their own modelling but they report that of other central banks), studies to date all use discount rates below those required by the New Zealand Treasury when agencies are evaluating potential investment projects and regulatory interventions.    Treasury’s latest recommended default discount rate is 6 per cent real.

Suppose we are worrying about preventing a shock 75 years hence (the Bank’s proposals envisage that we would still suffer than 1 in 200 year event, but would prevent, say, the 1 in 150 year event) that might cost 10 per cent of GDP then.  Discount that 10 per cent loss back at a 6 per cent real discount rate and the present value of what you are trying to prevent is tiny (about 0.5 per cent of GDP even if allow some reasonable productivity growth, such that 10 per cent of GDP 75 years hence is quite a bit more than 10 per cent of today’s GDP).  A 6 per cent discount rate is, itself, ludicrously low in this context: it is not like evaluating a known technology (recall all those highly uncertain points I discussed above).    There are reasons why private businesses typically use hurdle rates of return well above estimated firm weighted average cost of capital (essentially what the Treasury numbers are based on).

hurdle rates

Apply a higher discount rate –  even just take it up to 10 per cent real (just 4 percentage points above the Treasury-estimated WACC) – and the estimated future GDP savings 75 years hence reduce to near-invisibility.   You do not then need many costs upfront (say in the proposed five to seven year transition period, almost inevitably spanning the next recession) for this proposed regulatory intervention to fail the simplest sort of cost-benefit assessment.

And this current proposal is the whim/preference of one Governor.  He will not be Governor is 75 years time.  Most likely he will not even be Governor 10 years from now.  So there is no pre-commitment mechanism.  We could end up paying all the transitional costs only to find that 10 years from now some new Governor, some new government, some new studies all end up concluding that –  actually- the sorts of risk-weighted capital ratios we have right now were really just fine after all.

On which note, my former colleague Ian Harrison (now of Tailrisk Economics), who built the model the Reserve Bank used to evaluate capital requirements in 2012/13 and who thus know whereof he speaks, has been beavering away on his own review and critique of the Reserve Bank’s consultative document, drawing on a detailed examination of the documents the Bank has published and those they cite.   He sent me a draft and suggested I might like to highlight a few of his points, a teaser for the full publication expected in the next couple of weeks.    There is a lengthy and serious assessment, done in considerable detail, and accompanying it is a set of Pinocchio awards, evaluating the Bank documents using an approach adapted from the Washington Post’s fact-checking methodology.   Thus

One Pinocchio:  Some shading of the facts. Selective telling of the truth. Some
omissions and exaggerations, but no outright falsehoods.  ……

Four Pinocchios: Whoppers

On Ian’s assessment, the Bank’s material scores, shall we say, poorly.

From the more substantive document

The costs of the policy receive little attention. It is admitted that the higher capital requirements could make it more expensive for New Zealanders to borrow, but the Bank claims that  the impact will be ‘minimal’ and that they have taken it into account.  However, even on the Bank’s own assessment of 8 basis points[1] for each percentage point increase in the capital ratio, the cost to New Zealand will not be minimal. It is likely to cost around $1.5 billion per year, and possibly more.

The present value of the cost of the policy could reasonably be assessed at $30 billion. ….  A homeowner with a $400,000 mortgage could be paying an additional $1000 or more a year.

[1] This is the number that appears in the decision document. A figure of 6 basis points appears in the consultation document but there is no explanation for the difference.

(Wider margins could affect depositors as much as borrowers, if there is some OCR offset, but either way the effects are not trivial.)

Or

The central question that is addressed in this paper is whether the benefits, (‘being more resilient to economic shocks’) are worth more than the $30 billion. Our assessment is that it is not.  New Zealand could secure nearly all of the benefits of higher capital by increasing tier two capital, as the Australians are proposing to do, at about one fifth of the cost of the Reserve Bank’s proposal.  The Reserve Bank has not seriously considered this option.

Or

The Bank’s assessment that the banking system is currently unsound [implicit in the proposal to require such huge increases in  capital] is at odds with rating  agency assessments and borders on the irresponsible. The rating agencies’ assessment of the four major banks is AA-, suggesting a failure rate of 1:1250.

Ian concludes that using credible inputs to established Basle models, the Governor’s 1 in 200 year target would be adequately met with lower minimum capital requirements than we have at present.

Perhaps all the answers will be in the speech from the Deputy Governor tomorrow. Whether they are or not, this far-reaching proposal needs much more robust analysis in support. Declarations from the oracle of the forest really are not enough.

Working hours

The other day, for some reason, I was looking back at the records of this blog, and got curious about which posts had had the most specific views.  It turned out that for some reason (I think it got linked to overseas) this early post – about how New Zealand’s economy had done relative to other advanced countries since 2007 – was the “winner”.  Rereading the post, I lit upon this chart

hoursanglo

As I noted then

Hours worked are an input (which comes at a cost) not an output, so higher hours worked aren’t automatically a good thing.  There are good dimensions to it, if (for example) people are coming off long-term welfare back into the workforce, or older people are keen and able to stay in the workforce.  Hours worked per capita also gets affected by different demographic patterns –  they will be lower in countries with lots of under-15s or over 70s.  But, equally, part of the story of New Zealand in the last 25 years is that we have managed to limit the deterioration in our GDP per capita, relative to that in other countries, by working more.  Productivity would be better.

Over the full period since 1990, here is the change in hours worked per capita for New Zealand and the other Anglo countries, countries with reasonably similar demographics to our own.

1990 was the year just prior to a recession in many countries, including New Zealand, and is a not uncommon jumping-off date for looking at the experience of New Zealand since the reform era.

Since the post was almost four years old, I was curious whether anything much had changed.     Here is the same chart, using data from the Total Economy Database maintained by the Conference Board.

hours per capita 2019

Something of a recovery in Ireland, but otherwise not much.     The difference between New Zealand and the other countries in the chart isn’t mainly a cyclical story, but even in the last decade a larger proportion of New Zealand’s per capita GDP growth has come from working more hours (per capita).

hours per capita 2019 2

(Interestingly, the UK labour productivity growth record over that decade has been even worse than that of New Zealand.)

I had a quick look at a wider group of advanced economies (OECD + EU + Singapore and Taiwan).   For the full period since 1990 there isn’t complete data for all countries (gaps mostly the former Communist countries of central and eastern Europe), but of the 32 countries for which there is data, hours worked per capita dropped by 1 per cent for the median country (up 16 per cent in New Zealand).    For the more recent period, where there is full data, the median country spent 2 per cent fewer hours per capita working, while in New Zealand median hours per capita increased by 2 per cent.

(For those interested, there is a group of countries  (Singapore, Hungary, Israel, Chile, Mexico, Poland) where hours per capita have increased materially more than in New Zealand over the last decade.)

I am not trying to draw any particular policy conclusions from these numbers, just to highlight them.  And it is not as if New Zealanders had been leisured people at the start of the period and were only now getting back to advanced country norms.  In fact, by 2017 we had among the highest hours worked per capita of any of the 40+ countries in my sample (Singapore is off-the-charts high, and South Korea comes second).

As a reminder, hours worked are an input not an output.  High (or increasing) hours worked is generally not some achievement to be celebrated, although there can be some caveats to that.

If the unemployment rate had been particularly high at the start of the period, one might genuinely welcome it dropping. Involuntary unemployment is, almost by defintion, a bad thing.  But when my comparisons started (in 1990) New Zealand’s unemployment rate was about the middle of the pack for the Anglo countries in the charts (by 2007 we had the lowest unemployment rate of any of them).

If you are uneasy that the welfare system accommodates too many people not working who should be providing for themselves, then successful welfare reforms might increase average hours worked per capita and that might then be regarded as a good thing –  whether fiscally, socially or whatever.  The proportion of working age adults on welfare benefits (ie including the unemployed) did drop quite bit in the 1990s and early 2000s.   But it was 10 per cent in 2007 and it was still 10 per cent in 2018.

Tax system provisions (or the interaction with pension rules) can also deter people from working when they might otherwise choose to.  New Zealand has a public pension system that specifically does not deter people from staying in the workforce after age 65 if they so prefer, and between 1990 and 2007 we increased the NZS eligibility age by a whole five years.  Personally, I think that was a desirable change, but the fact remains that high and rising hours worked per capita has not been a complement to some stellar productivity performance and improving opportunities.

In aggregate, more New Zealanders have been working more hours to –  in effect –  offset some of the relative income loss that our disappointing productivity performance would otherwise have led to.    As a country, our tenuous grip on upper-income status (really not much more than upper middle-income these days) is sustained only by working ever harder. That might be, in some sense, an appropriate second-best (for the individuals making those choices, reluctantly or otherwise). It is not obviously any sort of first-best outcome.

Capital gains taxes: some thoughts

It is a day for repeating some material from old posts. I haven’t yet read any more than a few news reports on the Tax Working Group’s report.  But I have debated capital gains taxes for years.   This was a post on the topic from 2017.  Here was the gist of my comments.   My bottom-line is that capital gains taxes aren’t the worst thing in the world, but mostly are a distraction from what should be the real issues.

Anyway, here are some of the points I make:

  • in a well-functioning efficient market, there are typically no real (ie inflation adjusted) expected capital gains.    An individual participant might expect an asset price to rise for some reason, but that participant will be balanced by others expecting it to fall.  If it were not so then, typically, the price would already have adjusted.  In well-functioning markets, there aren’t free lunches.    It also means that, on average, capital losses will be pretty common too, and thus a tax system that treated capital gains and losses symmetrically wouldn’t raise much money on average over time.   A CGT is no magic money tree.   And there is no strong efficiency argument for taxing windfalls.
  • if you thought, for some reason, that people were inefficiently reluctant to take risk, there might be some argument for a properly symmetrical CGT.  In such a system, the government would take, say, a third of your gains, but would also remit a third of your losses (the overall risks being pooled by the state).    The variance of an individual’s private after-tax returns would be reduced, and they might be more willing to take risk.   But, in fact, no CGT system I’m aware of is properly symmetrical –  there are typically tough restrictions on claiming refunds in respect of capital losses (one might only be able to do so by offsetting them against future gains).  There are some reasonable base-protection arguments for these restrictions, but they undermine the case for a CGT itself.
  • All real world CGTs are based on realised gains (and losses to an extent).   That makes it not a pure CGT, but in significant part a turnover tax –  if you never trade, you never pay (“never” isn’t literal, but tax deferred for decades discounts to a very small present value).    And that creates lock-in problems, where people are very reluctant to sell, even if their circumstances change or if a new potential owner could make much more of the asset, for fear of crystallising a CGT liability.  In other words, introducing a CGT introduces a new inefficiency to asset markets, making it less likely that over time assets will be owned by the parties best able to utilise them.
  • Basing a CGT on realised gains will also, over time, bias the ownership of assets subject to CGT to those most able to avoid realising the gains.  A long-lived pension fund, or even a very wealthy family, will typically be better able to  count on not having to sell than, say, an individual starting out with one or two rental properties, or some other small business, where changed circumstances (eg a recesssion or a divorce) might compel early liquidation.  Large funds are also typically better able to take advantage of loss-offsetting provisions.  The democratisation of finance and asset holding it certainly isn’t.
  • CGTs in many countries exclude “the family home” altogether.  In other countries, they provide “rollover relief”, enabling any tax liability to be deferred.  Most advocates of a CGT here seem to favour the exclusion of the family home, even though unleveraged owners of family homes already have the most favourable tax treatment in our system.  Again, a CGT applied to investment properties but not owner-occupied ones would simply trade one (possible) distortion for another.
  • In practice, most of the arguments made for a CGT in New Zealand have to do with the housing market.   But, on the one hand, all major (and minor?) parties claim that they have the fix for the housing market (various combinations of RMA reform, infrastructure reforms, changes to immigration, restrictions on foreign ownership, state building programmes or whatever).  If they are right, there is no reason to expect significant systematic real capital gains in houses.  If anything, real house prices should be falling –  a long way, for a long time.    Of course, prices in some localities might still rise at some point, if unexpected new opportunities appear.  But “unexpected” is the operative word.   Enthusiasm for a CGT, at least at a political level, seems to involve a concession that the parties don’t believe, or aren’t really serious about their housing reform policies.
  • Oh, and no one I’m aware of anywhere argues that a realisation-based CGT applied to (a minority of) housing has made any very material difference to the level of house prices, or indeed to cycles in house prices.
  • In general, capital gains taxes amount to double-taxation.    Think of a business or a farm.  If the owner makes a success of the business, or product selling prices improve, expected profits will increase.  If and when those profits are achieved, they would, in the normal course of affairs, be subject to income tax.  The value of the business is the discounted value of the expected future profits.  It will rise when the expected profits rise.  Tax that gain and you will be taxing twice the same increase in profits –  only with a CGT you tax it before it has even happened.   Of course, at least in principle, there is a double deduction for losses, but as noted above utilising losses (whether of income, or capital) is a lot more difficult.    If you think that New Zealand has had less business investment than might, in some sense, have been desirable,  you might want to be cautious about applauding a new tax that would fall heavily on those who took business risks and succeeded.
  • Perhaps double taxation of expected business profits doesn’t bother you.  But trying reasoning by analogy with wages.   If the market value of your particular skills has gone up, your wages would be expected to rise.  When they do you will pay taxes on those higher wages.  But by the logic of a CGT, we should capitalise the value of your expected future labour income and tax your on both that “capital gain” and on the later actual earnings.  Fortunately, we abolished slavery long ago, but in principle the two cases aren’t much different: if there is a case for a CGT on the value of a business, it isn’t obvious why one shouldn’t have one on the value of a person’s human capital.
  • (I should note here, for the purists, that there are other concepts of double-taxation often referred to in tax literature, none of which invalidate the point I’m making here.)
  • Real world CGTs also tend to complicate fiscal management?  Why?   Because CGT revenue tends to peak when asset markets and the economy are doing well, and when other government revenue sources are performing well.  CGT revenue doesn’t increase a little as the economy improves and asset markets increase, it increases multiplicatively.  And then dries up almost completely.  Think of a simple example in which real asset prices had been increasing at 1 per cent per annum, and then some shock boost asset prices by 10 per cent.  CGT revenue might easily rise by 100 per cent in that year (setting aside issues around the timing of realisations).  And then in a period of falling asset prices there will be almost no CGT revenue at all.   Strongly pro-cyclical revenue sources create serious fiscal management problems, because in the good times they create a pot of money that invites politicians to (compete to) spend it.  If asset booms run for several years, politicians start to treat the revenue gains as permanent, and increase spending accordingly. And if/when asset markets correct –  often associated with recession and downturns in other revenue sources-  the drying up of CGT revenue increases the pressure on the budget in already tough times.     It is easy to talk about ringfencing such revenue (mentally, if not legally) but such devices rarely seem to work.

None of this means that I think there is no case for changes in elements of our tax system as they affect housing.  The ability for business borrowers to deduct the full amount of nominal interest, even though a significant portion of that interest is simply compensation for inflation (rather than a real cost), is a systematic bias.  It doesn’t really benefit new buyers of investment properties (the benefit is, in principle, already priced into the market) but it is a systematic distortion for which there is no good economic justification   Inflation-indexing key elements of our tax system is highly desirable –  at least if we can’t prudently lower the medium-term inflation target –  and might be a good topic for a tax working group.  In the process, it would also ease the tax burden on people reliant on fixed interest earnings (much of which is also just inflation compensation, not a real income).

Of course, at the same time it would be desirable to look again at a couple of systematic distortions that work against owners of investment properties.  Houses are normal goods and (physically) depreciate.  And yet depreciation is no longer deductible.  Perhaps there was a half-defensible case for that when prices were rising seemingly inexorably –  but even then most of the increase was in land value, not in value of the structures on the land –  but there is no justification if land reform and (eg) new state building is going to fix the housing market.    Similarly, when the PIE system was introduced a decade or so ago, it gave systematic tax advantages to entities with 20 or more unrelated investors.  Most New Zealand rental properties historically haven’t been held in such entities.  There is no good economic justification for this distinction, which in practice both puts residential investment at a relative tax disadvantage as a saving option, and creates a bias towards institutional vehicles for holding such assets.  Institutional vehicles have their own fundamental advantages –  greater opportunities for diversification and liquidity –  but it isn’t obvious why the tax system should be skewing people towards such vehicles rather than self–managed options.  As noted above, any CGT will only reinforce that bias.  Funds managers, and associated lawyers and accountants, would welcome that. It isn’t obvious why New Zealand savers should do so.

And in all this in a country where we systematically over-tax capital income already.  I commend to readers a comment on yesterday’s tax post by Andrew Coleman, of Otago University (and formerly Treasury).  As Andrew noted:

Somehow, New Zealand’s policy advising community decided it would restrict most of its attention to the ways income tax could be perfected rather than question whether income taxes (which are particularly distortionary when applied to capital incomes) should be replaced by other taxes. It is almost as if we have the Stockholm Tax Syndrome – fallen in love with a system that abuses us.

A broad-based capital gains tax would just reinforce that problem.

2019 again. I hope the TWG report has dealt substantively with these sorts of points.  But I’m not optimistic.


Terms and conditions surely?

With various media reports around – and numerous annoyed locals –  about Wellington public transport operators failing to deliver contracted services (cancelling services) because they haven’t (note the choice of word) recruited and retained sufficient drivers, perhaps it is time to haul up from the archives a couple of posts I wrote early last year on these and related issues.  Those posts were focused on bus drivers, while the latest stories feature both buses and commuter trains.  I see that, once again, there is talk of overseas recruitment.

This was my first post, sparked by reports that one company was wanting to recruit abroad to fill its vacancies.

Extracts:

What prompted this post was the story this week about a bus company – Ritchies –  wanting immigration approval to recruit foreign bus drivers.  Bus drivers don’t make the list MBIE released of occupations for which there were more than 100 (so-called) Essential Skills visas issued last year, but these occupations were some that did.

Essential skills visa approvals 2016/17
Truck Driver (General) 400
Winery Cellar Hand 396
Waiter 345
Sales Assistant (General) 320
Personal Care Assistant 289
Massage Therapist 259
Baker 231
Painting Trades Worker 220
Builder’s Labourer 185
Kitchenhand 181
Fast Food Cook 118
Farm, Forestry and Garden Workers nec 116
Bar Attendant 102

On the face of it, such roles don’t seem notably more (or less) taxing than being a bus driver.  It is a responsible role, but not one requiring huge amounts of skills or training (according to the story I linked to above 6 to 8 weeks training suffices).    It isn’t the sort of role one naturally thinks of when officials and ministers talk about skills-focused immigration programmes.

The case Ritchies make is that they can’t find locals –  New Zealanders, or people already here –  to fill new roles.

Auckland Transport awarded Ritchies Coachlines the contract to run buses on the North Shore from September.

But the company said so far it had not been able to find enough drivers locally and had asked Immigration New Zealand if it could bring in 110 of them from overseas to plug the gap.

And I’m sure that is correct.  If you pay low enough wages, it is hardly surprising that people with other New Zealand options aren’t lining up to work for you.

At least on the union’s telling

“The problem with Ritchies is that they pay over a dollar an hour less than the industry so their retention rates are minimal. People get trained up then they’ll go to other bus companies where the rates are better. Again Ritchies brings it upon themselves.

On the face of it, it looks like another case of a service contract won largely on the basis of (assumed) low labour costs.

The company more or less acknowledges the point

Mr Todd said the company would continue trying to recruit locally but only had until late June before it would need to look overseas for drivers including in Fiji, Samoa and the Philippines.

He admitted the $20.20 an hour it paid drivers would be difficult to get by on in Auckland but said this was the budget it had to work with.

“Lets face it, any job in the world, if you pay enough, you’ll get people to do it but…those costs will have to be passed on.”

I don’t really see the specific company as the bogey-man here.  They are operating in an environment –  bidding for public contracts –  where the overall level of funding seems to implicitly rely on access to very cheap labour (in this case, according to the company, from Fiji, Samoa, and the Philippines –  the jobs presumably not being attractive to bus drivers from the advanced world, since New Zealand is now a low income advanced country).

The same goes, more or less, for some other public-funded industries. Rest-homes, for example, rely heavily on immigrant labour from poorer countries: the existing level of rest-home subsidies constrain their options pretty severely.  No individual firm has a great deal of market power.  But the overall market is nonetheless skewed by policy choices successive governments have made about access to immigrant labour to fill what are mostly quite modestly-skilled roles.

It is why we need not small tweaks at the margins –  should or shouldn’t bus drivers (waiters, kitchenhands, or whatever) be on the approved list – but an overhaul of the entire immigration system.

But as part of that we should:

  • establish a strong presumption against use of unskilled immigrant labour (which mostly –  although not entirely –  competes with and tends to drive down returns to domestic unskilled labour), and
  • get ministers and officials out of the game of determining which specific roles people can and can’t hire short-term immigrant workers for.

To that end, I’ve argued previously for a system in which Essential Skills visas are granted on these terms:

a. Capped in length of time (a single maximum term of three years, with at least a year overseas before any return on a subsequent work visa, with this provision to apply regardless of skill level).

b. Subject to a fee, of perhaps $20000 per annum.


And this was the follow-up post from a couple of weeks later.

Extracts

In a typical market, there aren’t sustained physical shortages –  the price adjusts.  If in this case the price (driver wages) wasn’t adjusting –  if anything there was a suggestion Ritchies would be paying less than the previous operator –  it suggested the plan was to close the gaps another way (bringing in more relatively unskilled people from abroad.)    Ritchies has moral agency in that –  they made a choice to bid that way, and should live with the consequences if it doesn’t work (if, for some reason, MBIE turns down their application to bring in relatively unskilled workers from abroad).   But I didn’t want to focus on the individual company, since they are responding to incentives set up by various arms of government –  Auckland Transport offering the contracts, and even more so MBIE (as part of the New Zealand government) in making immigrant labour relatively readily available for what are really quite unskilled roles.    And it isn’t as if Ritchies is the only company operating this way.   Another operator has won most of the bus routes in Wellington, to take over in July, apparently operating on very similar assumptions about access to new immigrant labour.

I had some comments directly from people involved in the industry, on both sides.  In substance they were making quite similar points.  As one observed, demand growth (in this case for bus drivers) can always be met by expanded capacity (immigration) or higher prices (or wages).  They went on to argue that the ability of some companies to import drivers meant they won contracts, and that it was as clear a case of immigration driving down wages as you could find.

Of suburban driver jobs, I observed last week

It is a responsible role, but not one requiring huge amounts of skills or training (according to the story I linked to above 6 to 8 weeks training suffices).    It isn’t the sort of role one naturally thinks of when officials and ministers talk about skills-focused immigration programmes.

One driver confirmed that training story noting that his employer

…took me on with just a car licence. They spent about 8 weeks training me up and paid for the costs of getting a heavy traffic licence and a P endorsement (essentially a “fit and proper” test.)

In terms of (price-based) evidence of labour market pressures, this driver observed that over five years or so his basic hourly rate has increased by only around 1 per cent per annum (if so, that would be less than the average rate of CPI inflation, so a reduction in real wage rates).

There seem to be a variety of ways to spin the story as to how much bus drivers are being paid, and what the new entrants (Auckland and Wellington) are offering or planning to offer.   …..[But] there doesn’t really seen to be much dispute that the new operators –  claiming an inability to find sufficient local labour –  are not offering drivers more than the current operators.  Indeed, the general sense seems to be that pay for equivalent effort would be less than at present.

And in a typical, well-functioning, market, when demand exceeds supply –  and not just for a day or two  –  the price of the product or service in question will rise (not fall).   Quite how much the rise will be will depend on the elasticities of supply and demand –  maybe a lot more potential drivers would emerge for slightly higher wages (or maybe not), and maybe bus patronage would drop away sharply with slightly higher fares (wages are by far the largest component in bus company costs) or maybe not.  But you wouldn’t expect to see the relevant price –  bus driver wages –  under downward pressure when there is incipient excess demand for drivers.

(It is not as if the outgoing operators have had abundant labour.  As one correspondent noted “Go wellington have about 340 drivers for the current contract but even with huge active recruitment and training from scratch they only get 100 new per annum which is as many as they lose”.)

In fact, the way the bus driver labour market exists seems to be possible only because our governments –  present and past –  have opened up a channel through which supply can be increased, at or below the current price.  Open up incipient excess demand at current –  or lower –  than prevailing wages, and then get in workers on a (so-called) Essential Skills visa.

Bus drivers aren’t an occupation that appears on the official “skill shortage list” (if they were there would no further labour market test involved for any firm wanting to hire foreign labour).  Occupations such as bricklayers, plasterers, bakers, and jockeys are on the list.   But not being on the list doesn’t mean bus companies can’t hire foreign drivers.  There are just more hoops to jump through –  which is why employers who think they might have multiple vacancies (like the bus companies) are strongly urged (by MBIE) to seek an “approval in principle”.

MBIE’s employer guide is here.   You’ll see that for unskilled or modestly skilled jobs, part of the required test is to check with WINZ as to whether there are New Zealanders seeking work they can refer to the employer.   Bus drivers are in that category…….

That looks mildly encouraging.  You can’t just offer the minimum wage (for a job in New Zealand typically paying $5 an hour more than that) and expect to get your approval in principle to bring in foreign workers.   But if your wage contract is a little different from other operators (perhaps base rates are a bit higher, but other payments are lower?)  or even if you can find one other company somewhere in the country paying the same overall rate, you have to wonder (based on total numbers approved if nothing else) how rigorous MBIE is in enforcing the test.  And why, for example, it isn’t given more prominence in their guide to employers?

Because, you see, MBIE is really keen that firms hire foreigners.    In fact, they have whole website pages devoting to extolling the virtues of immigrant labour –  so much so that one has to wonder whether they really see themselves working in the interests of New Zealand citizens.    Employers are told

“Hiring migrants is a great way for you to maintain and grow your business”

And then the first item under that “Why hire migrants?” employers are told

Migrant workers can do more than just fill a gap in your staffing. They bring with them an international perspective and connections, provide support to up-skill local employees, add diversity, and generally can help businesses to stay ahead of their competition.

The “international perspective and connections” being oh so important for bus drivers, bricklayers, or even the cafe or retail managers or aged care nurses (occupations topping the work visa approval list).    There is no hint for example that there might be any disadvantages –  eg lower returns to New Zealanders in similar occupations, or the simple fact that, in aggregate, migrants add more to demand pressures (including for labour) than they do to supply in the short-term.

If we are going to have government officials administering something like a mass market Essential Skills visa scheme, and deciding who does and doesn’t get approval, surely a key aspect of any labour market test should be something along these lines?

“has the effective wage or salary rate for this occupation risen materially faster than wages and salaries more generally in New Zealand over the past couple of years?”

If not, how can you seriously use the term “skill shortage”?    Even if wages in a particular occupation have risen faster than the norm, it takes time for locals to respond and shift occupations, so one wouldn’t necessarily want to jump at the first sign of a bit of real wage inflation in a particular occupation, but if after a couple of years the pressures were persistent then some sort of Approval in Principle for temporary migrant labour –  at wages at or above those now prevailing in the domestic market – might make some sense as a shock absorber.  But MBIE seems perennially averse to markets adjusting in ways the generate higher real wages, even though that outcome is one core part of what we look for from a successful economy.  Successive Ministers of Immigration –  from both main parties –  seem to buy in to the story, and believe that central planning by them and MBIE bureaucrats is going to work better than the price system.  It wasn’t a good system in the Soviet Union, and it isn’t here.

I can’t see a reason why we should be giving Essential Skills visas for suburban bus drivers, and we shouldn’t be creating a system where firms are encouraged to bid in the expectation that they can use that system, rather than pay a market-clearing wage for New Zealand resident workers.

More generally, I don’t think there is particular merit in a system in which officials are picking and choosing which firms can and can’t hire short-term workers.   As I noted in my previous post I favour something along these lines

To that end, I’ve argued previously for a system in which Essential Skills visas are granted on these terms:

a. Capped in length of time (a single maximum term of three years, with at least a year overseas before any return on a subsequent work visa, with this provision to apply regardless of skill level).

b. Subject to a fee, of perhaps $20000 per annum.

If an employer really can’t find a local hire for a modestly-skilled (or unskilled) position, they’d be able to get someone from overseas, but only by paying (to the Crown) a minimum annual fee of $20000.  It is pretty powerful incentive then to train someone local, or increase the salary on offer to attract someone local who can already do the job. If you can’t get a local to do a job for $40000 per annum, there might well be plenty of people to do it for $50000 (and still cheaper than paying the ongoing annual fee for a work visa employee).

There are lots of operational details that would need to be refined, but as a starting point it seems like a pretty attractive system.  In the current situation, if bus companies really can’t find New Zealanders to drive, they could hire foreigners, but would have to pay an additional annual fee to the Crown of $20000 for each approval (but also wouldn’t otherwise have to jump through bureaucratic hoops, legal fees etc).  I’d be really surprised if there were any bus drivers then on Essential Skills visas or –  reprising the list from my previous post – kitchenhands, waiters, or massage therapists.  But, you never know.   If the market price adjusted that much that it was still better to hire a foreigner, that price adjustment might be a pretty compelling argument for a rather more genuine “skill shortage” than what we have now.

Perhaps in the end, MBIE won’t allow the bus companies to hire immigrant labour to fill the vacancies.  I’d welcome that, but the bigger issue isn’t any particular role, but how the system as a whole is designed and operated.

That’s the end of the extracts from last year’s posts.  There are lots of words there, but surely the bottom line is that for any modestly-skilled occupation for which there isn’t a sudden totally unexpected change in demand (and the number of people wanting to use public transport just doesn’t fluctuate that much), persistent “shortages” tell you more about the wages and other terms and conditions being offered than they do about any real sense of unavailable labour?  People will typically pursue the best opportunities available to them.  Make bus (or train) driving somewhat more attractive –  which is what the market signals are suggesting should happen –  and some more people will be interested in, perhaps even keen on, driving a bus or a train.

And lets not allow the immigration system to be used to avoid responding to domestic labour market signals, especially in non-tradables parts of the economy.  There is a place for immigration –  a reasonably generous approach to refugees, and an openness to some really highly-skilled people who might want to settle here (probably quite a small modest number given distance, modest income relative to other advanced countries, and the revealed preference experience –  only a small proportion of our actual migrants have been particularly highly-skilled).

(And, to be clear, the overall wage effects of high immigration are ambiguous, in part because in aggregate immigration boosts demand more than supply in the short run, and there are repeated waves of migrants, and thus repeated short-runs.  I am not one of those arguing that immigration policy is driving wages systematically down.  This post is about the impact in specific localised markets, and even more about the rules regarding labour market tests.)

KiwiBuild: the Reserve Bank and crowding out

Last week, in association with the Monetary Policy Statement, the Reserve Bank published a short separate paper outlining how it was treating KiwiBuild for forecasting and monetary policy purposes.   The bottom line was

The Bank has assumed that half to three quarters of what KiwiBuild contributes to residential investment will be offset by crowding out of other private investment over the forecast horizon.

It isn’t that different an assumption than they have been making since the current government first took office.   This was what they wrote in the November 2017 Monetary Policy Statement

The Government has announced an intention to build 100,000 houses in the next decade…..our working assumption is that around half of the proposed increase will be offset by a reduction in private sector activity.

But, of course, then they refused to show us their workings or give us any supporting analysis.

I made brief reference to the new paper in my post last week on the MPS.  My main point then was to commend the Bank for publishing the separate paper, but in passing I noted.

(As it happens I remain rather sceptical of the assumption that KiwiBuild is going to be a significant net addition to total residential investment over the next decade.  Why would it, when the main issues in the housing market are land prices and, to a lesser extent, construction costs, and it isn’t obvious how KiwiBuild deals with either of them?  If it proves to be a net addition, it will probably be because it is a subsidy scheme for the favoured –  lucky – few.)

Today I went to spend a bit of time elaborating on that argument, and unpicking some of economic arguments in the Bank’s paper.

(Note that although the Bank’s paper has been reported as making difficulties for the government – and perhaps it has – in fact some of it is written as if it were a publication from the government.  It (repeatedly) talks of KiwiBuild houses as affordable, with no quote marks around that description/claim let alone any analysis of what affordability might really mean.  And there is the heartwarming talk of how it designed to “increase home ownership among New Zealanders”.)

The most puzzling aspect of the paper is that the Bank focuses wholly (but only partially) on one possible channel for crowding out and totally ignores another.

Their focus is on capacity constraints in the construction sector.   The claim is that there just isn’t enough labour, and that if the Crown insists on building 10000 additional houses each year it just won’t be possible, as there won’t be the workers.   That doesn’t seem a particularly compelling argument to me, at least over a multi-year horizon.

Over the past year, the national accounts records constructions (residential, non-residential, and other) of almost $40 billion in New Zealand.  Add on top of that (this is all hypothetical) say $2-2.5 billion of KiwiBuild spending a year (the government provision was $2 billion, and the Bank is assuming  –  after crowding out two-thirds –  a net total addition of $2.5 billion over three years) and it would represent an increase from the current level of not much more than 5 per cent.   And, sure, the construction workforce in New Zealand is quite large at present (240000 employed, in the HLFS) –  thus, the Bank argues it can’t really increase further –  but it looks to have been about the same size in Ireland at the peak of their construction boom, when their population was 10-15 per cent less than ours is now.    People change jobs, people postpone retirement, people put off going to Australia (as examples) if the price is right, if the good opportunities are there.  And, although the Bank’s analysis doesn’t mention it,  Australian residential construction activity is now tailing off quite sharply so – again, if the price is right –  you might expect some Australian builders, or expat New Zealanders, to try their luck back here.

I mentioned price a couple of times in that paragraph.    The Reserve Bank’s document doesn’t do so at all (aside from a couple of references to price caps on KiwiBuild houses).  Prices are signals and rationing devices.  You’d have thought the Bank’s economists would think to mention them.  In fact, prices (changes therein) are typically how crowding out works (eg in a fully-employed economy an increase in government spending will tend to boost demand, but will drive up interest rates and the exchange rate –  prices –  crowding out other activity and leaving the overall level of economic activity little changed.    But the fact that the multiplier might be zero doesn’t mean a central bank could just ignore a government that talked of a big increase in spending in a fully-employed economy.  Part of the crowding-out process arises from the monetary policy response (otherwise, it would happen through inflation).

And so the oddity of the Bank’s crowding-out analysis is that it seems to (a) focus on resource availability, and yet (b) simply assumes that the crowding out occurs without any associated price signals or inflation pressures.  Markets tend not to work that way.

At least in the abstract you would have thought the Bank would have wanted to treat the entire KiwiBuild programme as an exogenous boost to demand (whether or not they think it will actually happen their standard operating procedure is –  prudently so –  to assume that government policy is as stated), and then trace through the mechanisms whereby any crowding out occurs.  In this case, for example, one might perhaps expect to see higher wages, higher construction costs (a direct component in the CPI), and perhaps even a higher OCR (than otherwise) as part of the freeing-up/crowding-out process.   The bottom line still might have been the equivalent of half to three quarters of other investment crowded out. But how you get there matters.  If it is a resource constraint story, you can’t simply assume resource constraints have no price consequences.  But, as they’ve told the story, the Reserve Bank seems to have.

Of course, “capacity constraints” is a politically convenient story.  It links to government rhetoric on skills, for example, and even (fallaciously) to the government’s enthusiasm for immigration.  And it channels an implicit story –  never backed with evidence –  that there is some unexploited wedge out there in which, given current laws and regulation, construction material costs, and bureaucratic practices, new houses (including land) can be built more cheaply than current house (including land) prices.  It is only “capacity” –  or just possibly finance –  that holds us back.  I doubt any serious analyst really believes such a story.  There is also an implied story about homelessness –  as if there would be 300000 not housed at all (or grossly inadequately housed) if the government didn’t initiate 100000 new dwellings, “affordable” or otherwise.  Again, that just isn’t plausible.

So, although I do want to run a “crowding out” story, it is a quite different one than the Reserve Bank is spruiking.  On my story, there could be as many builders and associated tradesmen and labourers as you like –  resources flowing easily, with high elasticities, into building as required, with barely any change in prices –  and over any reasonable horizon (say, five to ten years) a credible government announcement that it will build 100000 more houses will, to a first approximation, reduce the construction of other houses by 100000 over that period.    It almost has to be that way because:

  • announcing that as a government you are going to build lots of houses doesn’t change land use law or land availability.  It is what it is –  whether in Auckland or elsewhere.  Everyone recognises that (artificially regulated) land scarcity is a huge component in the high cost of New Zealand houses.   Other government policy measures may yet act on the land use issues, but this is a debate about KiwiBuild, in the existing regulatory system,
  • announcing that you are going to build lots of houses isn’t likely to materially alter the price of building materials in New Zealand, and
  • it isn’t going to materially alter regulatory approval timeframes and related things that (for example) affect financing costs.

In other words the marginal supply price of a new residential property –  like for like in its features –  doesn’t change.    Fix those things and there will be more effective demand for houses from the existing (and projected) population: building activity could really step for quite a while (and some of those capacity constraint and resource pricing issues could be relevant for a few years).    But if you don’t change any of those things –  and KiwiBuild doesn’t materially change any of them –  you’ll end up with no more houses, unless (and only to the extent) that the government-sponsored construction doesn’t cover true costs, and effectively offers a subsidised entry to the market for the favoured few.  Even then, the effect will mostly be to drive out more private construction, but there might still – at least for a time –  be a net increase in the housing stock.

Rational owners of developable land (whether on the fringes or where there is scope for intensification) and potential developers will either know all this consciously, or discover it as they explore the economics of projects they have in mind. KiwiBuild isn’t like (say) a large scale government motorway expansion scheme, when the government has a monopoly on motorway supply.  If the government is determined to build more houses under its badge, there would then (prospectively) be more competition and the expected profits margins and the ability of the private developer to get the returns he or she hoped for will be undermined.  There aren’t super-profits in this business, and if projects no longer look as profitable, many just won’t proceed.   It isn’t as if the government can gear up housebuilding faster than they can either wind back their projects, or look to get their projects branded KiwiBuild, or their land and resources used for KiwiBuild.

To be sure, all this is highly-stylised.  Champions of KiwiBuild will tell me that the programme will build a specific type of house that the market isn’t building.  And perhaps that is even true, but there is plenty of substitutability within the housing market.  And my focus is primarily on the entire life of the planned KiwiBuild programme, whereas the Reserve Bank is (rightly) focused on the next two to three years, the period relevant to today’s monetary policy and related economic forecasts.   So I’m not suggesting one should automatically assume full crowding out without any further thought but rather that (a) capacity constraints are unlikely to be the main consideration (and in any case usually involve price/wage adjustments to make them happen) and (b) full crowding out is probably a reasonable starting point for analysts, who should then justify any deviations they believe it is warranted to assume.

Perhaps the designers and champions of KiwiBuild really believed it would boost home-ownership (as the Reserve Bank claims) or boost overall housing supply. It has always had more of the feel of something with a strong sense of “we need to be seen doing something” and “doesn’t the memory of nice M J Savage bring warm fuzzies memories/feelings to mind”.  Charitably, the official policy position of the Labour Party suggested they were actually going to fix the land market – in which case KiwiBuild would just have been an unnecessary (in economic terms) inefficiency.  Sadly, a few weeks short of halfway through the government’s term very little or nothing has been done on things that might make a real difference –  actually render decent housing affordable again –  while KiwiBuild has become a politically troublesome distraction.

Investment,the capital stock and some not-pretty pictures

(For anyone who followed a link looking for my post on the National Party and the PRC, it is here)

A few days ago one of my posts included the chart showing that there has been very little labour productivity growth in New Zealand for most of this decade.  A commenter asked

A question for you on the productivity flat line. Is it reflective of levels of investment? How does the productive capital stock per worker look over the last decade?

And so today I’ll try to step through some of the data that sheds a bit of light on that question.  As background, it is worth bearing in mind that for decades New Zealand business investment as a share of GDP has been relatively low by OECD country standards, especially once one takes account of our relatively fast population growth rate.  The biggest exception was that outbreak of government-inspired wastefulness, Think Big, in early-mid 1980s.  Not all investment captured in the national accounts statistics is “a good thing”.

First, some flow data.  Here is investment as a share of GDP (using quarterly seasonally adjusted data).

investment 1

Lots of houses repaired (Canterbury) and built (nationwide) but once you set residential investment spending to one side. the remaining investment as a share of GDP has been very subdued indeed, not really much higher than during the recession at the end of last decade.

There isn’t an official published series of business investment, so I use the same proxy the OECD does: start from total investment and subtract residential investment and government investment spending.   There is a small overlap there (some government residential investment spending), but with that caveat noted here is the proxy for business investment as a share of GDP.

investment 2

The only times this business investment proxy was lower than at present was in the depths of the two serious recessions (1991 and 2000-10).   And yet over recent years, our population was growing consistently faster than at any time in recent decades.  Businesses tend to invest when there are prospective profitable opportunities –  especially when financing conditions aren’t unduly constraining.  Presumably, those opportunities just haven’t been there in New Zealand in recent years.

My commenter’s question was about capital stocks.  Statistics New Zealand publishes net (of depreciation) capital stock data.  The upside is that there is a good long time series, but the downside is that it is annual data so that the most recent observation is for the March 2018 year.

Here are a couple of stock series, expressed as percentages of nominal GDP.

investment 3 
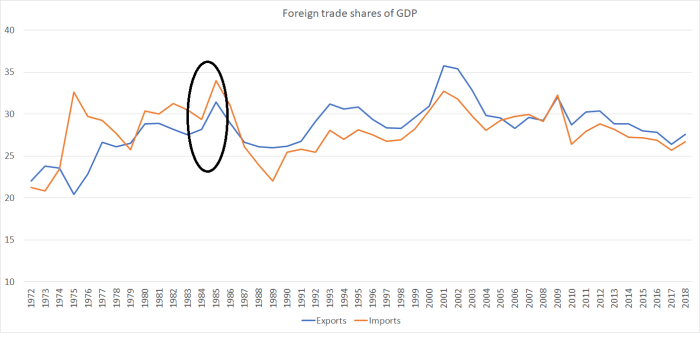
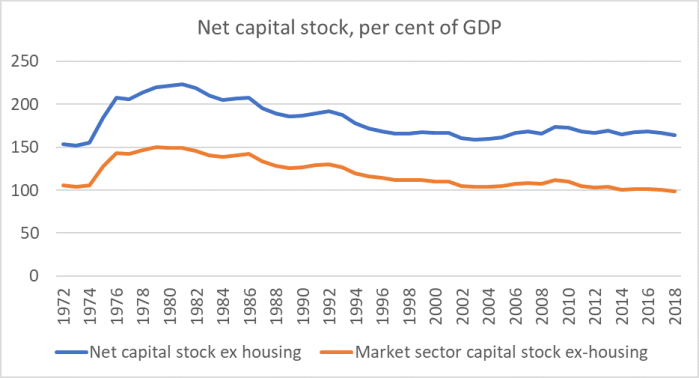
(I don’t know what accounts for the sharp lift back in mid-70s, but you can see the Think Big effect in the early 80s.)

Those were nominal (current price) series.   If we want to look at the capital stock relative to real variables (eg hours worked) we need to use the constant price data instead.  Here is the real capital stock, ex housing, per hour worked.

investment 5

I’m not quite sure what to make of the entire chart – I’m a little surprised there wasn’t more growth in the 1990s –  but for the more recent period it is certainly consistent with the (very weak) productivity picture.

Perhaps as sobering is this simple chart, showing the percentage increase in the real capital stock from the year to March 2008 to the year to March 2018.

investment 7

Pretty significant growth in the non-market component (the bits not subject to market tests, either at the evaluation stage or in operation, and basicially set by government –  central or local) relative to the growth in the market sector non-housing capital stock.  Firms operating in more-or-less competitive markets just don’t seem to have seen the remunerative projects to invest in.   That isn’t in any fundamental sense the “cause” of our really weak productivity growth, but it will be a reflection of the same factors.

On my telling, the persistently high real exchange rate is, in turn, a significant proximate part of that story.

1984 and all that

Eric Crampton of the New Zealand Initiative yesterday sent out a couple of tweets drawn from some pages a reader had sent him from Wellington’s evening newspaper of 18 July 1984.    The general election had taken place on the 14th and the foreign exchange market had been officially closed for a couple of days as everyone awaited resolution of the political disputes around who would take responsibility for the by-now-inevitable devaluation.  The outgoing (but still caretaker) Prime Minister finally buckled and a 20 per cent devaluation was announced on the 18th.   It marked the beginning of almost ten years of pretty thoroughgoing economic reforms, the legacy of which (good and ill) is still with us today.

Anyway, here were Eric’s tweets

(Click on the right-hand side of the first page and you can read a “fake news” story from 1984, how the Evening Post fell for a Michael Cullen hoax press release.)

Eric’s tweets sent me down to the garage and my box of old newspapers from (in)auspicious days.  I didn’t have that particular one, but I did find one from a couple of days earlier.  In that paper there was an advert for a competition offering as a prize a microwave with a retail value of $1495 –  $4800 in today’s money.   Whether you run with Eric’s microwave advert or mine, there is no doubt some things are dramatically cheaper (in real terms) than they were then.  Of course, for many technology items that will be true everywhere; it isn’t primarily a New Zealand story. Actually, flicking through that old paper it was the car prices that surprised me more: a two-year old Ford Cortina advertised for $18995 ($61000 in today’s money).   The New Zealand car assembly industry then really was very heavily protected.

Eric notes “we forget too quickly what a mess the place was in”, which reads a little oddly when he did not, I gather, come to New Zealand for another 20 years.  But setting that quibble to one side, and taking on board my own youthful enthusiasm for most or all of the reforms being done at the time (most of which still seem right and/or necessary), I think that with the benefit of hindsight the picture is rather more mixed than perhaps Eric suggests.

On the macro side, the problems were all-too-evident.  Fiscal imbalances were large and the balance of payments current account deficit was large.  If debt levels (government and external) weren’t that high by the standards which too much of the advanced world has since become used to, they were a huge departure from New Zealand’s post-war experience.  Inflation was partially suppressed by a series of freezes –  although Muldoon had lifted the price freeze a few months earlier –  supported by a series of interest rate controls, which were undoing the partial financial liberalisation of the 1970s.   Outside the control of any government, the terms of trade had been trending down for 20 years, and New Zealand material living standards and productivity had been falling behind those nearer the upper ranks of the OECD group.   We were still in the construction phase of that disastrous set of wealth-destroying government sponsored energy projects known as “Think Big”.  And if protective barriers were slowly being removed –  for example, CER was inaugurated the previous year –  it was a slow and halting journey at best. High protective barriers not only made many goods unnecessarily expensive to New Zealand consumers, but acted as a heavy tax on actual and potential New Zealand exporters.  Much about the tax system was in a mess.

And yet, and yet.

The unemployment rate in June 1984 (from Simon Chapple’s work backdating the HLFS) is estimated to have been 4.4 per cent.  Right now it is 4.3 per cent –   and 4.3 per cent is well below the average for the last 20 years, while the 1984 was well above the comparable average.

Or house prices.  I started looking to buy a first house a few months later, in early 1985.   Single 22 year olds could do that sort of thing in those days.  Yes, concessional Reserve Bank staff mortgages would have helped, but I recall looking at various houses in Island Bay and Newtown for about $80000.  That’s less than $250000 in today’s money.   The same houses now look to be perhaps $750000.    That mess was created by some of the post-1984 reforms.

Or productivity.  In that old newspaper I dug out of the garage I found a post-election op-ed written by Len Bayliss, then a leading New Zealand economist.  Among the five major economic challenges he identified for the new government was this

Fifth –  extremely poor productivity growth, and more recently GDP growth, have been the subject of a series of economic reports since 1962.  As a consequence of this poor performance, other countries’ living standards have risen more than New Zealand’s.

The worst single period for productivity growth in New Zealand history was in late 1970s, but even 35 years ago people knew that the problems were much more deep-seated.   Unfortunately, of course, the productivity gaps are now larger than they were in 1984. On OECD estimates of real GDP per hour worked, in 1984 we were close to the levels in Iceland, Ireland, and Finland.  These days, we are far behind each of them.   We were only about 10 per cent behind the UK in those days, and now they are about 30 per cent ahead of us.    Things might not be in such a “mess” nowadays –  disorderly macro imbalances and weird interventions –  but the economic bottom line still makes sorry reading.   No champion of change in 1984, told all the policies that would be adopted and the huge measure of macro stability achieved, would have predicted that we’d have drifted further behind by 2019.

Perhaps especially if they’d been given the additional information of what would happen to New Zealand’s terms of trade over the subsequent decades – the turnaround (outside any government’s control) starting just a couple of years after the reform period got underway.

TOT annual

The devaluation in July 1984 was a huge part of the economic narrative at the time.  There was a strongly-held consensus, among local officials, local commentators (it is explicit in that Len Bayliss article) and international agencies, that the New Zealand real exchange rate had become persistently out of line with fundamentals, and that a substantial and sustained depreciation would have to be a significant part of putting the economy on a better-footing.   It was, among other things, a repeated and urgent theme of the numerous meetings I attended, as a junior note-taking official, in late 1984.

And here are the two OECD measures of New Zealand’s real exchange rate.

RER 84

I’ve marked the 1984 devaluation.  In real terms, it proved very temporary indeed.    It would be great if really strong and sustained productivity growth had supported a structural increase in the real exchange rate.  But that, of course, hasn’t been the story.  Once we got through the disinflation period –  when it was reasonable to expect some temporary periods with a high real exchange rate –  it seems to reflect the same sort of domestic demand pressures that have given us persistently among the very highest real interest rates in the advanced world.

And then there is foreign trade.  A narrative at the time was the heavy protection had resulted in New Zealand’s foreign trade shares of GDP falling, or failing to grow.  The overvalued exchange rate (see above) further impeded the prospects of potential export industries, probably only partly offset by the various (highly questionable) export incentives and subsidies.

And yet

trade shares feb 19

I’ve circled the data for the years to March 1984 (latest actuals when the devaluation happened) and for the year to March 1985.  There was, as you would expect, a short-term boost to the nominal trade shares on account of the devaluation, but of course that didn’t last.  But if we take the subsequent 33 years together, there is just no sign of foreign trade having become more important to the New Zealand economy  (as it happens, exports as share of GDP in the year to March 2018 were almost identical to those in the year to March 1984).  Only one other OECD country has not seen the export share of GDP increase over that time.

I don’t want to kick off a futile debate about whether the reforms should have been done.  I’m still squarely in the camp that most should have been.  But, equally, nothing is gained by pretending to a degree of economic success we haven’t achieved.   We’ve shared –  with every market economy (and probably the non-market ones too) –  the rapid declines in the cost of various technology goods and services.  All of our own doing, we’ve managed to bring about, and sustain, an impressive level of macroeconomic stability.   But, equally all of our own doing, we’ve managed to rig the housing market against the current (and next) young generation, and despite reducing or removing all manner of protective barriers (and even getting other countries to do something similar for stuff New Zealand firms exports), foreign trade shares are no higher now than they were on that momentous day in 1984.  And, as for productivity, poor –  and rightly alarming –  as it was then, all indications are that it is worse now, and there are no signs of  those gaps beginning to close.

The New Zealand economy isn’t in some disorderly mess at present.  But if it is perhaps more orderly, it is failing nonetheless.

How much equity do banks voluntarily choose?

The Reserve Bank Governor is proposing that banks should have to fund a much larger share of their balance sheet with equity rather than debt.  So weak is our system that one unelected person –  on this occasion, one without much specialist expertise – can, more less on a whim, compel bank shareholders to either put billions of dollars more into their businesses, or to markedly downsize those businesses (most probably some combination of the two).    So long as the Governor jumps through the right procedural hoops, there are no appeals, and there is little formal public accountability.     Perhaps political pressure will mount on the Bank?  In these circumstances, one can only hope so.

Today I wanted to focus on a couple of strands in the arguments often used by academics and regulators to support the case for higher minimum capital requirements.   (Upfront I should say that they were arguments I used to be persuaded by, and to deploy myself.)  The post is a bit discursive: I’ve partly used writing it to help clarify my own thoughts.

Champions of higher bank capital ratios often note that bank capital ratios a hundred (or more) years ago were materially higher than those we observe today.    A good example of what they have in mind is this chart, taken from a speech a few years ago by a senior Bank of England official.

capital ratios

These aren’t, typically, risk-weighted capital ratios, just capital as a percentage of total assets.

One argument tends to run along the lines that if bank capital ratios were so much higher then, it could hardly be harmful for them to be much higher now.  And that claim is buttressed by the observation that deposit insurance (and a more general tendency for governments to bail-out all creditors of large banks) should have tended to reduce the  capital ratios banks would choose to run, in ways that are not necessarily socially desirable.   Thus, it is argued, one can’t deduce anything from observed capital ratios in recent decades since they, so it is argued, just result from subsidies (implicit or otherwise) to banking.   These sorts of arguments are made extensively by, for example, Professors Anat Admati and Martin Hellwig in their 2013 book The Bankers’ New Clothes  (Admati and Hellwig have both been recent professorial fellows at the Reserve Bank, Admati in 2016 and Hellwig late last year).

In principle, there is clearly something to the argument.   Were governments to guarantee all bank creditors full and timely payment of all their claims, and impose no obligations on banks (shareholders or management) in return, some banks might well rationally (if dishonourably) choose to run with hardly any capital at all: all losses would be borne by the taxpayer and all gains would be captured by the shareholders and promoters.

That, of course, isn’t the world we live in.  Even in places where there is deposit insurance (these days, most advanced countries other than New Zealand), wholesale and commercial creditors aren’t guaranteed.   And even when there is a strong too-big-to-fail presumption around some institutions (probably including the big banks in New Zealand) that presumption doesn’t apply to all institutions –  and even when the presumption exists, it is never held with certainty.

Many writers in this area come from countries with pretty comprehensive deposit insurance (from a depositor perspective, the system is the same whether you bank with Wells Fargo or some one-branch bank in the middle of nowhere).  But that isn’t so in New Zealand, so we should still be able to garner some useful information from the choices made around banks where there is, almost certainly, no strong expectation of a bailout.   This chart is from the Reserve Bank’s dashboard.

capital ratios dashboard

The regulator-required minimum capital (to risk-weighted assets) ratios are all the same (with the temporary exception of Westpac, after the never-adequately accounted for episode discussed here).   But what is striking is that there is no systematic difference between the actual capital ratios of the big-4 locally incorporated banks and those of the four smallish New Zealand owned banks.

Perhaps you see things differently, but I’d assume that depositors (and probably all other creditors) in the big-4 would end up fully-protected in any event much short of the physical destruction of New Zealand.  Between parent support and the political imperatives, that seems a pretty safe bet (at least a 95 per cent chance).  Neither the parent nor the government is charging upfront for that likely support.  I’d also assume Kiwibank creditors would be bailed out, for a slightly different mix of reasons (it is still 100 per cent government-owned).   And, on the other hand, the chances of the Crown bailing out creditors of the four small New Zealand banks  –  other perhaps than in a crisis that was taking down the whole system –  seem much much smaller.  It might even be credible to suppose that the OBR tool would be used if one of those banks were to fail.

And yet there is a striking similarity in the capital ratios across all these banks (and a striking similarity in the margins above minimum regulatory requirements). It doesn’t appear that consistent with a story in which the big banks are now able to get away with artificially low levels of capital because of the actual or implied bailout and guarantee risks.   And that is especially so when one recognises that none of the four small local banks has a deep-pocketed parent who might be prevailed on to recapitalise the bank if it got into trouble.

There is a caveat to this comparison.   The smaller banks (including Kiwibank) have to use the standardised approach to calculating regulatory requirements, while the big four are allowed to use (a constrained form of) their own internal ratings-based models.    For many assets, the latter approach will result in a bank being required to use less equity funding (for the same actual loan) than is required under the standardised approach (narrowing that gap is one aspect of the Reserve Bank’s current consultation).  If the big-4 banks were required to report on the same basis as the other banks, their reported capital ratios would be somewhat lower, but it wouldn’t change the fact that none of the smaller New Zealand banks have actual total capital ratios now as high as what the proposed Reserve Bank requirements will involve in the future (taking account of the buffers above regulatory minima banks will choose to maintain).

So how do we think about the long-term historical experience, of the sort captured in that earlier Bank of England chart?  If we go back 140 years, British banks in this sample had ratios of equity to total assets of around 15 per cent, and US banks something more like 23-24 per cent.

If we are thinking about a small listed New Zealand bank mostly doing business lending, I was interested to see from Heartland Bank’s latest disclosure statement that total balance sheet equity was about 14.7 per cent of total balance sheet assets.

But if we are comparing big New Zealand or Australian banks to those in the US or the UK in 1880, we are really comparing apples and oranges.   The biggest single difference is the predominant nature of the credits.   The biggest single chunk of loans on the balance sheets of New Zealand banks now are residential mortgages (followed by farm mortgages) –  secured by the considerable collateral of the underlying assets. Nineteenth century banks were typically didn’t lend to house purchasers (or farm purchasers) –  for that matter, 1960s trading banks in New Zealand didn’t either.      Loan losses on diversified portfolios of residential mortgages loans are not typically high.  My supposition –  I haven’t checked this story out –  is that 19th century banks will also have typically had larger peak exposures to a small number of borrowers.

In the US in particular, geographic diversification was often almost impossible to achieve (branch banking restrictions and all that).  You might reasonably respond that New Zealand is small, but even today New Zealand has slightly more people than the median US state, and most US banks were historically more tightly constrained than even a single state (one of the reasons they’ve had repeated banking crises and, say, Canada hasn’t).

And one could add that 19th century Britain and the United States were countries with fixed exchange rates, the US wasn’t long out of a civil war, and other aspects of its monetary system made its banks prone to liquidity crises.  The experience of the last 50 years or so –  with floating exchange rates –  is that countries with fixed exchange rate have more difficulty coping with economic shocks than countries with floating exchange rates.    We’ve seen that most recently in places like Ireland and Spain.

It may also be relevant to note that 140 years ago concepts of limited liability (including in banking) were still relatively new.  It takes time for the market (broadly defined) to work out what financing structures are sustainable and appropriate, balancing risk and opportunity.

We have another class of financial intermediaries in New Zealand that, almost certainly, no one expects would be bailed out if they got into trouble.  Non-bank deposit-takers  are now under the regulatory oversight of the Reserve Bank, with minimum capital requirements imposed by the Minister of Finance by regulation.  But these are minima only.  If there is no credible expectation of a bailout if things go wrong, any capital ratio materially above the regulatory floor must presumably reflect the judgement of shareholders, depositors, managers etc about the best (for that firm) mix of debt and equity.  I don’t have time or energy to go through the accounts of all the NBDTs, but I dug out those for the Nelson Building Society, a longstanding entity that mainly does residential mortgage lending, and without a huge amount of geographic diversification.  They report a risk-weighted (using RB approved weights) capital ratio of 10.09 per cent (equity is 6.7 per cent of unweighted total assets).  NBS’s credit rating isn’t particularly high –  were I a depositor I’d probably be keen on them having a higher capital ratio – but for a small not-overly-well diversifed lender, there is no sign of the market demanding anything like the 20 per cent (risk-weighed) capital ratios that will be implied by the Reserve Bank’s current proposals.  (Checking another building society, the Wairarapa Building Society reports an 11.7 per cent risk-weighted capital ratio.)

Finally, I suspect a great deal of the push for higher capital ratios is at least buttressed by the Modigliani-Miller story.   One of the Bank of England papers in this area (one of those cited by the Reserve Bank) gives this nice summary of the idea

Modigliani and Miller (1958) showed that, under certain assumptions, moving to higher levels of funding in the form of common stock, and therefore lower levels of debt and financial leverage, would leave the total cost of funding unchanged. In particular, the Modigliani-Miller (MM) theorem implies that as more equity capital is used, return on equity becomes less volatile and debt becomes safer, lowering the required rate of return on both sources of funds. It does so in such a way that the overall weighted average cost of funds remains unchanged. This idealised situation represents the case where there is a complete (100%) offset in relative funding costs as the debt and equity compositions change.

In other words, financing structures don’t really matter much (on certain assumptions), leading to a view that it doesn’t really matter much then if officials and regulators insist on one financing structure (a large share of equity) over another.   Pretty much everyone accepts that Modigliani-Miller (MM) doesn’t hold perfectly, but equally that it does hold to some extent (all else equal, over time, expected returns will be lower  –  and less volatile –  in a business with a greater share of equity funding).    One of the reasons MM often doesn’t hold fully in practice is the tax system: most tax systems tax equity returns more heavily than debt returns (often double-taxing equity returns, both when earned in the company and then when distributed to the owners).

But that wrinkle isn’t an issue for locally-owned institutions in either New Zealand or Australia (both countries run dividend imputation systems).  In other words, even if there is a systematic bias away from equity in other countries (including in the financial systems), there is no reason to expect to see it here, for locally-owned entities.  So when we look –  see above –  at the risk-weighted capital ratios (or simple ratios of capital to assets) for small New Zealand owned financial entities, not only is there little or no bailout risks factored into the chosen ratios, but there should be no tax system bias either.

More generally, if MM were the key insight on financing structures –  as distinct from being one element in a complex mix –  shouldn’t we expect to see capital ratios scattered almost randomly between (something close to) zero and a hundred per cent?  After all, the financing structure doesn’t affect the total cost of finance.  But that isn’t what we see at all.  Sure, there are some companies (even listed ones) that choose to have no (net) debt at all, although even that choice seems often to relate to anomalies in the tax system.  Financing structures tend to bunch by industry, suggesting in each case something about the nature of the industry itself influences those choices (something that won’t always be apparent to keen regulators).  That appears to be true for the financial sector as well –  even in parts of it where there is no credible bailout risk.

I’m not opposed to regulatory minimum capital requirements.  If governments are going to either provide deposit insurance, and/or behave in ways that create a perception of probable bailouts, some regulatory minima are almost certainly needed.   But where there is no deposit insurance, and there is little or no bailout risk, private market choices about financial structures in banking look as though they should tell us something about the economics of the industry.   All else equal, there might be a good case for ensuring that minimum ratios for banks that might be expected to be bailed out are in the ballpark of those intermediaries with no such (probable) assurances.  But in a New Zealand context, there doesn’t seem to be anything in the practice of those smaller institutions that would point in the direction of regulatory minimum capital requirements anywhere near as high as what the Reserve Bank is proposing.

Sadly, it probably won’t surprise you now to know that in their consultative document the Reserve Bank does not engage with these sorts of perspectives or experiences at all.

On another matter, I noted the other day that someone had started a Twitter account linking to various posts from this blog.   Having listened to the arguments of the (anonymous to me) person behind that account, I have activated a Twitter account of my own.  Not many of my arguments usefully reduce to 280 characters, so for now anyway I expect to use it mainly for links to new posts, or perhaps the occasional article that I think readers might find interesting or an old post relevant to some topic that has come to the fore again.

The PM’s economic plan

I read the Prime Minister’s economics speech yesterday. I wasn’t impressed.  There is simply no sign that she cares one jot about New Zealand’s decades of underperformance or that she has any sort of analytical framework (herself or from her advisers) for even thinking about the issue.  It may be repetitious to say so –  as a reader this week suggested –  but the utter unseriousness about our ongoing relative decline really matters; perhaps not directly or much for many people my age or older, but for our kids, and their future kids.  Including for the question of whether the next generations even stay, rather than joining the million or so New Zealanders (net) who’ve left over recent decades.

She continues to perpetuate what are little more than lies

“…on key economic measures the Government is delivering”.

That would be the economy with no productivity growth, with foreign trade flat or falling as a share of GDP, and with houses that are increasingly unaffordable to younger generations.  Some delivery.

She runs a fairly conventional story about risks in the global economy, and keys off a line from the IMF Managing Director suggesting that “policymakers need to make greater efforts to prepare for the slowdown”, noting that “that is a message we are heeding”.

That’s why our economic plan includes the following key planks:

  • Doubling down on trade and broadening our trading base to protect our exporters and economy
  • Reform of skills and trade training to address long-term labour shortages and productivity gaps in the New Zealand economy, and to make sure we are prepared for ongoing automation and the future of work
  • Changes to tax to make the system fairer
  • Addressing our long-term infrastructure challenges
  • Transitioning to a sustainable carbon-neutral economy
  • And of course investment in wellbeing, because this is inextricably linked to our economic success too.

Not one of those strands really has anything much to do with coping with a cyclical downturn (getting onto the Reserve Bank to deal with interest rate lower bound might,or even arguably something around fiscal policy), but even if one takes them as the components of a longer-term economic strategy it is underwhelming at best.

Take trade, nothing the government is doing (and there is a page of it in the speech) is any different than the previous government was doing.  You might approve of that approach or not, but the point is that during the term of the previous government foreign trade fell as a share of GDP.  The latest Treasury forecasts, prepared on current government policy, didn’t suggest any reversal.

No one supposes that a capital gains tax is going to make any material difference to the productivity/efficiency of the New Zealand economy.  As the Prime Minister says, the goal there is “fairness” –  which might be a perfectly reasonable argument, but there is no credible story in which it makes us in aggregate materially better off as a country.

Despite its appearance in the list, there was nothing in the speech about those “long-term infrastructure challenges”.  Lots has been spent on infrastructure over the last 15 years – when productivity growth was feeble, tailing off to non-existence, so why should we (or her audience) think things will be different now.  And is there any sign of using the infrastructure we already have more efficiently –  eg congestion pricing in Auckland (and perhaps Wellington)?

As for the carbon-neutral economy, that might on some tellings be a worthy or even noble objective.  But the government’s own consultative document last year reported estimates that achieving that goal would cost anything between about 10 and 20 per cent of 2050 GDP.   Some people dispute those estimates, but I’ve not seen any credible story in which New Zealand’s aggressive pursuit of carbon-neutral would make us economically better off.

As for “investing in wellbeing”, I guess she has to include at least one reference to this vacuous project. But it, after all, involves a de-emphasis on economic performance, not lifting that performance.  In discussing wellbeing in her speech, she is openly complacent about GDP growth, rather than giving any sense that we really need to be doing a lot better (productivity etc) if many of the other aspirations society has are to be met.

Which brings us to skills, which gets 2.5 pages in the speech, apparently a prelude to whatever specific reforms are being announced next week.  Labour has long been keen on pushing the line that a significant part of lifting productivity in New Zealand involves lifting “skills”.  I guess it sounds good –  whether workers or firms, who is likely to object.

Except, of course, that OECD cross-country comparative data suggests that adult skills levels in New Zealand are already among the highest in the OECD.   I wrote about this in a post a couple of years ago, and here are some of the charts and text.

Here is how our adults scored on literacy.

oecd literacy 2

And numeracy

oecd numeracy

And on “Problem-solving in technology-rich environments”

oecd problem solving

Looking across the three measures, by my reckoning only Finland, Japan, and perhaps Sweden do better than New Zealand. Perhaps there is something very wrong with the way the survey is done, and it is badly mis-measuring things, but those aren’t usually the OECD’s vices. For the time being, I think we can take it as reasonably solid data. And the broad sweep of the cross-country results makes some sort of rough sense: typically the poorer countries are to the left of the charts (relatively less highly-skilled).

And when the OECD lines up the skills scores against the productivity data one of the largest gaps (lagging productivity) is for New Zealand   The cross-country scatter plots don’t show a tight relationship by any means, but they do tend to suggest that the skills and talents of our people aren’t what holds New Zealand back.

Sure, it looks as though our schools could usefully focus on teaching maths better, and no matter what the aggregate scores some individuals will almost always lag behind.  But as some sort of centrepiece of an “economic plan”  skills just isn’t an obvious place to start.   The Prime Minister and her advisers might find it more rewarding to start with areas in which New Zealand more visibly stands out: persistently low rates of business investment, persistently high real exchange rates, and persistently high (relative to other countries) real interest rates.  But I guess confronting some of those stylised facts might raise questions about economic policy over recent decades that they would rather avoid.

In the midst of her section on skills, these sentences caught my eye

Take the building sector for example. We know we need more tradies and they are just not coming through fast enough.

That’s absolutely no reflection of the people who are involved in the sector – far from it. What it is, is a damning statement that the system has been left to drift, to muddle through.

Perhaps, but count me a little unconvinced.  Here is Quarterly Employment Survey data on construction sector jobs as a share of total filled jobs, back to 1989.

construction jobs.png

There are roughly twice as many people employed in construction as there were in 2002, and the increase in the share of the total workforce is really huge.   I’m not convinced it is a particularly helpful sign that 9 per cent of our total workforce has to be employed just building houses and shops for each other, but it is what happens when policymakers have turbocharged population growth.  Perhaps more relevantly, the construction sector is highly cyclical –  globally –  and if I were counselling a young person about possible career options I’d be suggesting that a construction sector workforce as high as 9 per cent of the total isn’t that likely to last for long. But no doubt the Prime Minister sees things differently.

If there is any sign of a plan, it isn’t one that is going to do anything to lift our economic performance, in the short or longer-term.   All indications are that the Prime Minister doesn’t care.  More worrying is the possibility that neither do many of her audience –  comfortable successful business figures, mostly doing well out of an economy skewed increasingly inwards.

Someone needs to cut through the indifference of the political and economic establishment.  But it won’t be the Prime Minister’s party –  or her allies or the National Party.