Switzerland of the South Pacific: cargo cult thinking?

One of the odder articles to appear in the local media over the holiday weekend was Fran O’Sullivan’s piece in Saturday’s Herald, headed “Key’s vision: Switzerland south”.  I’ve been critical of the Prime Minister in a few posts recently, but when I first saw the O’Sullivan piece I wondered if she was really reporting the Prime Minister or building up a creation of her own.  But after several re-readings, I think she must really be reporting the views of our Prime Minister.

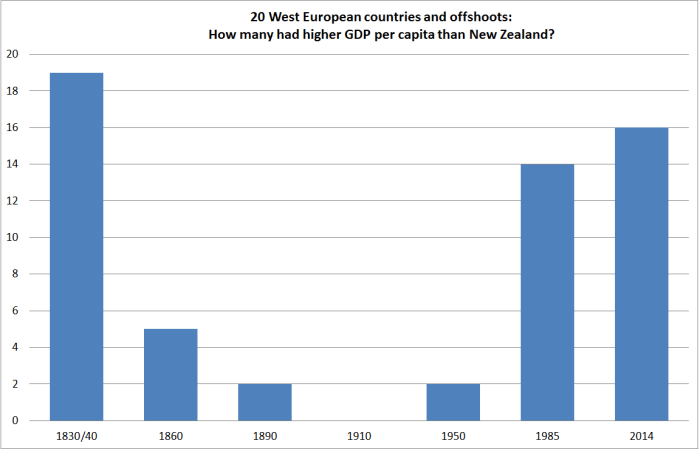
Of course, we have been this way before.  In the midst of the 1980s reforms, before the commercial property and equity bubble burst leaving us with a serious financial crisis, people like Michael Fay and David Richwhite used to give speeches talking of building a Switzerland of the South Pacific here in New Zealand.  Implausible as it may have been, my memory was of a positive vision – a liberalized economy would stimulate investment and entrepreneurship (and probably a large financial sector led by Fay, Richwhite?), enabling us to generate once again per capita incomes more akin to those in Switzerland(we’d matched or exceeded them as late as the 1920s).  In the climate of the times, in the early post-ANZUS days, Switzerland’s armed neutrality probably added to the appealing imagery.  Of course, it all came to pretty much nothing.  Switzerland remains one of the most prosperous advanced economies, while we languish as the slightly embarrassing poor relation.  Fay and Richwhite, as it happens, ended up relocating to Switzerland.

But John Key’s image is a much less positive one – New Zealand as a “beautiful and wealthy bolthole for high net-worthers seeking to escape from an unstable world”.

We are told that

Key believes that free-flowing terrorism is here to stay. To the Prime Minister, this simply makes New Zealand more attractive and will result in more high net-worth consumers wanting to come here

and

But Key contends it is the fear of terror – which has been happening over a long time – which is the driver for Europeans to up sticks and leave.

complete with talk of

If Donald Trump is elected President (assuming he first gets the Republican nomination) there may be a new outflow if his political bombast becomes reality.

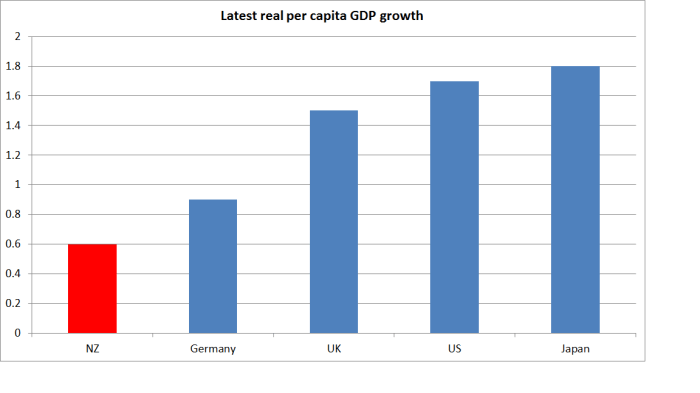
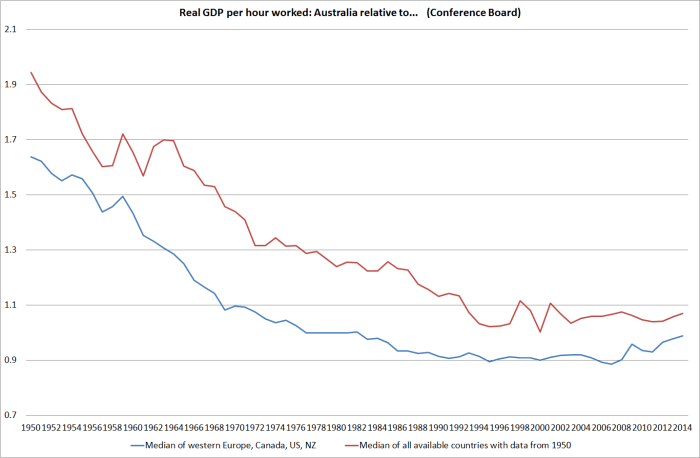
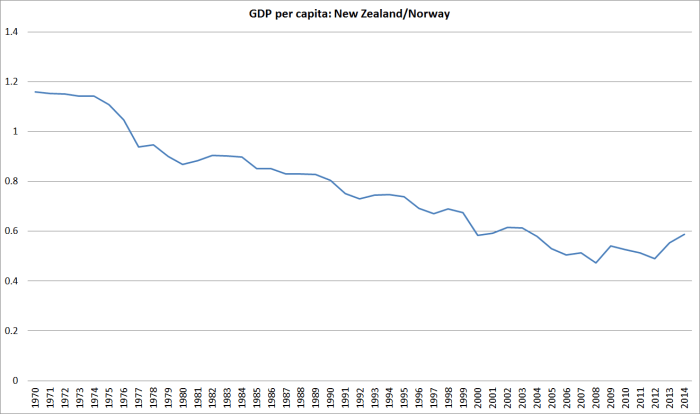
Haven’t we heard all this before?  People allegedly about to flee the US if, say, George W Bush was re-elected.  Or people fleeing to New Zealand in the 1980s to escape the nuclear peril of the late Cold War tensions.  And where are we today?    Our per capita incomes and productivity relative to the rest of the world just keep on drifting slowly further behind.

And what about terrorism?  Tyler Cowen included a link the other day to this chart of annual terrorism-related deaths in Western Europe since 1970

chartoftheday_4093_people_killed_by_terrorist_attacks_in_western_europe_since_1970_n

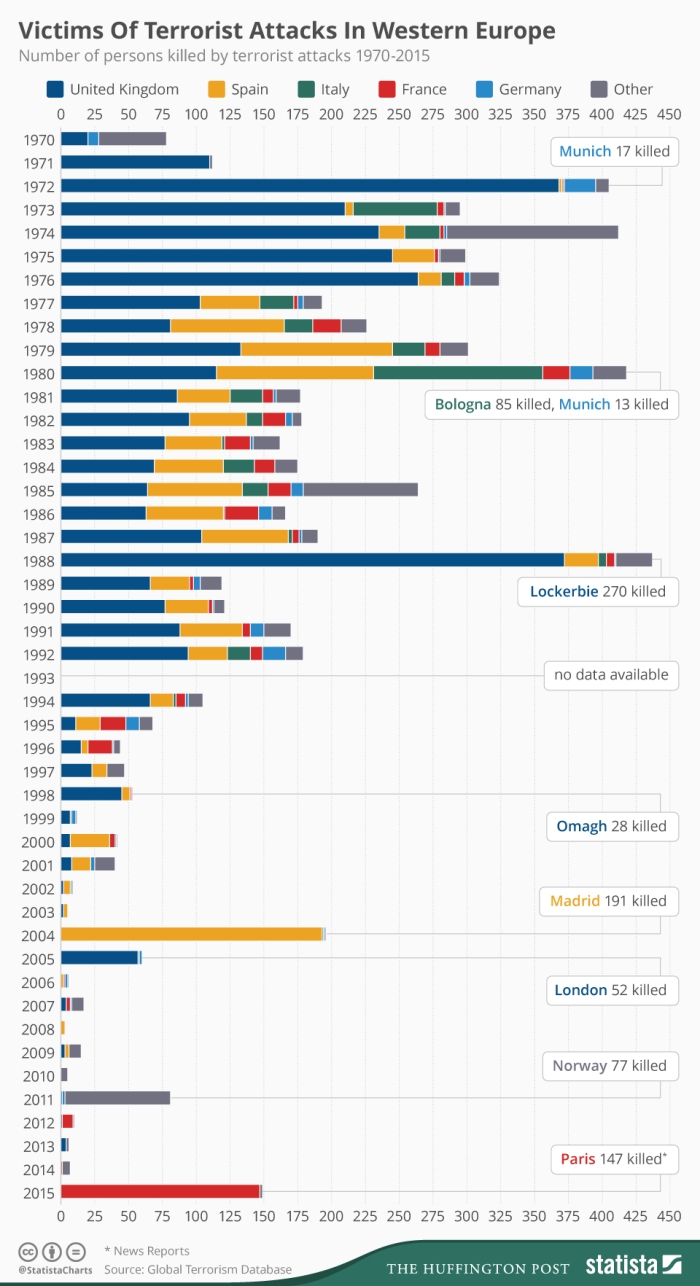
Hardly a pattern suggesting that the rich and powerful  –  with much better protections than the masses – should flee to little old New Zealand.  If New Zealand didn’t prosper through a century in which Europe went through two savage wars and a prolonged Cold War, an exodus of the elites seems unlikely to be our path to renewed prosperity now.

The great age of European emigration was in the 60 or 70 years prior to World War One, not now.

Ah, but O’Sullivan points out, then there are the Chinese

New Zealand has also become an attractive destination for Asian high net-worthers who have invested in property here – particularly Auckland. Chinese investors are relatively open that they are seeking to de-risk their own exposure to the China market, get capital out and buy residential property in a pollution free environment.

Auckland, and Sydney, and Vancouver, and London and Houston and…..anywhere more or less safe without heavy tax and regulatory restrictions.  The Chinese capital outflow story is a real one, and a historically anomalous one –  about fear, corruption, and lack of secure property rights in China.  But there is little no basis for thinking that it will a basis for transforming New Zealand’s specific economic prospects.  We don’t have difficulty attracting foreign capital, but we haven’t (it appears) created a climate in which business investment here is sufficiently attractive to begin to lift our relative productivity and income performance.  And as China’s own GDP per capita is about a third of ours, it isn’t obvious that one would look to mainland Chinese as a source of sustained domestic prosperity. (Taiwan or Singapore might be different, but then those countries have rather more respect for domestic property rights and, not unrelatedly, more success in generating  domestic prosperity).

And if foreigners really were wanting to build a top-notch global business (as distinct –  and it is an important distinction – from protecting what one already had), you almost certainly wouldn’t start from here if you had any other choice.  No serious observer ever pretends that New Zealand is better than fifth choice even among the Anglo countries: try the US, the UK, Canada, or Australia, and if you can’t get in there, then there is always New Zealand.  For a similar population, higher incomes, and rather better location I’m never quite sure why Ireland doesn’t appear in those lists.

O’Sullivan also tells us tax plays a part.  We don’t, she tells, us compete with Switzerland’s (now somewhat attenuated) banking secrecy laws

But it is notable that one of the reasons why New Zealand has yet to follow Australia and bring in rigorous laws to clamp down on multinationals which are not paying significant tax here is because this country is competing for investment.

Perhaps, but this is the same Prime Minister who, interviewed by TV3 a week earlier, reckoned that the tax paid by multinationals in New Zealand was “not fair”, and whose government is part of the OECD-facilitated BEPS process.

If we were really serious about promoting business investment in New Zealand, and in turning lifting our incomes and productivity performance, one of the best things we could do is to remove taxes on capital incomes altogether.  Taxes on business incomes are, largely, taxes on wages, precisely because they discourage the business investment that, for example, New Zealand has been so short of.  This isn’t a popular line to run in New Zealand, or perhaps anywhere, but a government that was serious about creating the conditions under which its own people could prosper, and in which foreign investment would assist us in that process, would not still be presiding over a company tax rate of 28 per cent and talking of finding ways to raise more money from foreign companies operating here.

[This is not the post for a lengthy treatment of tax issues, but a standard response is that much lower company tax rates would be a windfall gain to existing foreign investors, with no benefit to New Zealand.  That might be so if most foreign investment here were in tradables sectors (since selling prices of tradables are largely determined in international markets), but in fact the largest components of foreign investment here are in the non-tradables sectors, where lower company taxes would be expected to result in lower domestic selling prices (eg for banking or telecoms services), benefiting New Zealand consumers and businesses.  I outlined some thoughts on tax a few years ago here.)

As the O’Sullivan moves towards her conclusion she notes

If the Key Government keeps its nerve, the wealth transition will continue. For instance, New Zealand is becoming a magnet for high net-worth Chinese tourists and for students from Saudi Arabia – markets which are growing rapidly. That interest will bring with it investment in hotels, airports, and housing.

Both –  Chinese tourists and Saudi Arabian students –  are surely welcome, but is there any reason to think they are a probable basis for a reversal of our decades of income decline?  Our universities aren’t exactly Harvard or Oxford –  or even on a path to getting there –  and although I’m loathe to criticize tourism (we want holidays, so do foreigners), there is no advanced country of any size that has managed to support or sustain top-tier incomes based on tourism.  France is perhaps the most-visited country in the world, but it isn’t tourism that keeps it rich.

Finally

Annual net migration reached an all-time high of 68,840 people. And net migration from Australia was positive for the 11th consecutive month. These positives underline that John Key’s vision of New Zealand as a Switzerland of the Asia-Pacific has indeed the potential to become reality.

Key won’t be doing anything to destroy that wealth effect.

It gets boring to keep pointing it out, but over the last year around a net 4000 New Zealanders left New Zealand.  If we can’t even persuade the New Zealanders to stay, let alone create conditions that make the huge diaspora population want to come back,  it is a pretty unpromising foundation for the creation of a Switzerland of the South Pacific.

As for that “wealth effect”, O’Sullivan repeats the claim that the Credit Suisse Global Wealth Report demonstrates that New Zealand households are the second wealthiest (behind only Switzerland).  If she got this from Key (with all his advisers) it is inexcusable: the claim was widely reported at the time, but Credit Suisse themselves acknowledged that they had made a mistake, using the wrong exchange rate to convert New Zealand data in to US dollars.  I suspect someone else has pointed this out, as the detailed reference in the hard copy edition of the Herald has disappeared from the online version of the article.

It was, in any case, an odd statistic to trumpet.  Even on the corrected basis, New Zealand household wealth looks quite high.  But it does so because (a) our exchange rate is very high (they use market exchange rates, not PPP ones) and (b) because house prices, especially in the third of the country that is Auckland, are ridiculously high.   The average middle-aged homeowner in major cities such as Houston or Atlanta probably has a better house than the average middle-aged Aucklander, but it does not have a $1m price tag attached to it.

Which brings me to my final comment on the article itself.  The Prime Minister is reported as

He is frankly unapologetic about the massive increase in Auckland residential property values, which has resulted in many established Aucklanders becoming relatively rich, but younger people being locked out of the market. It is a trend which is not going to stop anytime soon, given the immigration figures.

They aren’t presented as direct quotes but if these lines are representative (and they are consistent with what he said in his TV3 last week) it is surely a disgraceful indictment of a failed government.  The sheer indifference to the plight of ordinary New Zealanders is breathtaking.    While his government continues to preside over land-use restrictions that limit the ability of Auckland’s physical footprint to grow, then continued high immigration would continue to hold up Auckland house and land prices.  But those land-use restrictions could be changed, and should be, especially if we are going to continue with anything like recent population growth rates.

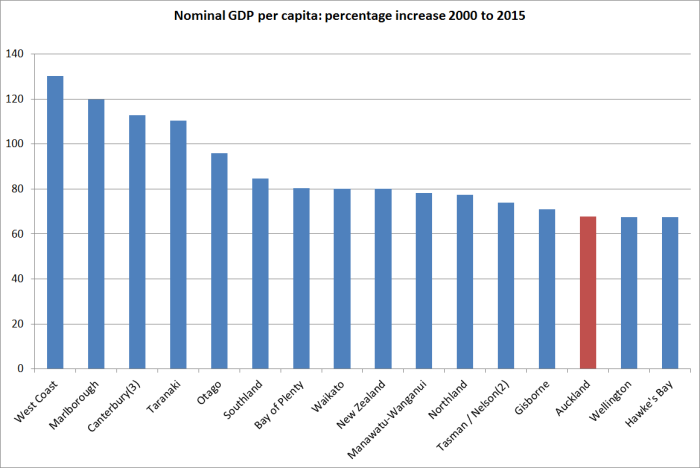
The breathtaking indifference might be slightly less inexcusable if there were any sign that the Prime Minister’s Switzerland “strategy” (or just “this week’s talking point”?) was working.  If, for example, incomes were growing rapidly and steadily closing the gap on the rest of the advanced world.  But they aren’t.  New Zealand continues to do badly, and recent data suggest that over the last 15 years Auckland has done worse than the country as a whole (per capita incomes growing less rapidly).

The Prime Minister is surely mostly right when he says

“They look at us and think it is a highly developed first world economy, unbroken democracy, stable government, independent judiciary

But in Switzerland they get all that, and more.  Beauty and stability, rule of law and wealth, and all that in the heart of one of the largest and most populous regions of  prosperity and innovation anywhere on earth.    Boltholes tend to be places of comfort and luxury but not of great economic dynamism and entrepreneurship.  And I’m pretty skeptical that it is “bolthole” tendencies that have enabled Switzerland to get, and stay, rich –  that is more down to the innovative products and services of its firms and peoples – but there seems no more basis for thinking that New Zealand is on any sort of path towards being a Switzerland of the South Pacific than there was when Fay and Richwhite were championing the idea 30 years ago.

Countries get and stay rich mostly on the skills and talents and energies of their own people.  Natural resources can help.  Really remote countries, even with able people and natural resources, face considerable challenges.   But to keep on looking for our salvation to come from abroad –  as the Prime Minister seems to in this article –  seems no more promising than the Melanesian cargo cults.


A strange op-ed from a business lobby group

There is a strange op-ed in the Dominion-Post this morning from Kirk Hope, the new chief executive of BusinessNZ.  I can’t yet see it online, but the point of the piece seemed to be that there is (a) more to New Zealand than dairy, and (b) New Zealand isn’t in a recession.

If he’d stopped there, I’d have no problem with the story.  But he went on to paint a rosy picture of how New Zealand is doing, and has been handling things, relative to other countries.

There is, for example, the claim that our rate of GDP growth (2.5 per cent in 2015)

“…is better than most developed countries.  The current rate of growth in the United States is 2.4 per cent, while in Britain it is 2.2 per cent, in Germany 1.7 per cent and in Japan 1.3 per cent.”

Was he perhaps not aware that New Zealand has been experiencing considerably faster population growth than all these countries?  Using the 2015 population growth data from the IMF WEO database, here is how per capita GDP growth looks for those five countries.

real gpd pc kirk hope

Spot the disappointing performer.  It gets worse, of course, because our terms of trade have been falling.  Real per capita national income actually fell a little in New Zealand last year.

In the short-term, it isn’t a disastrous performance (and there are countries we’ve done better than), but it isn’t very good either.

Amid his rampant optimism, Hope also injects this argument:

“Just as importantly, we are fortunate to have escaped one of the key mistakes made in other parts of the world in the aftermath of the global financial crisis.  While other countries chose to expand their money supply with quantitative easing to shore up their economies, New Zealand instead opted for investing in infrastructure –  roads and broadband –  which is a far more growth-enhancing approach”.

Of course New Zealand didn’t do any quantitative easing. Other countries did so only when policy interest rates got to around zero and they concluded that they couldn’t do anything much more with conventional monetary policy.

But which of Hope’s countries has cut interest rates further since 2007/08?

policy int rates

Why, New Zealand.

And what of the money supply itself?  Well, of the five countries, New Zealand has had the second fastest rate of money supply growth.

money supply

The euro-area as a whole has had money supply growth even weaker than the UK’s –  a mark of the problems the euro region has had.

As for “investing”, I suspect that few of Hope’s own member businesses will have been undertaking projects on quite such shaky or non-existent cost-benefit analyses as those which underpinned much of the public investment that occurs in New Zealand.  I’m still flabbergasted at the memory of asking a senior minister at a seminar a few years ago why there had been no cost-benefit analysis for one major initiative and being told, with a smile, that it was because he already knew the answer.

Thinking Big…..

…and drifting ever further behind (the rest of the advanced world).

That was the title of my address this morning to annual New Zealand Initiative Members’ Retreat in Auckland.  It is a gathering  of several dozen chief executives and senior executives of the Initiative’s corporate (and government) members.

Here is the text.

Drifting slowly ever further behind NZI retreat presentation 17 March 2016 

I was sharing a session on the economy with James Shaw, the leader of the Green Party.  I’m not sure how we got grouped together –  perhaps speakers the organisers thought the attendees would be rather suspicious of?

I talked only briefly about the current state of the New Zealand and global economies, concluding that there wasn’t much positive to look forward to over the next few years from either source, but that at least New Zealand didn’t seem to face much risk of a domestic financial crisis.

notwithstanding the obscene level of Auckland house prices, and the overhang of dairy debt, New Zealand as a whole has not been on some credit-fuelled rampant boom.  If we take the country as a whole, our dependence on foreign capital (the NIIP position as a share of GDP) has largely gone sideways for the last 25 years. Perhaps ideally it would have shrunk a bit, but this is no Greece, Spain, Ireland, or Iceland.  Or even the US –  with all that government sponsored or promoted poor quality housing lending.  Risks of a domestic financial crisis should rate very low on your list of concerns.

I got the impression that some people thought that was about the only upbeat comment in the speech.

The rest of the address was about the longer-term economic challenges facing New Zealand.  I pointed to some of the stylized facts:

  • persistently high (relative to other countries) real interest and (relative to our relative productivity trends) real exchange rate,
  • the continuing decline in our relative productivity (labour or MFP),
  • the failure to see any expansion in tradables production per capita over 15 years, and
  • the failure of Auckland incomes to rise relative to those in rest of the country, despite all the emphasis on possible agglomeration benefits and a policy focus on promoting Auckland.

I noted that New Zealand had been, and remains, a natural-resource based economy.

Modern New Zealand has always been, and remains, a natural resource-based economy, and no one is making any more land, sea or other natural resources. We find new and smarter ways to maximise what we earn from the natural resources – productivity in agriculture in recent decades, for example, has been quite impressive  –  but that doesn’t change the fact that we have a given stock of natural resources and a fairly rapidly growing number of people.    For each new person we add there are simply fewer natural resources per capita.    In a well-ordered society, abundant natural resources are a blessing not a curse, and there are plenty of opportunities for productivity gains in many of those industries.   But the stock of resources isn’t increasing, and the people are.

That wouldn’t matter if we were rapidly growing industries that were taking on the world based largely on the skills and talents of our people. After all, there are no known bounds to human creativity and ingenuity.    You could think of the US or the UK, or Belgium or Ireland.  But we aren’t.

What New Zealand exports has changed over 170 years – at one stage, gold was our largest export, perhaps whale products at one stage even earlier.  Optimists like to point out the agricultural exports have diminished in relative significance.  But if we look at all our exports, our natural resource based exports –  agriculture, oil, fish, gold, (most) tourism, forestry, aluminium –  make up probably 80 per cent of our total exports (good and services).  That proportion isn’t shrinking materially.  There are some globally successful companies based here, who don’t primarily draw on the natural resource base – Fisher and Paykel Healthcare might be the best known – but there aren’t many, and there is simply no sign of the export base transforming.  Exports of educational services have been in the headlines this year: they are a welcome boost, but we aren’t exactly selling premium Ivy League type products.

Against this background, I drew attention to the failure of our skills-based immigration programme

Unfortunately, there is not the slightest evidence that the New Zealand strategy has worked.  The formal evidence base around the economic impact of immigration to New Zealand is unfortunately still quite limited, and we never quite know what would have happened without the immigration.  But it was never a strategy that was likely to succeed.  For one thing, New Zealand is small, remote and (by advanced country standards) relatively poor – not exactly first choice for the hard-driving and ambitious best and brightest.  Our universities are middling at best, so we can’t attract many potential stars that way.  As Hayden Glass and Julie Fry  reportedly point out in their new book, our skills-based programme has been attracting less skilled people, on average, than the Australian or Canadian programmes.

And

There is simply no sign of a fast-growing knowledge-based outward-oriented tradables sector, that would lead faster national growth in productivity and incomes, emerging here. [Auckland].

And nor would I expect it to: this is a natural resource based economy, and simply not a place where those knowledge-based industries would naturally locate in any number.  Even if they started here, in many or most cases the owners could maximise value by relocating (or selling) abroad.

New Zealand might have plenty of smart people and low regulatory barriers to starting businesses but it seems to be a pretty poor place to base global business.  That seems to be our experience.  But look around the world, and you simply don’t find many such businesses on remote islands.

And

In their individual wisdom, knowing their own country, New Zealanders has been recognising that prospects for them and their families are better abroad than here.  Even last year, more left than came back.   And yet our governments –  backed more or less by all political parties –  have simply decided to bring in huge numbers of new people each year.  It is an astonishing example of a central planner’s hubris –  a whole new Think Big strategy in which governments, all with the best will in the world, mess up the stabilising adjustments that would otherwise have been underway.

Governments don’t help by messing up the housing market but, salient as that pressure is, especially here in Auckland, it isn’t the real issue. The real issue is simply that there are no new really good income earning prospects –  new highly rewarding export industries – that the much higher population is enabling us to tap.  We haven’t found new natural resources or ideas that need lots more people to take full advantage of them.  Of course, we sustain reasonable total GDP growth building to support a rising population, but it does nothing to close our productivity deficits.  And because people can’t be used for two things at once, the need to build to accommodate the ever-rising population crowds out some productive, internationally oriented, investment that would otherwise be profitable here.  If we keep on with such a strategy we’ll keep on, little by little, drifting further behind the rest of the advanced world. We are simply in the wrong place to support very many people.  No other remote island has anything like our population.  Our own people have implicitly recognised the limits of New Zealand for decades. It is governments and their official advisers who seem blind to it.

Concluding that we need to change course

Closing those gasps will take far more rigorous and robust analysis and advice from our key economic agencies, such as Treasury and MBIE, that looks hard at all the symptoms of our longer-term economic condition.  But it will also take political will, drive and vision –  and a willingness to put aside the implicit “big New Zealand” mentality that has shaped so much of our history –  from Vogel to Seddon to Holland to Holyoake to Douglas, Birch, Clark and Key. 

New Zealand isn’t in short-term crisis, and for that we can be grateful.  But our people –  our kids and grandchildren –  deserve more than leaders simply smoothing the pillow of continued relative decline, all the while pursuing a flawed “Thinking Big” more-people strategy that failed in the post-war decades, and has failed again in the last 25 years.

Depressing?  Well, several people thought so, one pointing out how fitting it was that I’d named the blog for Cassandra.  Personally, I’m a lot more optimistic than that.  I reckon there is no reason at all why a bunch of smart people can’t generate really high per capita incomes in these pleasant islands, combining our skills, institutions, and natural resources.  Various other small countries do so –  mostly from oil, but there is nothing unique about that particular resource.  We have been deluding ourselves –  or rather our politicians and officials have –  in the belief that a bigger population and bigger cities are the path to success.  There is simply no evidence they have been so far – not just in the last few years but in the many decades since the last really positive New Zealand-specific productivity shock.  But that is really quite easy to fix.  We can’t change where we are in the world, which is a big drawback in many ways – some activities are just never likely to be generated to any large extent in places like New Zealand –  but that shouldn’t hold back our living standards so long as we avoid the central planners’ ambitions to rush to populate.

But if you still reckon my presentation is bleak, James Shaw trumped it with a fairly shockingly dark joke.  (It was a Chatham House rules occasion, but he said I could say that) talking about robots and the risks they might pose he recounted a joke he’d come across on Twitter.

9 year old girl:  Daddy, will robots one day rule the world?

Father:  Yes, dear.  Probably.

9 year old girl:  Daddy, will that be before I die?

Father:  Probably dear.  Just shortly before.

Finally, I learned today that the New Zealand Initiative is planning to do some substantive work on the economics of immigration in New Zealand.  It might still be some way off, but I welcome the prospect of the work being done, and look forward to what they come up with.  Eric Crampton apparently is keen on inflows that would enhance the availability of Latin American cuisine.


Think Big: where did all those agglomeration and immigration benefits get to?

Statistics New Zealand this morning released the annual regional GDP data.  My former colleagues at the Reserve Bank were never very keen on money being spent on producing this relatively new data –  it is nominal rather than real, and is only available with a fairly long lag.  The data are no use at all for short-term analysis of macroeconomic trends –  and of course it would be better if we had regional real GDP data, and real income data –  but there are plenty of other uses for even not-that-timely nominal data.   It has brought together the range of other regional data in a useful summary form, and provides us data back as far as the year to March 2000 (which conveniently coincides with the terms of last two governments).

To listen to much of the New Zealand debate in the last 20 years or so, you might suppose that Auckland has been the stellar economic performer.  After all, we often hear about the benefits of agglomeration, the importance of cities and so on (all of which are, in general, valid and important perspectives). Auckland is our one moderately large city, its population has continued to grow strongly, and central government –  in the form of an ACT Party minister – even created a single council to help realise all these benefits.   Population growth in Auckland in recent times has largely resulted from immigration (there has been a small outflow of New Zealanders from Auckland to the rest of the country).  And successive governments, advised by The Treasury and MBIE, tout the economic benefits of a high rate of immigration, under our skills-based immigration policy –  it is, we are told, a critical economic enabler.

Against that backdrop, the actual regional data look pretty disappointing, to say the least.

As a reminder, Auckland’s population (estimated at 1.55 million in the year to March 2015) is more than twice that of next largest region (Canterbury).

And its population has been growing much more rapidly (more than twice as fast) as the population in the rest of New Zealand.

population growth since 2000

As one would expect, nominal GDP per capita is higher in Auckland than in most other regions –  but it is only third highest, behind Taranaki, somewhat “artificially” boosted by oil and gas production at high prices in recent years, and Wellington.  In the most recent year, Canterbury’s GDP per capita is about the same as Auckland’s – but that is no doubt a temporary rebuild-related phenomenon.

And the trend has been going against Auckland, despite (?) all that rapid population growth.  Here is a chart of Auckland per capita GDP divided by the GDP per capita of the median region in New Zealand.  It is a bit noisy from year to year –  Auckland looks to have done quite badly during the 08/09 recession and regained a little ground since –  but the trend has clearly been modestly downwards (compare the latest observation with one from 10 years ago).

nom gdp pc akld vs rest

And which regions have done best?  Well, here is the percentage growth in nominal GDP per capita, by region, for the 15 years to the March 2015 year.  (The picture for just the last 10 years is pretty similar – although Wellington has done notably better in that subperiod.)

nom gdp pc by region

Of course, these are GDP per capita measures, and the age structures of regions do differ.  But it doesn’t look as thoough that helps much.   The labour force participation rates in Auckland and the rest of the country are almost identical (a higher labour force participation rate  helps boosts GDP per capita in Wellington).   Working age population as a share of total population is a little lower in Auckland than in the country as a whole, but over the 15 years for which we have data the working age population share has changed by much the same amount in Auckland as in the country as a whole.

Perhaps there are good answers to why Auckland appears to have underperformed –  not over a year or two, but over 10 or 15 years –  that would leave intact the story about the gains to New Zealanders from a large scale immigration programme, and the emphasis on the centrality of our largish city, Auckland, to New Zealand’s overall economic success.

But for now, it just seems to add to the increasing number of straws in the wind that suggest that the whole population and immigration-based approach to economic policy  –  and our immigration policy is one of the largest discretionary levers of government economic policy – is flawed.  Productivity growth has been consistently poor, tradables sector production per capita has recorded no growth in a decade, and our largest and fastest-growing city (in both cases, by some considerable margin) has been recording lower per capita growth than most of the rest of the country, and average incomes in Auckland have, if anything, slowly been converging towards the median.

An alternative narrative of New Zealand’s economic performance and policy, of the sort I have been running now for several years, would find little or none of this surprising.  Disappointing yes –  this is our country’s prosperity, and the future of our children –  but no more surprising than the failure of other flawed economic strategies in the past, here and abroad.  Our immigration programme for the last 25 to 30 years might better be reassigned the label once given to the ambitious, deeply flawed, energy projects of the early 1980s, Think Big.  Like that programme, it was put –  and kept – in place by well-intentioned people, genuinely seeking the best interests of their country.  But like the earlier Think Big, this one has failed, and goes on failing.  Outcomes matter a great deal more than good intentions.


Two unrelated comments

The New Zealand tourism industry has been having a good year.  One particular source of strong growth has been visitors from China, but I’d noticed reference to something similar in the Australian visitor data.  That got me curious about how the two countries’ industries had done in attracting Chinese visitors, not just over the last year or so, but over the decades.  This was the resulting chart.

china visitors

It simply takes rolling annual totals of short-term visitors from China to each country back to 1991, when the easily accessible Australian data start.

New Zealand has enjoyed a good year or two relative to Australia.  It is just a shame about the poor decade –  really the story of New Zealand’s tourism sector more generally.  Visitor numbers from China to both countries have been trending strongly upwards over the whole period (Chinese visitor numbers to New Zealand last year were more than 100 times those for 1991), but for at least the last 15 years New Zealand has done worse than Australia in attracting new Chinese visitors.  Yes, there has been quite a recovery in the last year or two, but that just takes New Zealand’s share of the market, relative to Australia’s, about back to where it was in 2007, and still a long way below our peak relative performance in 2003.

Tourism plays a larger share in New Zealand’s economy than it does in Australia’s, so success in tapping new markets looks like it should matter a bit more to us than to them.

On a totally unrelated matter, while I was playing around with the visitor data a reader kindly sent me a copy of, veteran political columnist and commentator, Colin James’s column yesterday from the Otago Daily Times.  Headed “Are English and Wheeler drifting out of date?”, it is another rehearsal of lines as to why the OCR should not be cut further.  It would bore me, and probably bore you, to go through all the weak points in the argument.  On the domestic side, suffice it to point out that per capita GDP growth has been weak not strong, a 5.3 per cent unemployment rate is disconcertingly low not a sign of an overheating labour market, and how 7.5 per cent credit growth qualifies as particularly “strong” in a economy that has 2 per cent population growth, a 2 per cent inflation target, and aspirations to some reasonable productivity growth is a bit beyond me.

But my main reason for commenting was that James also advances the line that somehow the world is a great deal better off than the statistics suggest, that technological revolutions are driving upwards our living standards and pushing prices inexorably downwards, and there really isn’t that much to worry about.

The problem with the story is that there just isn’t much evidence for it.  In the aggregate data, as I’ve highlighted before, it is clear that productivity growth has slowed, not accelerated, and that that slowdown was already underway before the ructions around the financial crises and international recessions of 2008/09.  This was a chart I showed a week or two back –  the blue line is the median TFP performance for the old advanced countries (in Europe, North America, and Oceania).

tfp conf board

And here was the data specifically for the US business sector

fernald

But don’t just take it from suggestive top-down charts. Various experts have been looking at whether any material mis-measurement issues, especially around the tech sector and tech products, can explain away the productivity slowdown.  The short answer is that they can’t.  Many readers will already have seen Tyler Cowen’s summary of these papers, and for those who haven’t I’d encourage you to check it out.   As he notes

…the countries with smaller tech sectors still have comparably sized productivity slowdowns, and that is not what we would expect if a lot of unmeasured productivity were hiding in the tech industry

John Fernald, at the San Francisco Fed, does the business sector TFP data in the chart above, and is one of the acknowledged experts in this area. In a new paper, out just a few days ago, Fernald and co-authors conclude

After 2004, measured growth in labor productivity and total-factor productivity (TFP) slowed. We find little evidence that the slowdown arises from growing mismeasurement of the gains from innovation in IT-related goods and services. First, mismeasurement of IT hardware is significant prior to the slowdown. Because the domestic production of these products has fallen, the quantitative effect on productivity was larger in the 1995-2004 period than since, despite mismeasurement worsening for some types of IT—so our adjustments make the slowdown in labor productivity worse. The effect on TFP is more muted.

It seems pretty clear that there has been a real and material slowdown in productivity growth, and hence in the rate of improvement in underlying living standards.  The Fernald paper suggest that may partly be a return to more normal growth patterns, after exceptional gains in the 1990s, but whether that is so or not, it is no reason for complacency about inflation that undershoots targets.  Weak population growth and weak productivity growth both argue for low interest rates….and as a reminder, in New Zealander real interest rates (already high by international standards) have been rising not falling over the last couple of years.

real ocr

When contemplating tomorrow’s Monetary Policy Statement  don’t fall for the lines Colin James runs, channelling Graeme Wheeler, that monetary policy is “very accommodative”


Immigration the source of Australia’s prosperity?

Late last year, veteran Australia journalist and author George Megalogenis’s new book Australia’s Second Chance was published.  Despite the single economic market, it is often hard to become aware of new Australian books, and not always easy to get hold of them either.  Somehow I stumbled on a reference to this book and read it a few weeks ago.

Megalogenis appears to be highly-regarded by the liberal-left in Australia, at least judging from the reviews of his previous book (which was launched by Prime Minister Julia Gillard) that are quoted on the inside cover of this one.   Wikipedia says he once was once married to the woman who is now Labour premier of Queensland and, whether because of that or despite it, he appears to have it in for Queensland –  not helped, it seems, by the large number of New Zealanders living there.

It is a well-written easily-read book, and for those who don’t know too many details of Australian history since 1788 it is full of interesting facts.  It is just a shame that the thesis that shapes the book is almost certainly almost totally wrong.

Megalogenis argues that immigration is what has made Australia rich, and is what will make it richer still in future –  if only the naysayers, sceptics, racists etc just get out of the way, and let Australia fulfil its manifest destiny.

You may think I am over-egging his story, but here are some lines from the last page of the book

Australia matters more than most nations because it remains a settlement with potential.  Our unique strengths…..come with a burden.  The rest of the world expects Australia to succeed, given our small population and resource endowment.  Our previous eras of poor performance were punished so severely because the world believed we had let it down.  This is the pragmatic argument for openness, because history tells us the alternative is an isolated belittled Australia.  A globally minded Australia will continue to thrive, because the world will project its best self on us.

and a page or two earlier, concludes that Australia’s

standard of living depends on the migrant

The test for Australia now, we are told, is “to keep them coming”.

It is really a very odd argument.

As one person I mentioned the book’s thesis to noted, in one sense it is clearly true.  Had there been no immigration to Australia since 1788, it seems most unlikely that per capita incomes of Australians would anything like as high as they are today.  They aren’t in, say, Botswana or Mongolia.

Then again, as far as we can tell from the historical estimates that are available, Australia’s per capita incomes were the highest in the world in about 1890.  Australia has not matched that performance in the 125 years since.

According to Megalogenis, Australia’s success has rested on repeated waves of immigrants, and when the flow slowed times were not typically good for Australians.  Mostly, it is a story that seems to reverse cause and effect.    Migrants are attracted to economic success and opportunities.  In the 19th  century it was hugely expensive to immigrate to Australia (or New Zealand) and people did so in large numbers either when someone else paid them to do (assisted migration) or when really good new opportunities (large expected income gains) opened up.

Early European Australia was a penal colony, hugely heavily subsidized by Britain, with few export opportunities and not particularly attractive as a place to relocate to (the total European population in 1820 was 33000).  The first big natural resource shock was the discovery of the natural pasturelands in western New South Wales in the 1820s.  In 1830, Australian wool accounted for 8 per cent of British wool imports (German states had been the dominant supplier), but by 1850 Australia accounted for more than half of a fast-growing market.  The associated income growth markedly boosted both the Australian colonies ability to support themselves, and to support a much larger population at the sort of living standards (or better) they might have been used to at home.

The gold rushes of the 1850s (and sustained high gold production for several subsequent decades) had a similar effect.   Whole new incomes could be generated in Australia, supporting high living standards (and associated imports) for a larger population.  Immigrants flooded in  –  as they did later to New Zealand in our gold rushes. Australian exports as a share of GDP rose to around 40 per cent –  a level never achieved since.  But there is nothing in the economic histories to suggest that the immigrants created the prosperity. Rather, the prosperity made Australia (and especially Victoria) attractive to immigrants.  Since the typical immigrants was a single male, content with a pretty rough standard of accommodation – so there weren’t huge initial capital stock requirements –  the standard result in Australian economic histories is that the huge inflow of immigrants dampened wages in Australia (relative to a counterfactual in which the gold discoveries had to be exploited only by people already there).

After a final gold rush in Western Australia in the 1890s, there were no great natural resource discoveries in Australia for decades.  Agricultural productivity gains continued to lift farm output –  and refrigerated shipping and new dairy technologies assisted Australia, although to a lesser extent than New Zealand –  but the best land was already taken.  Perhaps unsurprisingly, these weren’t great decades for remote Australia.  By global standards, it remained a rich and successful country, but no longer at the forefront-  indeed, on some of best measures around there wasn’t much per capita growth from 1890 until World War Two. Perhaps unsurprisingly, the rate of population growth wasn’t as rapid – European migrants weren’t quite so keen on coming as they had been (and, as in other settler countries, Asian migration was severely restricted).  For the first half of the 20th century, Australia was much like New Zealand –  an agricultural exporter, primarily to the United Kingdom.  Overall, the two countries generated rather similar living standards  –  and still had some of the faster rates of population increase anywhere in the advanced world.

Minerals began to come back to prominence in Australia from the 1960s.  Australia stopped doing stupid stuff to itself-  bans on iron ore exports were lifted, prospecting rights were improved etc –  and some combination of new discoveries and new opportunities (the rise of Asia) provided a whole new, increasingly large, income stream for Australia.  New foreign income opportunities support higher consumption demands from an existing population, and can sustain a higher population.  Mineral exports from Australia had been 1 per cent of total exports in 1951.  They were 18 per cent in 1974, 28 per cent in 1989, and 55 per cent in 2009.  And exports as a share of GDP were materially higher than they had been in the 1950s and 1960s.  New Zealand, of course, has had nothing similar (some argue that there is plenty of mineral potential, but if laws make it difficult or impossible to exploit, it doesn’t matter much whether the enthusiasts are right or wrong).

But, contrary to Megalogenis’s thesis, there is just nothing in the data to support the idea that the rapid (immigration-fuelled) population growth has been the basis for strong per capita income growth (over decades).  Rather it is the rapid total income growth –  particularly associated with mineral developments over the last 40 to 50 years –  that has enabled Australia to support pretty good incomes for a growing number of people.  Again, we in New Zealand had nothing similar on the income side, and so overall returns (eg GDP per hour worked) available to the growing number of people have continued to languish.

Now, to be clear, this is not some crude story in which physical resources inevitably make a country rich.  There are so many counter-examples I’m not going even going to attempt to list them.  But new physical resource discoveries, when combined with capable people, and strong institutions, have proved able to generate high per capita incomes for people in places where one might not otherwise have expected such good outcomes.  Norway is one example –  balancing all three components of that mix..  With more emphasis on the resources than the human capital or institutions, Brunei or Kuwait are other examples (or Equatorial Guinea and Gabon).   Australia is closer to the Norwegian end of the story –  the same North European combination of people and institutions, that have made for the most prosperous settled societies in history, augmented abundant natural resources (but spread over considerably more people than Norway).  Australia doesn’t seem like the sort of location that, natural resources apart, would easily generate top tier incomes –  never in its history has it looked like developing seriously internationally competitive manufacturing or services industries based in Australia.

Readers may be skeptical of the story I’ve been telling.  But don’t take my word for it.  Most of it (and most of the data I’ve quoted) is based on one of my favourite economics books Why Australia Prospered,  published in the prestigious Princeton Economic History of the Western World series, and written by the recently-retired leading Australian economic historian Ian McLean.  The value of the book is partly that he explicitly considers Australia through a comparative lens, looking at other settler economoies, including New Zealand.   I reread it after I’d read Megalogenis, and his story is essentially the one outlined in the previous paragraph.  There is no sense, anywhere in the entire book, that anytime in the entire modern history of Australia immigration has been an enabler –  allowing Australia to lift its per capita income above what it would otherwise have been.

And what of that bastion of careful economic analysis, the Australian Productivity Commission?  They produced a big report 10 years ago, that concluded that there were probably few or no benefits to Australians from modern immigration inflows.  And late last year, in response to another government request for a report on immigration, they produced another lengthy draft report.  I’d seen a few media reports suggesting that they had reached a positive conclusion on the benefits from immigration, but when I dug into the chapter on the economywide impacts of immigration (from p 263), I found that in their baseline scenario productivity growth and wages were lower in the scenario in which current immigration levels continued than in a scenario without immigration.  The differences are very small, and my only point here is that there is little or no support for the sort immigration-boosterism reflected in a book like Megalogenis’s.  The Productivity Commission do run an alternative more positive scenario – but essentially it amounts to “what if we just assume that skilled immigration materially boosts productivity growth”.  If one assumes gains going into the analysis, one gets gains out the other end.

Over the broad sweep of modern history Australia and New Zealand have had pretty similar approaches to immigration. And they’ve had similar institutions, and similar sorts of capable people.   In neither case is there any evidence that continued high rates of immigration have done anything to lift either country’s longer-term economic performance.  Rather successful economies successfully absorbed more people at little cost to their own people.  The big difference between the two countries in the last 100 years has been the discovery and exploitation of the vast mineral resources in Australia. That has enabled Australia to continue to offer fairly high incomes to a lot more people –  including many New Zealanders.  Without the new opportunities, products or markets, New Zealand has struggled to cope with its population growth, and continues to drift further behind the rest of the advanced world –  putting more people into a place with few natural advantages.

I described Australian incomes as “fairly high”.   And yet for all its huge natural resources, Australia’s real GDP per hour worked –  while a lot better than New Zealand’s – is no higher than the median of advanced countries.  For decades it fell relative to other advanced countries, and even over the last 20 years has done little better than hold its own.

aus real gdp phw relative

As a topic for another day,  might its people also have been better off without such rapid immigration-fuelled population growth?


New Zealand and Norway: a real exchange rate that hasn’t moved

On average, over time, one would expect the real exchange rate of a more poorly-performing country to depreciate against that of a better-performing country.

There is a whole variety of strands to a possible story about why one might expect to see such a relationship, and for why it would be helpful for the more poorly-performing country for such a depreciation to occur.  A less well-performing country will typically have found its firms less well able to compete in international markets (than those of the better performing country).  That, in turn might reflect a less attractive tax and regulatory environment, less real productivity growth, or changing demand patterns so that the world wants more of what the more successful country produces and less of what the less successful country produces.  Or it might even be about natural resource discoveries –  a country that discovers major new resources (eg oil and gas) just has more stuff that the rest of the world wants, and with good institutions such a country will tend to outperform other countries for a (perhaps quite prolonged) period.  And the citizens of a faster-growing country will rationally anticipate strong future income gains, increasing their consumption demand relative to the trajectory of consumption demand in the less well-performing economy.

I’ve illustrated previously that one of the striking stylized facts about New Zealand is that although our economic performance over the last 60 or even 100 years has been pretty disappointing by global standards, there has been no depreciation in our real exchange rate relative to those of other advanced economies.  No wonder our tradables sector has struggled.

This post is really just about illustrating the point by reference to one other particular small commodity exporting country, Norway.

For the first 100 years or more of modern New Zealand, no one doubted that per capita incomes in New Zealand were much higher than those in Norway.  New Zealand was one of the great economic success stories, while Norway struggled, and exported a lot of people, especially to the United States.  On the Maddison numbers, GDP per capita in New Zealand in 1870 was more than twice that in Norway.  By 1910, when New Zealand GDP per capita is estimated to have been the highest in the world, the margin was even more in our favour.

These days, GDP per capita in New Zealand is not much more than half that in Norway  (and the NNI per capita gap is even larger).  New Zealanders work long hours per capita, and our real GDP per hour worked is estimated to be only about 45 per cent of that in Norway.  Over the last few years, we’ve done a bit better than Norway, but the multi-decade trend has been strongly downwards.

Here, using the OECD database which has estimates back to 1970, is New Zealand GDP per capita relative to Norway’s (in current prices, using current PPP exchange rates).  These are really large declines.  Back in the early 1970s we had incomes about the same as those of Norwegians.

gdp pc nz and norway

Norway began to pull away from other OECD countries when its large oil and reserves began to move into production in the 1970s.  We, on the other hand, suffered in the 1970s from a deep decline in the terms of trade, and new access restrictions on our major export products.

And yet here is a chart showing New Zealand’s real exchange rate relative to that of Norway since 1970.  I’ve shown two, very similar, series –  one is the OECD’s relative consumer prices index, and the other is the BIS’s narrow real exchange rate measure.

rer nz norway

Our real exchange rate (in particular) has been quite variable –  Norway’s has mostly been materially more stable –   but over the whole period there has been no trend whatever in the ratio of our real exchange rate to theirs (and in the last few years, New Zealand’s real exchange rate has risen a lot relative to Norway’s).

Using the OECD’s relative unit labour cost measure produces a slightly more encouraging picture for New Zealand –  but if there has been a trend decline at all, it has been quite small, compared with the magnitude of the deterioration in New Zealand’s economic performance (productivity, GDP per capita, usuable natural resource endowments).

Why has it happened?  Well, it is Saturday and I’m not planning to write an extended essay.  But my thesis is that it is a combination of things Norway has done, and things we have done.

On the Norwegian side, wisely or otherwise, much of the oil and gas revenues –  mostly accruing to the Crown – were diverted into the Petroleum Fund, and saved for a later day.   Norway has net government financial assets of around 250 per cent of GDP –  a figure that was less than 50 per cent only 20 years ago.  And there hasn’t been a large private sector offset   Norway’s positive net international investment position is now some 200 per cent of GDP.

What that has meant is that quite a large proportion of the new income earned in recent decades has not been spent.  And income not spent does not put upward pressure on the prices of non-tradables goods and services relative to those of tradables (another definition of the real exchange rate).  Norway has experienced some of that pressure –  Oslo is an expensive city – but a lot less than they would have without the huge savings rates.

Since the early 1970s, our government debt position hasn’t changed much –  it has gone up and down –  but was pretty low at the start of the period, and is pretty low now.  Our NIIP position has gone in the opposite direction of Norway’s, even though they were earning lots of (initially unexpected) income, and we were experiencing repeated disappointment.  On best estimates, our NIIP position was around -10 per cent of GDP in the early 1970s, and has been fluctuating around -70 to -80 per cent of GDP for the last couple of decades.

The Norwegians haven’t spent a larger share of their income even as their growth prospects improved, and we haven’t saved a larger share of ours even as our growth prospects deteriorated.  Neither choice is necessarily better than the other, but their choice tended to weaken their real exchange rate (all else equal) keeping more non-oil tradables firms competitive, and our choices tended to strengthen our real exchange rate, making it hard for the tradables sector to grow much.  For us, it tends to reinforce our decline.

And then there are population choices.  When migration works well, it usually complements economic success that was already underway.  Rapid population growth, all else equal, tends to put upward pressure on a country’s real exchange rate –  it involves a high demand for non-tradables, putting upward pressure on non-tradables prices relative to those of tradables (set globally).  Norway’s population growth rate has increased quite a bit in the last decade, but over the full period since 1970, here is the chart showing the ratio of New Zealand’s population to that of Norway.

population nz norway

Our population –  in a country that has had one of the worst performances of any advanced country –  has grown materially faster than that of Norway, one of the most successful countries in the advanced world.  Not usually a recipe for success – in a family, or at a national level.

I don’t believe in population policy –  people should be free to have as many, or as few, kids as they can afford, and it should be no concern of governments –  but immigration policy is a different matter.  Our population has grown faster than that of Norway almost entirely because successive National and Labour governments have chosen to bring so many non-New Zealanders into the country (more than offsetting the upsurge in those leaving, mainly for Australia).  Doing so has helped impede the sort of the sustained downward adjustment in the real exchange rate one would have expected if governments had simply stayed out of the way.  It has made even harder for New Zealand to turn around the decades of economic decline.

It just looks like a wrongheaded policy, foisted on us –  at our expense, without seeking our endorsement –  by a succession of bureaucratic and political elites (different party labels or none, but similar ideologies and mindsets) who can offer barely a shred of evidence in support of the success of their strategy.

We can’t change the fact that Norway got oil or gas, and nor would we  wish to, or begrudge them their good fortune.  But it is pretty extraordinary that over 35 years when they’ve done so well and we’ve done so badly, there has been no change in our real exchange rate relative to theirs.  At our end of that relationship, it is as if governments have set out to stop the adjustment happening.   It wasn’t their conscious intent, but after this long lack of conscious intent makes them no less culpable.

Unborn firms utter no cries

Late last year, in a series of posts on the quarterly national accounts I showed this chart of export volumes per capita (for New Zealand and Australia).

exports real pc

Exports (per capita) had carried on growing over the last decade or so, although at a materially slower rate than they had been growing previously.

Exports matter, but they are only one outcome of the international competitiveness of the New Zealand economy.  Another way of looking at things is to think of the economy as divided between tradable and non-tradable sectors.  It is a useful analytical device, but (like many useful economic concepts) doesn’t map 100 per cent easily onto the official data we have available.

My proposition (not, I think, overly controversial) is that a high-performing economy will be one in which the tradables sector –  the bits selling to, and directly exposed to competition from, the rest of the world –  is growing strongly, absolutely and certainly in per capita terms.   Such growth in the tradables sector in a mark of the success of companies operating here in being able to meet, and succeed in, the global market.  There is, of course, nothing wrong with non-tradables activity: we want phone services, cafes, theatre, and holidays at the beach.  But it is exceedingly rare that a strong sustainable economic performance, especially in a small economy, is led from production in the sectors that aren’t exposed to international competition.

In an IMF Article report from perhaps 10 years ago the Fund staff had the clever idea of representing the tradables and non-tradables sectors in a single chart.  It was rather rough and ready, and the Fund knew it, but it helped illustrate something of how the New Zealand economy had been unfolding.   They started with the production measure of real GDP, and allocated the primary and manufacturing sectors to tradables.    Our exports and imports are typically either primary or manufactured goods, or they are services.  To proxy the contribution of services to tradables production, they took the services exports component (from real expenditure GDP) and also assigned that to the tradables sector.  Everything left over was non-tradables.   The resulting chart was reproduced in various fora around Wellington over the years, even used by the Minister of Finance  –  much to the distaste of purists.

I hadn’t seen the resulting chart for a while, and was curious how things had been going.  In particular, given the rapid growth in the population over the last decade, I was curious about how tradables sector activity had been doing per capita.  After all, both National and Labour governments have constantly talked of strengthening New Zealand’s international competitiveness, international connections etc.

In this chart, I’ve shown primary and manufacturing real value-added per capita, and real services exports per capita, back to when the quarterly population series began in 1991.  Each component here is indexed to 100 in 1991.  At the end of the period, these three components of tradables production are of broadly similar size.

tradables components

If your eye is drawn to the services line, as it probably is, bear in mind that not one of these series is now at its historic peak.  One peak was in 2004, one in 2005, and one (primary) in 1997.     By contrast, real per capita GDP is at its historic peak –  growth hasn’t been strong over the last decade, but has been around 8 per cent over the last decade.  Per capita export volumes haven’t been doing that well (see first chart above) –  but they have clearly done a whole lot better than the domestic (import-competing) component of tradables production.

So here are the aggregate tradables and non-tradables components, as proxied by this particular approach.

tradables and non-tradables gdp

I found it a rather bleak picture, to say the very least.  Tradables sector production, per capita, is now nowhere near as high as it was as much as 12 or 13 years ago.  It is most unlikely that New Zealand will make any progress at all in sustainably closing income and productivity gaps to the rest of the advanced world if it can achieve no growth in per capita tradables sector production over a period that long.

Why has it happened?  What has so strongly skewed production towards non-tradables?  I’d argue that it has, primarily, been rapid population growth, which had to be accommodated through a much higher exchange rate (the big step in the exchange rate dates back to 2003). For many of our tradable product sectors, raising our own population does nothing to materially boost output –  land and sea and mineral resources are given, and the (real and significant) productivity possibilities in those sectors are independent of population.  And the higher exchange rate just made it that much harder for other firms in the tradables sector to survive or thrive.  The exchange rate has been so high for so long that we don’t hear many squeals any more –  those who can thrive at these exchange rates do, and dead firms and unborn (ie never launched) firms utter no cries.  Loosely speaking, it is a fully-employed economy (no 5.3% isn’t full employment, but 4.5% might be –  and that difference is swamped by the scale of the divergences evident in this chart), but it isn’t a path to sustained prosperity.   Non-tradables firms, especially in Auckland, do well –  as they do in every population-fuelled boom anywhere (in history or now) –  but it isn’t a path to sustained national prosperity.

Are there some caveats to the story?  Yes, sure. The Christchurch repair and rebuild process exacerbated the skew to non-tradables, and there wasn’t anything much we could do about that.  And high terms of trade, in principle, made it less necessary to produce tradables volumes (price substitutes for volume)….but, in the longer term, higher terms of trade tend to induce strong investment and volume growth in the sectors that are benefiting.  There was no sign of that in New Zealand.

As I noted, purists don’t like the tradables/non-tradables chart, for a variety of reasons (some good, others less so).  A couple of SNZ staff made an effort a couple of years ago to do a slightly more refined version. It was a worthwhile exercise, but I wasn’t persuaded that the more complex version materially altered the results, while making it a bit harder to explain just what had been done.  Bottom line: this has been quite an unbalanced, more inward-focused, economy for more than a decade now, and there is little real sign of that sustainably changing.


The IMF at sea on New Zealand’s (lack of) growth

As I noted yesterday, the IMF released several “selected issues” background papers in association with the release of the New Zealand Article IV report.  These papers are usually a little more in-depth than the main report, and the topics chosen reflect some mix of the expertise and interests of the people on the staff team and the priorities of the New Zealand agencies involved (Treasury and the Reserve Bank).  In my experience, the efforts of the team are often spread too thinly and so unfortunately not many of the papers have added very much to the understanding of the macroeconomic issues facing New Zealand.

The papers this time are:

  • Prospects for potential growth in New Zealand
  • House prices, household debt, and financial stability in New Zealand, and
  • New Zealand – Options for Tax Policy Reform

It would be interesting to know whose initiative the last paper was done at.  My guess is that Treasury may have reacted to the Fund’s anguishing about savings with the comment “well, show us what might actually make a difference”.   Unsurprisingly, the Fund doesn’t conclude on an optimistic note:

while there is some ambiguity on the effectiveness of tax incentives to raise private savings, short of the introduction of a compulsory savings scheme there are no alternatives to providing incentives.

There are real doubts our policies will work, but……we have to do something.  Not exactly reassuring.

The potential growth paper has a few interesting charts, and recognizes the probable importance (as a symptom)  of the ex ante savings/investment imbalances [1] that have given us persistently high real interest rates (relative to those abroad) and a real exchange rate that has been persistently out of line with medium-term fundamentals.  But the authors don’t have much of substance to offer on the way ahead.  They, like everyone else, can see the gaps between us and the world, but they don’t seem to have a “model” –  a way of thinking about or understanding the issues – that can usefully help respond to the specifics of New Zealand’s underperformance.

They believe

there are few if any low hanging fruit in terms of reform……..however, there may be targeted areas for improvement

They claim that

increasing New Zealand’s international exposure is a major aspect of productivity oriented reforms

but the actual list of reforms, and the evidence or arguments connecting them to the desired outcomes, is thin (and sometimes questionable), to say the least

  • “directly enhance innovation through greater expenditure on R&D”
  • “increase labour productivity through education”
and a couple of ideas picked up from last year’s OECD report
  • user and congestion charging for infrastructure, and
  • “more frequently update immigration targets and skill shortage categories”

The final paragraph of the whole paper begins by noting that there are “no obvious liberalization policies at hand”, and then lapses into the rather trite (because there is nothing to back it)

efforts would have to be made to exploit opportunities for greater international integration in order to boost competitiveness and overcome the disadvantage of distance

But for all this, in its apparent enthusiasm to accentuate the positive the IMF actually understates just how poorly New Zealand has done in recent years (or decades).   In particular, I was surprised to find this assertion in the report, citing the experience over the period 1995 to 2012.

Compared with other OECD countries, New Zealand’s TFP growth performance compares favorably

I was taken aback by this claim, and wondered what I had missed, so I went to check the data on the OECD website.  The OECD compiles TFP estimates for only 20 of its member countries.  Here is the total growth in TFP for each of them for that 1995 to 2012 period.

oecd tfp growth 95 to 12

We’ve been the lower quartile country for that whole period.  The only four countries which did worse over that period are either in the euro or tied to it (Denmark), and three of them (Spain, Italy, and Portugal) have had a simply atrocious economic performance in recent years.  If one looks as just the most recent 10 year period for which the OECD has data (2003 to 2013) we were actually second worst of all these OECD countries.

Estimating TFP growth rates involves a model – a way of estimating the contribution of capital and labour to growth, isolating the resulting TFP residual.  The OECD’s approach isn’t the only one, and I’m not sufficiently expert in the field to offer an opinion on which approach is best.  One other big international database that reports TFP estimates in the Conference Board, which produces estimates for a much wider range of countries.

I had a quick look at 37 pretty advanced economies for which the Conference Board reports complete data.  For the IMF’s chosen period –  1995 to 2012 –  there were only seven countries that had recorded less TFP growth than New Zealand had done  (the ones who did worse than us on the OECD measure, and Chile, Norway, and Greece (for whom the OECD reports no data).  So even on this measure, for this range of countries, we’ve been no better than a bottom quartile performer.  The Conference Board has data for all 37 countries as far back as 1989-  and since then, only Spain, Portugal, Greece, Turkey and Hungary have done worse than us.

The Conference Board reports estimates up to 2014.   Here is how those 37 countries have done over the most recent 10 years for which they have data, 2004 to 2014.

conference board TFP 04 ot 14

The picture doesn’t really change.  It is, perhaps, a little less bad than on the OECD’s ranking, but again we’ve been no better than a lower quartile performer.

TFP isn’t the be-all and end-all, and for minerals producers in particular it can be driven downwards in periods of high commodity prices (because less accessible, or lower grade, resources are (profitably) mined).  But there is really no way of looking at the New Zealand performance and reading it as any sort of good news story.

It is surely about time that the elites –  be it leading offshore agencies like the IMF and OECD, or our political and bureaucratic ones –  began to recognize, and state openly, just how consistently poor New Zealand’s economic performance has been, and to acknowledge just how limited or inadequate the policy responses they put up to deal with it  are, and have been.   Identifying policy responses might be hard –  although I reckon that a major reorientation of our immigration policy would go a fair way –  but the first step is an honest assessment that recognizes that what we have been doing simply hasn’t been working.  And it is no use falling back on “but its nice place to live” – as I’ve noted previously, Uruguay looks to have nice beaches – or “but lots of people want to come here” –  well, of course, poorly performing as we have been, we are still richer than China, India, South Africa or the Philippines.  The better test is what our own people are doing – and they just keep on leaving, even though the hurdles to doing so (in Australia in particular) have been getting higher

[1] They even approvingly cite my 2013 paper.


A chart for New Zealand’s national day

Cross-country comparisons of material living standards aren’t easy to do well, and especially for earlier historical periods when data are often patchy, to say the least.

But Professor Angus Maddison made the effort of compiling estimates for a range of a countries –  in some cases going back (with estimates every few centuries) as far as the year 1AD.  He used the best estimates he could find from other researchers where they were available, and did his own estimates to fill in some of the gaps.  As one gets further into the 20th century, more official or semi-official estimates could be used.

His fullest set of estimates for the last couple of hundred years was for a group of 16 Western European countries and the four advanced “offshoots” –  New Zealand, Australia, Canada, and the United States.     The estimates have to be taken with a considerable pinch of salt, but in broad outline they seem fairly consistent with other research on the relative prosperity of various countries.

Maddison reports an estimate for each country for either 1830 or 1840.  For New Zealand he uses an estimate for 1840 that was consistent with his estimates for much of Europe in 1000AD (and the same low estimate as he uses for pre-settlement Canada, US, and Australia).  If that estimate is even roughly right, then material living standards in New Zealand at the time the Treaty was signed were lower than those in all other 19 countries.

Here is how that ranking is estimated to have changed (using the Conference Board’s Total Economy Database, which builds on Maddison’s work, for the latest observation).

waitangi


Through some combination of immigration of people and technology, substantially (and often forcibly) displacing the previously dominant population and culture, fifty years later GDP per capita in New Zealand is estimated to have been among the very highest in the world.  One wouldn’t put much weight on precise numbers, but on this particular series, in 1910 no country had a higher GDP per capita than New Zealand.

But 100 years on, 16 of these 19 countries now have higher GDP per capita than New Zealand does.

Absolute living standards in all of these countries are, of course, far higher than they were in 1840.   And the evidence strongly suggests that living standards in New Zealand –  and Canada, US, and Australia –  are now far higher than they’d have been without European settlement (see here or here).  But the last 100 years has been a fairly dismal relative performance by New Zealand.  And there is no sign of that reversing again.