The little engine that could…and other fairy tales

“I think I can.  I …..think ….I…. can, I………… think……… I…………… can” said the little blue engine”

It was almost to the top.

“I——-think”

It was at the top.

“I ———can.”

It passed over the top of the hill and began crawling down the opposite slope.

‘I ——think——- I—— can——I—– thought——I——-could I—– thought—– I—– could. I thought I could. I thought I could.¨ I thought I could.”

And singing its triumph, it rushed on down toward the valley.

“The Little Engine That Could” is a heartwarming childhood tale, about hard work and a willingness to give anything a go.    Perhaps the Prime Minister once read the story to his kids.  But…….it is a story.   Technical capacity, not willpower, determines whether engines can pull loads, get over hills etc.   However, the Prime Minister now appears to have adopted the storybook as the basis for his latest, rather desperate, defence of his government’s immigration policy.

At his post-Cabinet press conference on Monday, the Prime Minister appeared to be –  as NBR put it –  practising his election lines.

Answering questions about New Zealand’s capacity to handle current levels of population growth caused, in part, by very high net migration, English appeared to practice attack lines for the forthcoming election campaign, saying he believed the ability to cope with these challenges was “going to be a key issue in the campaign”.

“We believe New Zealand can adjust to be a growing economy with a growing population,” he said. “Our political opponents think New Zealand isn’t up to it, it’s too hard and the solution is to shut down the growth by closing off international investment, getting out of international trade, closing down migration and settling for a kind of grey, low-growth mediocrity where the best thinking of the early (19)80s sets our political direction.”

and, from another account (which I will draw on but can’t link to)

English said that National unashamedly believes in New Zealand’s capacity to be a growing economy and that its political opponents unashamedly think New Zealand is not up to it.

Belief is one thing.  Evidence is (much) better.    Winning elections might be a different matter, but whether, and to what extent, large-scale immigration is providing long-term economic benefits to New Zealanders isn’t something to be determined by whose swagger is most convincing; who can put on the most macho stance, or who is most ready to kick sand in the face of the weedy doubters.  Wishing for benefits won’t make them happen.   Instead, it is a matter of calm balanced analysis and an assessment of the evidence of New Zealand’s experience.  We’ve had plenty of experience.   And that must be a point of some difficulty for defenders of the current large-scale non-citizen immigration policy, presumably including the Prime Minister.

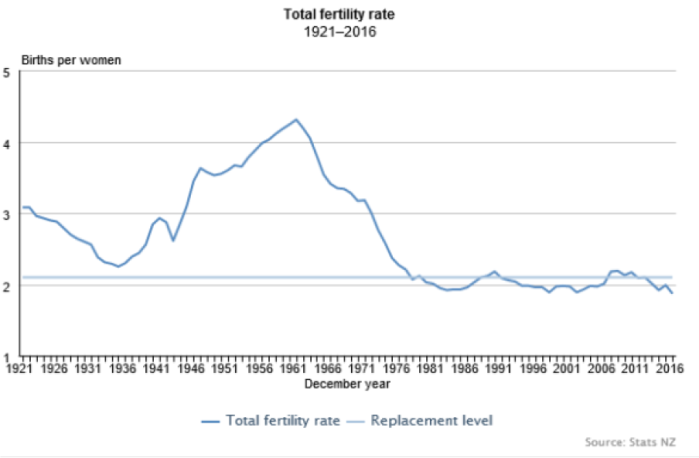
After all, 100 years ago, on the best available measures, New Zealand had among the very highest material living standards anywhere.   Some combination of abundant land, a temperate climate, dramatic reductions in transport costs, and refrigerated shipping had required more people to take advantage of the new opportunities, and enabled just over 1 million people to flourish in what was, by international standards, a highly-productive economy.  There were new opportunities here, and it took new people to take earliest and greatest advantage of them.

On some measures, even as late as around 1950 we still had some of the highest material living standards around.  There hadn’t been many more new opportunities specific to New Zealand in the previous few decades.  But, on the other hand, we’d avoided wars and revolutions at home.  It wasn’t much of a surprise that we were still wealthier than almost anywhere in continental Europe.

But mostly since then we’ve been slipping down the rankings, whether measured by productivity (the better measures) or average per capita income (which can always be boosted by working ever more hours).   After World War Two, large scale immigration, actively promoted by successive governments resumed.  Even then, leading New Zealand economists were sceptical.   All manner of arguments were run for actively pursuing increased population.  There were defence arguments, there were arguments about redistributing Britain’s excess population to the land-rich Dominions, there was the apparently-reasonable argument that opportunities and incomes were just better here.

But whatever the arguments, any economic gains just seemed to keep failing to show up.  Of course, we did lots of daft things during the post-war decades.  Trade protection meant that, for example, in the early 1960s we had twenty television factories in New Zealand, and we made or assembled here all sorts of stuff that would never have passed a market test.  In the late 70s and early 80s we poured money down the drain in the absurdly expensive energy Think Big projects (while being spared Roger Douglas’s ambition for 16 state-promoted carpet factories).   But strip all that stuff away –  as we did –  and we’ve still done badly.

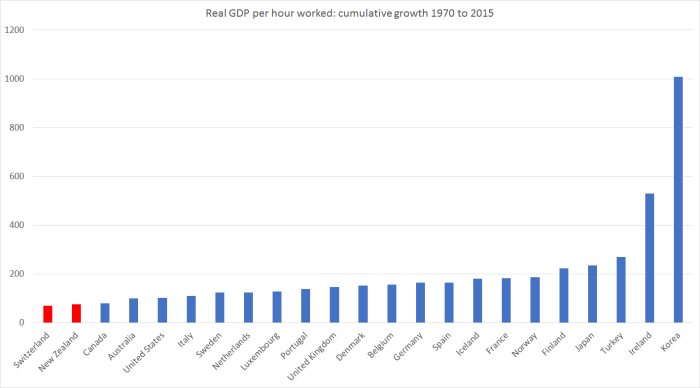
Productivity growth lagged that in other advanced economies in the 1950s and 60s.  Since 1970, data suggest that among advanced economies only Switzerland and, perhaps Mexico, have done worse than us.  And even since all the reforms of the late 80s and early 90s, we’ve still brought up the rear when it comes to productivity growth.  On average, we just keep slipping further behind those other advanced countries we were once so much better off than.

My friends on the right will emphasise how high taxes are, how much wasteful government spending there is, and how pervasive poor-quality regulation is.  And I have a great deal of sympathy with many of their individual points.   But the median OECD country isn’t really any better or worse than us on those scores (on some we do rather better than the median, on others quite a lot worse).   We could all do better, but the explanation for New Zealand’s continuing disappointing performance simply can’t rest in those traditional pro-market verities.

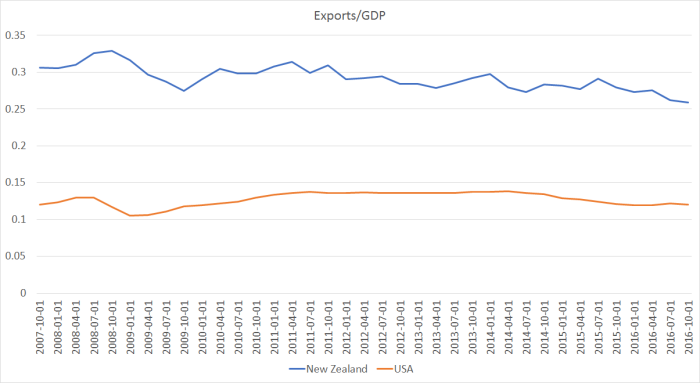
A much more plausible story is one that recognises that New Zealand’s wealth was largely built on able people, and good institutions, making the most of our natural resources.    It shouldn’t really be controversial; you can see it in our trade data.    As it always was, so it is today – the overwhelming bulk of our exports are the fruits of the land or sea (and I’ll count tourism in those numbers, since that it mostly what tourists come for).   Of course, there is small number of successful outward-oriented firms in quite different industries, but strip away the subsidised ones (export education and the film industry) and the numbers are really pretty small.

And not only are no new natural resources being made, but in New Zealand for many decades there hasn’t even been any really large new discoveries of usable natural resources that were hitherto unrecognised (or idiosyncratic shocks that strongly favoured New Zealand production from natural resources).  It is, surely, the big difference between the post World War Two experiences of New Zealand on the one hand, and Australia and Norway on the other.  The prosperity of all three countries rests largely on the natural resource products their able people, with good institutions, can sell to the rest of the world.  Norway and Australia were able to bring to market whole new resources that, while always there, were previously unknown or uneconomic to tap.  New Zealand has had nothing similar.  No new land, no new sea and –  so far –  oil/gas and mining activities that are of fairly peripheral scale.    If we’d known that difference 50 or 60 years ago, few people (if anyone) would have thought it would make a lot of sense to import lots more people to New Zealand.   Combining many more people with a key fixed factor (“land”) is simply a recipe for making it much more difficult than necessary to support top-notch living standards for the people who were already there.    And that is so even if one can get lots of productivity growth in the land-based sectors.

Of course, the standard pushback is along the lines of “but that is all old economy stuff; ideas and new technologies are the way of the future, and one can develop those industries anywhere –  all that matters is the people, the people, the people”.  Which would be fine, but the evidence seems to be against it.  When it comes making physical stuff, global value chains have become ever more important, and it is really hard for many firms located at the end of the earth to be part of such value-chains (whereas it is quite easy if you are in Slovakia or Korea).  And when it comes to ideas-based industries, counter-intuitive as it might seem, personal connections and proximity (to suppliers, markets, specialist resources, clusters of knowledge) seems to have become more important than ever.    All sorts of firms can be set up by people in New Zealand –  or in Patagonia, Port Stanley, or Windhoek.  But those firms, and those people, will usually command more value relocated nearer those global centres –  be they in Europe, North America or East Asia.   Wishing it was otherwise –  like believing I can fly –  simply doesn’t make it so.

New Zealand’s strength is its people, among the most skilled in the world, its institutions (absence of much corruption, rule of law etc) and its natural resources.    The latter are crucial –  that isn’t something of ideology, or old-school thinking, but of hard numbers –  and are, for practical purposes largely fixed.  (Add in our (self-chosen) climate change objectives and those natural resource opportunities could almost be argued to be shrinking.) But our disadvantage, and it is a severe one, is distance/location, and at least before teleportation is mastered, that disadvantage isn’t changing –  it is a land so remote that until perhaps 200 years ago, there simply was no foreign trade.

Against that backdrop, it is simply crazy to keep letting the central planners (politicians and bureaucrats) try to drive up the population.   New Zealanders know it in their own choices.   There is nothing shameful about a fairly flat population, whether in a country – plenty of rich European countries have had them for decades –  or a city.  But it seems almost heretical in New Zealand.  It makes sense that cities, or countries, grow when new opportunities abound.  The evidence to date strongly suggests they aren’t abundant here.   Some might think that a shame –  in some ways I do too –  but believing otherwise doesn’t make it happen.

Is there 100 per cent conclusive evidence?  No, in this life there hardly ever is.  But lets look at some of the straws in the wind:

  • among the very worst productivity growth in the OECD throughout the post World War Two period,
  • an export share of GDP that has stagnated and even gone backwards (in a country that once had among the very largest per capita exports anywhere),
  • a major city that has incredibly rapid population growth over decades, and yet of which even Treasury now observes “we are not seeing the agglomeration effects we would expect from Auckland’s size and scale.”

I’m for evidence-based policy.  If we’d seen more and more New Zealand firms successfully establishing themselves in international markets, and the export share of New Zealand’s GDP rising (as it typically does in successful catch-up economies), if we’d seen a decade of productivity growth materially outstripping that of the other OECD countries so that we were finally catching up, if we are seeing evidence that GDP per growth in Auckland was consistently far-outstripping that in the rest of the country (as we find in many other countries centred on knowledge-based industries) then (a) we could all celebrate, and (b) it might make sense to think about whether we should open our doors to lots of migrants.   As it is, we see none of those things.  And that with one of the largest (per capita) legal immigration programmes anywhere in the world.   It is madness; ideology (“big New Zealand” more than theoretical arguments typically) over experience.

But the Prime Minister and the National Party still “believe” apparently.  Perhaps they could show us their evidence?

I don’t like to make too much of the last few years’ experience.  Apart from anything else, data revisions could mean that stories that look good today eventually disappear like the morning mist.     But, for what it is worth, the last few years don’t do much to instill confidence.

There is the dysfunctional housing and land supply market for example.  Sure, you can argue that it really has nothing to do with immigration policy, but if you can’t or won’t fix up the land supply market –  and neither this government nor its predecessors have –  don’t give us the nonsense that New Zealand can cope with his immigration policy.   Even if there aren’t large productivity costs from those land-use restrictions (I’m open-minded on that in New Zealand) the distortion to real house prices, that makes purchasing a home more and more difficult in our cities is a standing reproach to our leaders.

And then there is productivity.  I’ve repeatedly showed charts of real GDP per hour worked in New Zealand, where the data suggest we’ve had no growth at all in the last five years (even though the dogma suggests large immigration should be generating positive productivity spillovers).  It is often hard to get timely cross-country comparisons, but earlier this month the Conference Board released their latest annual estimates of real GDP per hour worked.    Here is how New Zealand has compared over the last five years (2011 to 2016) with a sample of 40 or so other advanced countries (the group I often use –  EU members, OECD members, plus Singapore and Taiwan).

2011 to 2016 growth in real gdp phw

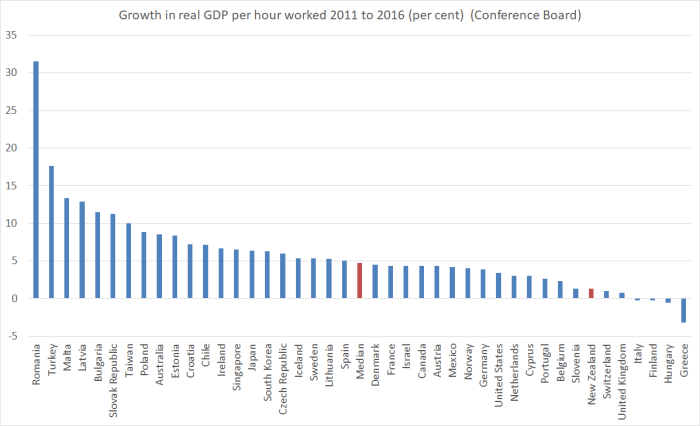
And it isn’t just because those other countries were recovering from deeper recessions.  Our labour productivity growth also lags behind the median of these countries for the whole period since 2007 (just before the recession).  It is just the same old story of underperformance.   Are there mitigating factors?  Probably always to some extent.   The Canterbury rebuild inevitably dragged resources away from other uses.  On the other hand, relative to our worst decade of economic underperformance –  the 1970s –  the terms of trade have mostly been pretty good this decade.

With the export share of GDP drifting further backwards, it looks more and more like an economy that exists on building for each other.  Nothing wrong with that in one sense –  people need houses, offices, roads etc –  but it isn’t how economies successfully catch-up with those richer and more productive than them.  That typically involves finding more and better things to successfully take to world markets.

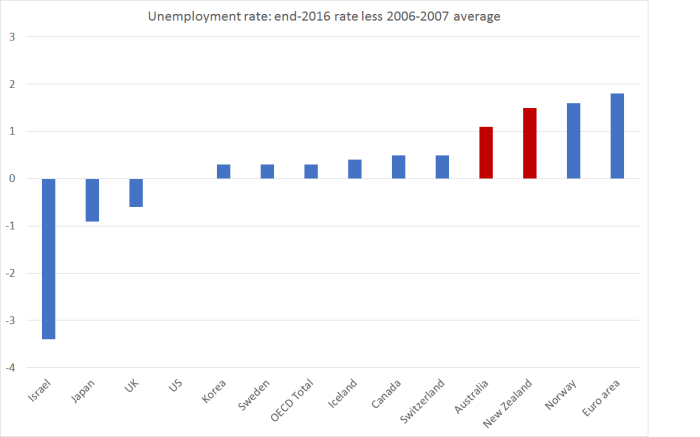
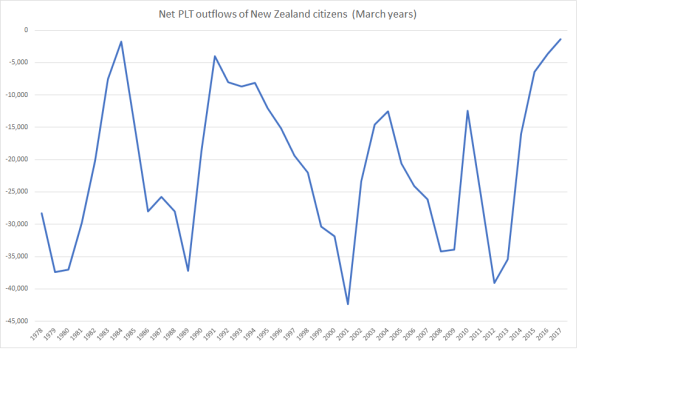
In his post-Cabinet news conference, the Prime Minister was also making much of the contribution to the net migration numbers of the decline in the outflow of New Zealanders to Australia.    That, he claimed. “was a vote of confidence in New Zealand”.   Perhaps it sounds good politically to say it, but lets face reality.  New Zealanders have gone to Australia is fewer numbers mostly because the Australian labour market is tough – the unemployment rate and underemployment rates linger high, and there is increasing awareness of how much on their own New Zealanders are in Australia if things don’t work out well.     And even though the labour market is tough, look at Australia’s productivity growth (from a much higher starting point) relative to ours in the previous chart.  It isn’t so much a vote of confidence, as an unexpected loss of an escape valve.   That makes things even tougher for New Zealand, especially when the government keeps on bringing in much the same number of non-New Zealanders as ever.   In the short-term it gives the economy a boost –  demand effects exceed supply effects in the short-term –  but in the longer-term it just keeps worsening New Zealand’s relative performance on the sorts of economic measures that matter.

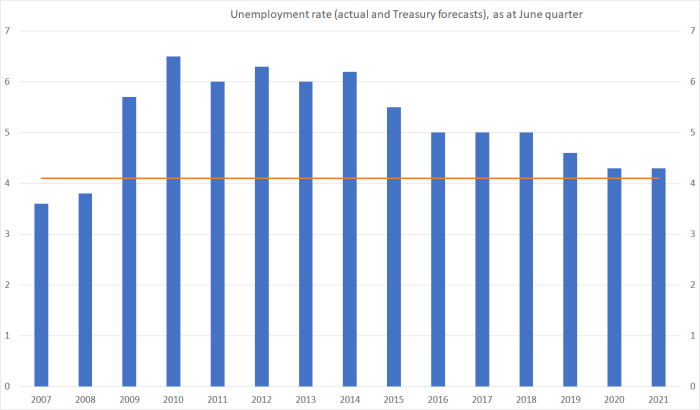
The Prime Minister was also at pains to stress that he believed New Zealand –  government and private sector – could and would invest enough to handle the rapid growth in the population.  The evidence has long been against him on that one.  Despite having had one of the faster population growth rates in the OECD, we’ve long had one of the lower rates of business investment among OECD countries.   In a well-functioning economy with high productivity growth etc you’d expect it to be the other way round –  more people should need more investment, of all sorts.

My arguments are generally specifically focused on New Zealand –  opportunities in Ireland or Belgium may well be different than in, say, New Zealand, Tasmania or Nebraska.   But for what it is worth, here is a scatter plot, using IMF data, of population growth rates and investment as a share of GDP for the countries the IMF classifies as advanced.  I’ve used data since 1995, simply because that is the period for which the IMF has data for all countries.   Recall that one really should expect investment as a share of GDP to be higher in countries with faster population growth than in those with lower population growth, all else equal.

But

IMF scatter plot

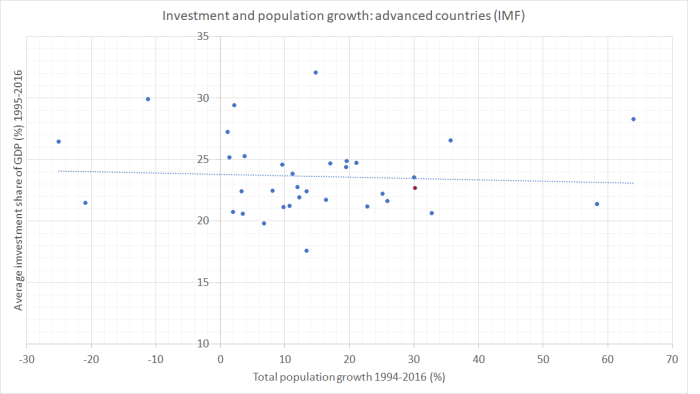
There is almost no relationship at all – and certainly not the expected upward-sloping line.  If anything, the relationship is slightly negative.  And New Zealand –  the red dot above 30 on the horizontal axis –  doesn’t stand out from the pack.  Since people do have to live somewhere, it looks a lot like rapid increases in population tend to crowd out (rather more price sensitive) business investment.    Perhaps it isn’t surprising then that many of the advanced countries with the strongest growth rates in productivity also have flat, or even falling, populations?  But, whatever the wider story, there isn’t much reason in the international data to believe the Prime Minister’s wishful thinking that enough will be invested and all will be fine.  And when your country already has some of highest real interest rates, and a persistently overvalued exchange rate, it is probably safer to believe that all won’t be just fine.

I could go one, but I just wanted to make two final brief points:

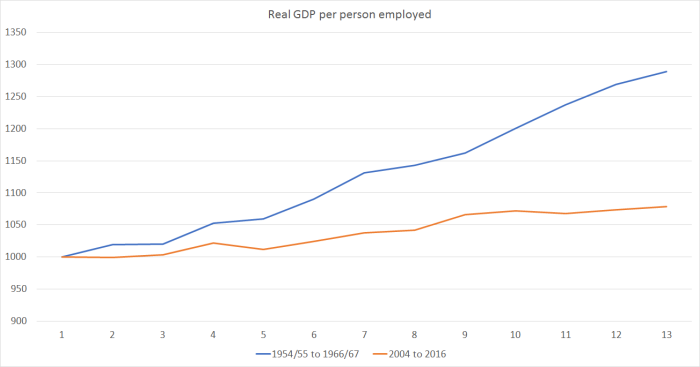
  • in his comments quoted earlier the Prime Minister suggested that somehow the alternative to continuing very high immigration targets involved “settling for a kind of grey, low-growth mediocrity where the best thinking of the early (19)80s sets our political direction”.   Personally, I’d say the very best thinking from the early 80s –  that of reformers at Treasury and Reserve Bank for example –  was very much to the point.  But even setting that to one side, the Prime Minister’s attempted slur might well rebound.  I checked out productivity growth for the nine years to 2016, compared to the nine years to 1984.  In those 9 years of Sir Robert Muldoon’s stewardship, growth in real GDP per hour worked was (according to the OECD) 9.0 per cent.   Not great.  But on the Treasury’s preferred measure of real GDP per hour worked (and even correcting for the break in the series last year), productivity growth from 2007 to 2016, totalled about 5.5 per cent.    The Prime Minister was Minister of Finance for most of that period.   (Yes, sure there were plenty of other imbalances, bad choices etc then, as well as terrible terms of trade….but they still achieved faster productivity growth).
  • I could commend to the Prime Minister a column in The Australian yesterday from Australian labour economist Judith Sloan (there are extracts and commentary on it here).   Notwithstanding Australia’s stronger productivity growth, and overall higher incomes, she slams the Australian government’s substantial immigration target (just slightly smaller, in per capita terms, than New Zealand’s), noting in particular the ‘cynical charade’ in professing concern about house prices while doing nothing about immigration (land supply –  a major problem in Australia too –  isn’t under federal government law).  Sloan isn’t just any economist.  She led the Australian Productivity Commission 2006 inquiry into Australian immigration.  And in many respects, she is about as “right-wing” as they come (to the extent such slogans have meaning), so much so that she was nominated by ACT and the Business Roundtable, and then appointed by the government, to serve on our own 2025 Taskforce a few years ago, where she was instrumental in ensuring that that Taskforce did not champion New Zealand’s immigration policy.   She doesn’t write about New Zealand these days, but it would be surprising if her conclusions about our policy were les stridently expressed than those about Australia’s

The Prime Minister can “believe” all he wants. He can attack Opposition parties all he wants (and we have yet to see specifics of what either Labour or NZ First propose), he can diss a former leading figure of the business and economic establishment, Kerry McDonald, he can ignore the counsel of someone as able in this area as Judith Sloan.  But what he seems unable to do is offer any evidence that his immigration is, or ever will, work for the benefit of New Zealanders.

Emissions again

After my post the other day, I pricked up my ears when I heard on the radio this morning that new data on greenhouse gas emissions had been released, and at the same time heard various industry lobby groups calling for more government support (money or regulation”) for this, that or the other mitigating measure.  It is the costs of meeting the New Zealand government’s emissions reduction target that worries me.

(As it happens, I was emitting carbon at the time, driving home from the supermarket in a petrol-fuelled car.  But I had already walked up the (rather steep) hill carrying several kilos of groceries home earlier in the morning.)

Today’s release consists primarily of a 542 page report from the Ministry for the Environment (MfE).  But they also had a convenient eight page summary document.

In my post the other day, I included this chart of GDP per capita for OECD countries, in the most recent year for which there is data, 2014.

emissions per GDP

New Zealand was second only to Estonia in the level of emissions per unit of GDP.

I was interested to see that MfE made reference to this measure in their snapshot report.  Under the heading “New Zealand’s economy is growing faster than our emissions”, they included this chart.

MFE emissions

That looks quite good on first glance.

But how, I wondered, did New Zealand compare to other OECD countries?  You’ll notice that on that chart emissions per unit of GDP fell in 2015.  Since the OECD databases aren’t yet updated for 2015, and we don’t know what happened to other countries in 2015, the following charts use the data only for 1990 to 2014.    (MfE also report a rebasing of the entire series, slightly lowering New Zealand’s estimated emissions over the whole 25 year period.  But relative to the charts below this rebasing would worsen  New Zealand’s relative performance, since the revision downwards for 1990 was a little greater than the revision downwards for the more recent years.)

Here is emissions per unit of GDP for those OECD countries (all but one) for which there is 1990 data.

emissions 1990

In 1990 we were only sixth highest in the OECD.   And by 2014 we were second highest.  I guess the Ministry for the Environment (and their Minister) weren’t too keen on highlighting that point.

Here is the percentage changes in emissions per unit of GDP to 2014 (for a small number of countries only 2013 data is available).  MfE highlighted that New Zealand’s emissions fell by 35.9 per cent from 1990 to 2015.

change in emissions

Only 10 OECD countries had smaller reductions in emissions per unit of GDP than New Zealand over this period.  Of them, one might reasonably think that severe economic stresses (falls in GDP) in recent years might help explain Italy, Spain, Greece and Portugal.  And as Japan’s emissions rose a lot in 2011,  the year of the earthquake/tsunami, the enforced shift away from nuclear power at the time probably explains what is going on there.

Of the five countries that were to the right of New Zealand in 1990, four had among the largest percentage reductions among OECD countries.  Even Australia’s reduction was around the median.  It does leave New Zealand rather standing out.

(Perhaps some of this is covered in more depth the 542 page report.  I went through the Executive Summary and the table of contents and couldn’t see any likely references, but I may have missed them.)

In the snapshot document, straight after the emissions per unit of GDP chart, MfE does have a brief section on

Some of the challenges New Zealand faces when reducing emissions include:

  • a growing population
  • almost half our emissions are from agriculture where there are fewer economically viable options currently available to reduce emissions
  • an electricity sector that is already 80.8 per cent renewable (meaning that we have fewer ‘easy wins’ available to us compared to other countries who can more easily make significant emissions reductions  by switching to renewable sources of electricity).

I was very pleasantly surprised to find the “growing population” as the first item on the list (it isn’t particularly relevant to emissions per unit of GDP, but is very relevant to total emissions –  the variable in terms of which our government’s target is expressed).

It is hard to disagree with them  But it does leave one wondering what advice or research/analysis they have done, and provided to Ministers –  including when the target was being adopted –  about the implications of New Zealand’s immigration policy.  Our non-citizen immigration policy pushes up the population by almost 1 per cent per annum (against an, admittedly unrealistic, benchmark of zero inward migration of non-citizens).  Have they analysed the potential costs and benefits from lowering the non-citizen immigration target relative to other possible abatement (or compensation) mechanisms?  Perhaps there is credible modelling that suggests the overall abatement costs to New Zealanders would be lower through other plausible mechanisms.  But given that population increases appear first, and without further commentary, on their lists of “challenges” it would be good to know if they have done the work.

On reflection, I think I will lodge an Official Information Act request to find out.

(And it still leave me mystified why, when even the government’s own Ministry for the Environment is citing continuing population increases as a constraint on meeting the emissions reduction target, the Green Party continues to support large non-citizen migration inflows.  Migration might only transfer people from one country to another but given (a) the issues around agriculture, and (b) the reasonable notion that New Zealand members of Parliament should be looking out first for the interests of New Zealanders, it shouldn’t be a consideration they can simply ignore in thinking about New Zealand’s ability (and at what cost) to meet the emissions reduction target.)

Another Budget in an underwhelming economy

If people had wanted a centre-left government, one might suppose that they would have voted for the real thing.  Despite the additional redistribution announced in yesterday’s Budget, perhaps they still will.

Still, for all the headlines about money being put (back) in people’s pockets, it is worth keeping the overall numbers in perspective.  Core Crown tax revenue as a share of GDP was 27.8 per cent last year, is estimated at 27.7 per cent of GDP this year, is forecast at 27.5 per cent in 2017/18, and in the final forecast period it is predicted to be 27.7 per cent.  The government isn’t yet shrinking its pre-emptive claim on overall economic resources.  Expenditure as a share of GDP is forecast is gradually shrink, and if that was sustained –  which will be a challenge, including because of the reluctance to act soon on NZS –  it could open the way to future real reductions in the tax burden.

It is sad to reflect that much of the increased spending announced yesterday was simply a palliative for the failures of the government.   The cost of housing is, pure and simple, the fault of successive governments’ land-use regulation.  In a country with plenty of land, and the lowest real interest rates for decades, housing should be more affordable than ever.  That it isn’t, should be something governments are held accountable for (and although governments of both parties have had much the same flawed policies, the current government has now been in power for almost nine years).    And the lack of productivity  growth –  recall that we have had none at all for five years now –  is the biggest single thing that holds back the income growth of working people.    With a well-functioning housing market, and an economy with robust productivity growth, many of the pressures that led to increased spending yesterday would simply have been unnecessary.

As for tax, how many more decades will we have wait before a simple reform like inflation-indexing the income tax brackets is enacted?  Even the United States, with its enormously complex and distorted tax code, manages that one.

Perhaps more importantly, for all the rhetoric about encouraging enterprise –  and more subsidies for favoured uneconomic industries (film, rail and so on), there was no sign at all of action to lower what is probably the most costly and distortionary major item in our tax system –  the company tax rate.   It is curious to reflect that the previous Labour government cut the company tax rate more than the current government has.

I ran this chart a few weeks ago
company tax rates

New Zealand’s company tax rate is in the upper third of OECD member country rates.   For a country that talks a good game about welcoming foreign investment, and supposedly aspires to reverse the decades of productivity underperformance,  it simply isn’t good enough.    Politicians seem afraid of making the well-established economic point that taxes on businesses are typically borne substantially by wage-earners, not by owners of capital.   Less investment than otherwise means fewer high productivity and, thus, high wage jobs.  And if our company tax rates are high, it makes it harder for overseas investors to justify locating an operation here rather than in a lower tax country.   For a country with a pretty disadvantageous location to start with, it is the sort of additional burden we shouldn’t be putting on enterprise.    (I’ve focused this paragraph on foreign investors.  Taxes also discourage domestic-owned business investment, but for owners of those businesses, the maximum personal tax rate is ultimately the important consideration, rather than the company tax rate itself).

Anyone who listened to, or read, the Budget speech itself was clearly supposed to come away with a message about how well the New Zealand economy was doing.  There on the very first page was the Minister’s claim

“Our economy is 14 per cent larger than it was just five years ago”.

Yes, but the population is about 8 per cent larger.  That would leave an annual average growth in per capita terms of 1.1 per cent.  Better than nothing, to be sure, but not the sort of stuff most finance ministers would want to boast about.

And Treasury’s own numbers –  done at arms-length from the Minister –  don’t really back up the Minister’s story, whether cyclically or structurally.

Take the cyclical position first.  Here is Treasury’s estimate of the output gap (positive numbers suggest activity and demand are running a bit ahead of what is sustainable –  “potential GDP” – and negative numbers suggest there is still slack in the economy).

treasury output gaps

On these estimates, New Zealand will have had a negative output gap –  resources being underutilised –  for 10 consecutive years, including the whole of this government’s term to date, and the next year as well.    One can argue all one likes about what governments should or shouldn’t have done to lift potential productivity growth, but these estimates just take for granted what actually happened with structural policy and look at the cyclical position.  And there is really no excuse for putting the economy through such sustained period of resource underutilisation.  I can’t think of any time in modern New Zealand history, when the output gap would have been negative for so long.

Output gap estimates are pretty bloodless things, that don’t necessarily resonate with a wider audience.  They also can’t be observed directly.   But here are the unemployment rate numbers (actual and Treasury forecasts).

Tsy U

Last year, Treasury told us that they thought the

Treasury takes the view that the unemployment rate consistent with full employment (the nonaccelerating inflation rate of unemployment or NAIRU) has also fallen over time, so that…. it would be closer to 4.0%

I’m not sure precisely what number they had in mind, although in a chart included in that 2016 paper, the unemployment rate levelled out at around 4.1 per cent, so I included an indicative NAIRU line in my chart at 4.1 per cent.   But whatever the precise estimate, on official numbers and Treasury estimates we are looking at 10 years (or perhaps 11) with an unemployment rate higher than necessary to keep inflation in check.  The government has consistently presided over less than full employment.  That is simply poor economic management, and since we know that having a job is one of the best ways to secure better life outcomes, it is pretty poor management more generally.

Perhaps such unfortunate results might be excusable in a country that had no discretionary monetary policy leeway left (interest rates were already at or just below zero), or which was in fiscal crisis and had no borrowing capacity left.   Places like Portugal spring to mind.    But not New Zealand.   We have a floating exchange rate and our OCR has never got below 1.75 per cent (and even if that capacity had been exhausted, our public debt has been relatively modest).

It is also easy –  and right at one level – to blame the Reserve Bank.  They do short-term macroeconomic management.  But only as agent for the government and the Minister of Finance.  The Minister sets the targets and is ultimately responsible to citizens for their performance.  I do hope that Treasury, in offering advice to the Minister of Finance (whoever he or she may be after the election) on the appointment of a new Governor, and the design of the PTA, will take seriously the record of underperformance over the last decade.  This isn’t some trivial inside-the-Beltway governance issues.  These are real lives and opportunites that are unnecessarily blighted.

The government also likes to pretend that New Zealand’s economy is doing very well by international standards.   Thus, we are told by the Minister that

“we are at the moment growing faster than the United States, the UK, Australia, the EU, Japan and Canada”

One would certainly hope so.  Our population is growing materially faster than the population in any of those countries/regions.

But what about per capita growth?

I noticed various commentators yesterday suggesting that Treasury’s growth forecasts looked a bit optimistic.  I had some sympathy for that view, but here I’ll just take them at face value.   And I wondered how their forecasts for real per capita GDP growth compared to those the IMF has recently published for each advanced economy.

Treasury forecasts on a June year basis, and the IMF numbers are for calendar years. Over a forecast horizon of four years (Treasury’s horizon), it shouldn’t make much difference.    In the chart below I used Treasury’s forecasts of real per capita growth for the four years to June 2021, and compared them to the average of the IMF’s forecasts for the four years to December 2020 and the four years to December 2021.

IMF forecasts of real GDP pc

If the Treasury numbers are right for New Zealand, our growth in real GDP per capita would be just slightly below that of the median advanced country over the next four years.   I guess that isn’t that bad, but it isn’t much to boast about either.

After all, our per capita incomes are a long way down this list of countries.  On the IMF’s numbers

IMF real GDP pc.png

The aim –  supposedly –  for a very long time has been to catch up again with those top tier countries, almost of whom we were richer than not that long ago.    And catch-up or convergence certainly isn’t unknown, or unexpected, for other countries.   Here is how those Treasury forecasts for New Zealand’s real per capita GDP growth compare to the IMF’s for the 12 countries poorer than us.

IMF and the poor advanced countries

We only manage to beat two of those countries.    In fairness, of course, some of those poor advanced countries are recovering from savage recessions.    But even if one just focuses on the six former eastern-bloc countries, all but one is forecast to not only manage faster per capita growth over the next few years, but also to have achieved faster growth than New Zealand for the whole period from 2007 (just before the global recession) to 2021.  They are catching up. We aren’t.

(Compared with the richest 12 advanced countries, we are forecast to match the median per capita growth rate of those countries over the next four years, but the eastern Europeans are actually catching up.)

In wrapping up his Budget speech, the Minister of Finance claimed that

“we have a strong and growing economy built on a strong economic plan.  We must maintain our focus on growing the economy and sticking to the plan”

Earlier he had claimed that

Under the Government’s strong economic leadership, New Zealand is shaping globalisation to its advantage.  We’ve embraced increased trade, new technologies, innovation and investment.

All this in a country where exports as a share of GDP have been shrinking.  And productivity growth has been all-but-non-existent for years.

The bare-faced cheek of these assertions should be breath-taking.  Sadly, it seems like just another episode in a long succession in which the government simply makes stuff up.


More people means more emissions. So how about fewer people?

I’ve never had that much interest in climate change.  Perhaps it comes from living in Wellington.   If average local temperatures were a couple of degrees warmer here most people would be quite happy.    And as successive earthquakes seem to have the South Island pushing under the North Island, raising the land levels around here –  you can see the dry land that just wasn’t there before 1855 –  it is a bit hard to get too bothered about rising local sea levels.  Perhaps it is a deep moral failing, a failure of imagination, or just an aversion to substitute religions.  Whatever the reason, I just haven’t had much interest.

But a story I saw yesterday reminded me of a post I’d been meaning to write for a few weeks.  According to Newshub,

In documents released under the Official Information Act, a briefing to Judith Collins on her first day as Energy Minister says the cost to the economy of buying international carbon units to offset our own emissions will be $14.2 billion over 10 years.

In the documents, officials say “this represents a significant transfer of wealth overseas”, and also warn “an over-reliance on overseas purchasing at the expense of domestic reductions could also leave New Zealand exposed in the face of increasing global carbon prices beyond 2030”.

The cost amounts to $1.4 billion annually.

The Green Party says the bill will only get bigger if no action is taken by the Government to reverse climate pollution, and it continues to open new coal mines and irrigation schemes.

Roughly speaking, this suggests we’ll be giving roughly 0.5 per cent of GDP each year to people in other countries, just because of an (inevitably) somewhat arbitrary emissions target.   Many useful economic reforms might struggle to generate a gain of 0.5 per cent of GDP.  These are large amounts of money, inevitably raised at a still larger real economic cost.   And this is on top of the economic costs of domestic abatement policies.

Of course, whatever New Zealand does in this area makes no difference to the global climate.  We are simply too small.  Most people recognise that we sign up to arbitrary targets through some (not unrelated) mix of wanting to be a good international citizen and (perhaps as importantly) being seen as a good international citizen.  If we were regarded as not “doing our bit” there might be a risk of trade restrictions or other adverse repercussions a little way further down the track.

If one is an emissions and climate change zealot, the New Zealand data looks like it could give you grounds for zealotry.   For example, here are total emissions (in CO2 equivalent terms) per unit of GDP (using PPP exchange rates), from the OECD databases.  Why per unit of GDP?  Well, generating GDP takes various inputs, and emissions of greenhouse gases are often one of them.

emissions per GDP

But emissions levels are, at least in part, about geography and industry structure.  They aren’t just a matter of “wasteful” choices.   Thus, steps to reduce emissions might also reduce the number of units of GDP.   (In emissions per capita terms, we don’t rank as far to the right –  being quite a lot poorer than (say) Australia, Canada and the United States).

The self-imposed emissions reductions targets are, I gather, expressed in terms of total emissions.    Again using OECD data, here is how the various countries have done on that score since 1990 (the typical reference date –  and a somewhat convenient one for the former eastern bloc countries, which often had very inefficient heavy industries).

emissions total

But one of the things that marks us out relative to most of the OECD (and certainly relative to those former eastern bloc countries on the left of the chart) is the rapid growth in population we’ve experienced since then.   In fact, New Zealand’s population has increased by more than 40 per cent since 1990.  By contrast, all the world’s high income countries’ population has increased by only around 15 per cent over the same period.   And all else equal, more people tend to mean more emissions  (although no doubt it isn’t a simple one-to-one relationship).

In per capita terms, our greenhouse gas emissions have actually fallen since 1990.  Of course, so have those of most OECD countries.  Here are the data.

emissions pc

Our average per capita emissions have been falling less rapidly than many other OECD countries, but not that much less rapidly than the OECD total.   And all this in a country where I gather –  from listening to the occasional Warwick McKibbin presentation –  that the marginal cost of abatement is higher than almost anywhere in the world.  Why?  Well, all those animals for a start.  And the fact that we already generate a huge proportion of our energy from renewable sources (all that hydro).  And, of course, distance doesn’t help –  aircraft engines use a lot of fuel, and neither a return to sailing ships nor the prospect of, say, solar-powered planes at present seem an adequate substitute.

So you have to wonder how our government proposes to meet its self-imposed targets, without doing so at great cost to the living standards of New Zealanders.

In fact, it seems the government is wondering just that.   A few weeks ago,

The Minister for Climate Change Issues, Hon Paula Bennett, and the Minister of Finance, Hon Steven Joyce, today announced a new inquiry for the Productivity Commission into the opportunities and challenges of a transition to a lower net emissions economy for New Zealand.

The terms of reference are here.    As they note

New Zealand has recently formalised its first Nationally Determined Contribution under the Paris Agreement to reduce its emissions by 30 percent below 2005 levels by 2030. The Paris Agreement envisages all countries taking progressively ambitious emissions reduction targets beyond 2030. Countries are invited to formulate and communicate long-term low emission development strategies before 2020. The Government has previously notified a target for a 50 per cent reduction in New Zealand greenhouse gas emissions from 1990 levels by 2050.

Which does look a little challenging (in 2014 total emissions were about 3 per cent lower than 2005 levels –  30 per cent looks a long way away).  That isn’t too surprising.  After all,

  • the marginal cost of abatement is particularly high in New Zealand
  • the rate of population growth in New Zealand has been rapid, and
  • the rate of population growth is projected, on current policies, to continue to be quite rapid.

In fact, SNZ project another 25 per cent population growth by 2050 –  quite a slowing from here, but still materially faster than the populations of most other advanced economies will be growing.  And, recall, more people typically means, all else equal, more emissions.    The 2050 target, in particular, requires quite staggering reductions in per capita emissions –  actual emissions now are a quarter higher than in 1990 –  if anything like these population increases actually occur.

The terms of reference for the Productivity Commission inquiry go on at  length about all manner of things, including noting (but only in passing) that there may be “future demographic change”.

Recall that New Zealanders are actually doing their bit to lower total emissions. Our total fertility rate has been below replacement for forty years.  And (net) New Zealanders have been leaving New Zealand each and every year since 1962/63.    If New Zealanders’ personal choices had been left to determine the population –  the natural way you might think –  total emissions in New Zealand would almost certainly be far lower than they are now.   Check out the low population growth countries’ experiences in the second chart above.

Instead, we’ve had the second largest (per capita) non-citizen immigration programme anywhere in the OECD (behind only Israel),  a programme that (as it happens) got underway just about the time (1990) people benchmark these emissions reductions targets to.

As I’ve noted repeatedly, neither the government (or its predecessors), nor the officials, nor the business and think tank enthusiaists for large scale immigration, can offer any compelling evidence for the economic benefits to New Zealanders (income and productivity) from this modern large scale immigration.    And when they do make the case for large scale immigration, they hardly ever mention things like emissions reductions targets (I’m pretty sure, for example, there was no reference to this issue in the New Zealand Initiative’s big immigration advocacy paper earlier in the year).    Even if, to go further than I think the evidence warrants, one concluded that the large scale immigration had made no difference at all to productivity levels here (and remember that, for whatever reason, we have actually been falling slowly further behind other countries over this period despite all the immigration), once one takes account of the substantial abatement costs the country is likely to face if it takes the emissions reduction target seriously, the balance would quite readily turn negative.    We would need to have managed quite a bit of spillover productivity growth from our not-overly-skilled immigration programme (and recall that no gains have actually been demonstrated)  just to offset the economic costs, direct and indirect, of meeting emissions reduction targets which are made more onerous by the rapid increase in population numbers.

So I do hope that as the Productivity Commission starts to think about how to conduct their emissions inquiry, they will be thinking seriously about the role that changes in immigration policy could play in costlessly (or perhaps even with a net benefit) allowing New Zealand to meet the emissions reductions targets it has set for itself.  On various assumptions about the economic costs or benefits of immigration, how would the marginal costs of abatement compare as between lowering the immigration (residence approvals) target, and other policy mechanisms that are more often advocated in this area?   It would be interesting to see the modelling work on these issues.  If the Productivity Commission doesn’t take seriously the reduced immigration option, it would be hard not to conclude that ideology was simply trumping analysis.

Of course, reduced population growth through lower immigration isn’t a solution for every country.  On the one hand, people who don’t come here, stay somewhere else.  And on the other, most advanced countries have much smaller immigration programmes than we do.  But if it isn’t a solution for every country,  it looks like a pretty sensible and serious option for New Zealand specifically.  And the interests of New Zealanders should be the primary focus of our policymakers, and their advisers.

It is also brings to mind the old question as to why the Green Party in particular seems to remain so committed to large scale immigration, and the “big New Zealand” mentality, that has driven politicians here (of all stripes) for more than a century.  Not only would a lower population be consistent with New Zealanders’ personal revealed preferences (birth rates and emigration) and actions, it would assist in meeting emissions targets.  Perhaps to idealistic Greens that seems like “cheating” –  it doesn’t reduce global emissions, although it may put the people in places where the costs of reducing global emissions is cheaper than it is here.

But even if so, then what about one of those other pressing Green concerns –  water quality and the pressure on the environment from the increased intensity of agriculture?  There is increasing recognition across the political spectrum that there is a major issue here, and it is an area where New Zealand actions and choices make all the difference.   Cut back the immigration target and, over time, we would see lower real interest rates and a lower real exchange rate.   Against that backdrop it becomes much easier to envisage governments being able to impose much stiffer, and more expensive, standards on farmers (the offset being the lower exchange rate).      With a less rapidly-growing population, the (probable) reduced growth in agricultural output would be less of a concern (economically) and real progress could be induced on the environmental fronts (emissions and water pollution etc), without dramatically eroding the competitiveness of New Zealand’s largest tradables sector.

(Much the same sort of argument can be advanced in respect of congestion and pollution costs associated with growth in tourism: less rapid immigration would result in a lower real exchange rate, making it more feasible (economically and politically) to levy the sorts of charges that might effectively deal with pressures that the sheer number of tourists is imposing in some parts of the country –  in a country where the natural environment is really what draws people.)

It is past time for a serious debate on just what economic gains (if any) New Zealanders as a whole are getting from continued large scale non-citizen immigration.  The emissions reduction target might be seen by some as an arbitrary, even unnecessary, intervention, and is no doubt seen by others as a moral imperative, perhaps the very least we could do. I don’t have a dog in that fight.  But the targets are a fact –  a domestic political reality, and probably an international constraint we have to live with even if we didn’t really want to.  Against that background, and given the high marginal cost of abating greenhouse gas emissions in New Zealand, and with little or no evidence of other systematic gains to New Zealanders from the unusually large scale immigration programme we run, we really should be taking more account of our immigration policy in thinking about how best (most cheaply) to reduce effectively greenhouse gas emissions, as well as the water pollution that increasingly worries many New Zealanders.

New Zealanders’ population choices

The other day Statistics New Zealand released the annual data on New Zealand birth rates.  There was some coverage of the continuing drop in teen birth rates (it was what SNZ highlighted), but the chart that caught my eye was this one.

TFR NZ SNZ

I’d been under the impression that New Zealand’s birth rate was at, or just above, replacement (roughly 2.1 births per woman, thus allowing for early deaths).   And, according to this summary indicator, it was for a few years not that long ago.    But that is no longer the case.

But what most interested me –  and it isn’t data I’ve ever paid that much attention to –  was the longer-term averages.  It turns out that for forty years now, New Zealand’s birth rate has averaged below the replacement rate (1977 was the last year the TFR had been persistently above 2.1).

This is how we compare with other OECD countries.

tfr OECD

New Zealand is still towards the right of the chart.  But note that only two OECD countries now have total fertility rates in excess of replacement –  one (Mexico) just barely.  The country that really stands out is Israel, with a TFR of 3.1.   New Zealand hasn’t been that high for 45 years.

(Diverting off topic for a moment) the gap between Israeli and New Zealand birth rates has been there for a long time.

TFR is and NZ

At one stage, the high Israeli birth rates were all about the Arab population, but apparently the Jewish and Arab-Israeli birth rates are now equal (Arab rates falling and Jewish rates –  especially among the orthodox –  rising.   (Israel also has a lot of immigration –  together they explain the very rapid population growth I highlighted yesterday – but that is a topic for another day.)

For forty years, New Zealanders in aggregate have been choosing to have slightly fewer children than would, all else equal, maintain the population.  But over that same period, there has also been a very large outflow of New Zealanders moving permanently to other countries (especially Australia).   In the forty years to March 2017, the estimated net outflow (as recorded in the PLT data, with all their limitations) of New Zealand citizens was 845,520.

plt since 78

There is a lot of cyclical volatility, but in not a single year in that period has the flow of New Zealand citizens been back to New Zealand.  In fact, the last time the data record a net inflow of New Zealand citizens was the year I was born.  By international standards, it is a staggering loss of our own people (more than 20 per cent of the average total population over that period).  I can’t think of any other functioning democracy in the last 100 years that has had such a large percentage outflow of its own people.

These New Zealanders have presumably been making their own choices and assessments about the opportunites for themselves and their (actual or potential) children.  Not only have they chosen to have not quite enough children to maintain the population, but many of them (us) have also decided that the opportunities abroad are simply better than those here.  Not all of them will necessarily have made the right choice, but average we should presume that it was a rational choice.  These aren’t simply patterns based on a single year’s whim, a single year’s bad news.

So New Zealanders’ own choices, about their own lives, would have set in train a process that would see a gradually falling population in New Zealand.   Immigration policy, regarding the access of non-citizens, dramatically reversed that, and has in fact given us one of the fastest population growth rates in the advanced world over recent decades.  You have to wonder what insights, and wisdom, our politicians and officials are blessed with that leads them to run a policy operating directly to undermine the effect of the choices of individual New Zealanders.  Perhaps they might share that wisdom, that research, with us one day, before they further worsen the prospects of the New Zealanders who chose to stay living here.

Declining populations do create some issues, as fast-growing ones do.  Over history –  even modern New Zealand’s short history –  many places have grown, and then faded away.  On the whole, it might be better to live in place that had so many opportunities, it could maintain strong productivity growth and offer those gains to more people (at least if transport and housing messes could be sorted out).  But one doesn’t fix the fundamental economic challenges –  that lead people individually to take actions that mean New Zealand’s population wouldm’t be growing –  just by going to a bunch of poorer countries and telling their people they can come here, in large numbers, if they want.   But, as I say, perhaps our political leaders could share with us their apparently superior insights and research results, which back their decisions to place their own preferences above the considered choices of New Zealand individuals.


Two improbable outposts

Monday afternoon’s post was prompted by news of the New Zealand Initiative’s business leaders’ study tour to Switzerland.  Switzerland is materially better off than New Zealand, but as I illustrated over the last 45 years it is the only advanced country to have managed lower productivity growth than New Zealand.

The news of the Swiss trip reminded me of a story I’d seen a while ago, and had meant to write about, about another business study tour (involving at least some of the same people), to another laggard OECD economy, Israel.  Even the Prime Minister’s chief science adviser went along.  That trip was promoted by the Trans-Tasman Business Circle.   You can read about it here in a story written by a journalist who was invited along on the trip (or there is an Israeli perspective here).

Most people have heard of Israel’s high-tech sector, which was the focus of this New Zealand mission.   Somehow, there is an impression around in many circles –  I recall first encountering it at The Treasury –  that Israel is an economic success story.   Here are a couple of snippets from the Herald story

The mission will visit leading Israeli companies and institutions.

This includes Start-Up Nation Central, which connects companies and countries to the people and technologies in Israel that can solve their most pressing challenges.

Start-Up Nation Central was inspired by the 2009 best-selling book Start-Up Nation: The Story of Israel’s Economic Miracle, which explores the roots of Israeli innovation. The book continues to generate enormous demand from around the world for access to the people and technologies of Israel’s innovation ecosystem.

and

Why Israel? Moutter reckons while there are obvious differences, New Zealand shares many things with Israel. “We are both relatively young countries, with a culture and heritage of innovation, as well as some similarities in terms of market scale – from our perspective Israel is a more comparable point of reference for New Zealand than larger innovation ecosystems such as Silicon Valley or Shanghai. How has this small nation, less than 70 years old, with less natural resources than New Zealand, in one of the most volatile regions in the world, become widely known as the Start-Up Nation? I believe it will be invaluable for New Zealand to have greater insight into this journey.”

Sounds good. It is a shame about the hard data.

In the modern sense, both Israel and New Zealand are young countries.   And they are both somewhat improbable outposts.    New Zealand was the last major land mass settled by humans, and was so remote that until the 19th century all economic activity had to occur within these islands. Foreign trade wasn’t possible, or economic.   Technology changed that and for a time –  after the land was taken more or less by force and the indigenous culture displaced – an economy grew here that supported some of the highest material living standards in the world, for a pretty small number of people.  We remain physically remote, and that still seems to matter rather a lot.

As for Israel, the land itself has been close to where major civilisations grew and prospered long ago. Ancient Israel itself was, for a time, a rich kingdom.   But in the 19th century there wasn’t much high value economic activity there.   Through some mix of ideology, religious convictions, the horrors of Nazi Germany, and other later push and pull factors, a mass relocation of Jewish people has occurred.  In a land taken more or less by force, in the process something fairly remarkable has been built –  a relatively rich democratic society, in a region with little or no tradition of democracy and where modern prosperity has otherwise been achieved only in some of the countries with oil windfalls.  Physical distance isn’t such an issue for Israel.  It is surrounded by countries with hundreds of millions of people.    Unfortunately for Israel, many of the regimes of those countries (or popular movements those regimes suppress) would like nothing more than the destruction of the state of Israel.   Sixteen countries, apparently, ban altogether people on Israeli passports, and most of those countries are quite physically close.  So, mostly, economic and social ties aren’t close.  In an age when distance seems to matter rather a lot.

As I did with my Swiss post the other day, I’m going to start my comparisons from around 1970 where possible.  For us, it was just before Britain entered the EU and before the dislocations of the collapse in the terms of trade in the 1970s.  For Israel, it was 20 years after independence, when the country had achieved reasonable size (the population then was very similar to New Zealand’s, at just under three million), and it was few years after Israel’s greatest military success.

Unfortunately, not all of the Israeli data goes back that far (especially in the OECD databases).  As I showed the other day, in 1970 New Zealand’s labour productivity (real GDP per hour worked) was just a touch below that of the median OECD country (in company with the larger European countries).     I couldn’t find good comparable data for Israel for 1970 (whether for GDP per hour worked or real GDP per capita) but it looks as though Israel had outcomes pretty similar to New Zealand, perhaps just a little below.   On the earliest OECD data I could find, Israel’s real GDP per capita was around 5 per cent less than New Zealand’s in 1977, and the few years leading up to 1977 were bad ones for New Zealand.

The OECD has real GDP per hour worked data for Israel from 1981.   This chart shows how New Zealand and Israel have done relative to the median of the OECD countries for which there was 1970 data (ie mostly those who were really prosperous and democratic back then).

israel real gdp phw

Israel’s outcomes, at least on this score, look a lot like New Zealand’s.      New Zealand’s have been pretty poor.    The median real GDP per hour worked for that group of country (mostly the rich countries in 1970) is 42 per cent above New Zealand’s 2015 number.

From 1981 to 2015. the median OECD country achieved growth in real GDP per hour worked of 72.7 per cent.  That was around the sort of increase the US and the UK experienced.    But here are bottom five growth rate countries over that period

Growth (%) in real GDP phw 1981-2015 Level in 2015 (USD, converted at 2010 PPPs)
New Zealand 56.5 37.5
Netherlands 54.0 61.5
Israel 52.3 35.1
Italy 39.9 47.7
Switzerland  37.5 56.5

New Zealand wasn’t the worst, and neither was Israel.    But both New Zealand and Israel started out materially less productive than the Netherlands, Italy and Switzerland, and we still languish well down the field.   For all its problems, even Italy manages much higher average labour productivity than either Israel or New Zealand.

The picture doesn’t change much if, say, one starts the comparison from 1990 (after many of our reforms had been done).    We and Israel still managed labour productivity growth in the bottom quartile of OECD countries.

What about foreign trade?  It is now better realised that New Zealand’s export (and import) share of GDP has been going nowhere for quite some time.  By contrast, world trade as a share of GDP has been trending strongly upwards over the decades.  And while exports aren’t some panacea –  governments can always subsidise them and get more of them –  in successful highly productive economies, an increasing share of foreign trade (again imports as well as exports) is usually part of the mix.  In fact, I’m not aware of any country that has successfully closed the economic gaps to the leading economies, without export success playing a material part.

So here is a chart of exports as a share of GDP, for Israel, New Zealand and for the OECD as a whole, since 1971.

israel exports

Being small countries, you would expect both Israel and New Zealand to do more foreign trade than larger countries.  As the chart shows, both countries used to export a lot more (share of GDP) than did the OECD countries as a whole (in which, of course, the US is a large share).   That is no longer so, despite (in Israel’s case) that vaunted high-tech sector.  Firms in both countries  –  remote in their own ways –  find it more difficult to be a part of global value chains than, say, contiguous European countries (in something approaching a single market) do.  But whatever the full set of reasons, it isn’t an encouraging picture.

One factor, so I hypothesise, might be relatively rapid population growth.  As I noted, in 1970 Israel and New Zealand had similar populations.  Now Israel is getting on for double New Zealand’s population.

Using the United Nations population data, here is a chart of population growth since 1990.

israel popn

High-income countries in total have had population growth or around 16.5 per cent over that period.  New Zealand’s population has increased much faster than that (at around 35 per cent), and Israel’s population has increased much more rapidly still, up by around 79 per cent.

If there are lots of great new opportunities in a country, population growth needn’t impede productivity growth. In some cases, it might even help it.  Australia, for example, has also had rapid population growth, but seems to have had enough new opportunities (all those minerals) that its overall productivity and per capita income performance hasn’t been bad (although far from top tier).

What of New Zealand and Israel?  There don’t seem to have been many new high value opportunities in New Zealand –  in fact, in the article on the mission to Israel one thing that struck me was how many of the listed participants were from domestic-focused firms.   For Israel, one might have supposed it was different (all those high tech firms).

I’ve argued for some years, that rapid population growth can crowd out other business activities.  The basic logic is pretty simple.   New people –  whether born or migrant –  need new capital stock.  A modern economy requires rather a lot of (physical) capital per person (houses, roads, offices, schools, shops, machines etc) and real resources that have to be devoted to meeting the needs and demand of the new people, can’t be used for other purposes.  It is often those “other purposes” that seem to get squeezed out –  in particular, investment in the tradables sector.  People have to live somewhere, so that demand is often more inelastic (insensitive to changes in price) than is potential investment in support of new business opportunities

It needn’t happen.  A country with a fast-growing population could also have a higher than usual savings rate.   That would free up resources to meet both potential needs.  Over time, one might expect that.  And a country with a fast-growing population might also meet some of its needs by running a current account deficit (drawing on resources from the rest of the world).  But while you import a car, you can’t import non-tradables.  So current account deficits can help, but they don’t relieve all the pressure.

What do the summary data suggest? The IMF publishes data on the savings and investment rates for each advanced country back to 1980.  Over that period, both Israel (in particular) and New Zealand have had materially faster population growth than the median advanced country.   All else equal, that should have been reflected in a higher share of GDP having to be devoted to investment in both New Zealand and Israel than in the typical advanced economy.

But here are the data

israel I 
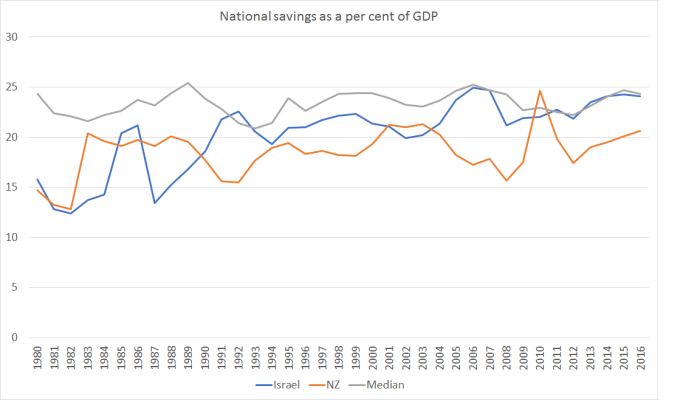
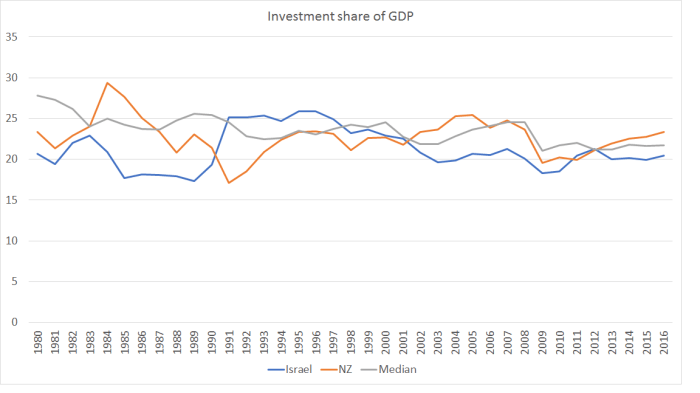
There is plenty of cyclical variation, but in both countries on average over this period, the share of investment spending in GDP has been a bit lower than advanced country median.     Given all the resources that needed to go to meeting the needs of the fast-growing populations (simply maintaining capital per person), there will have been materially less “left over” for capital deepening, or for new businesses and ideas.  It isn’t a mechanical rationing process, but just a response to the opportunities and the relative prices.

And here is the same comparison for national savings rates.

Israel savings

Again, despite the much more rapid population growth rates, both countries have had lower national savings rates than the median advanced country over this period.

I don’t know enough detail about Israel to be highly confident about quite what mix of factors is important in explaining its sustained underperformance (relative to other advanced, and key emerging, economies).  But the underperformance is pretty clear.  Israel’s productivity, like New Zealand’s, languishes towards the lower end of the OECD (and certainly of those OECD countries that were market economies a few decades ago).  Perhaps there are some specifics in the Israeli high-tech sector from which visitors can learn.   But if, to some extent, Israel’s sheer survival (so far) might be loosely termed a “miracle”, it isn’t clear that its economic performance is anything of the sort.   Very rapid population growth looks like it might have been part of the story (whatever it has done in terms of boosting the number of future IDF soldiers).

If NZ was like Switzerland…productivity growth might be even slower

Reading the Herald over lunch, I was interested to learn that the New Zealand Initiative is leading a study tour (of 40 chief executives and chairs) to Switzerland to see what we have to learn from them.  According to the Herald’s account,

At the heart of a one-week study tour organised by leading think tank the New Zealand Initiative is a quest to examine the role “localism” plays in the Swiss economic success story.

The online version of the story even had a graphic,

Switzerland

Many of those items seem quite attractive.   Nonetheless, when the story was framed around Switzerland’s economic success, I couldn’t help wondering if the Initiative’s members might not be heading to the wrong place.

Once upon a time, Switzerland had either the highest or second highest measured productivity (real GDP per hour worked) in the advanced world.  The Conference Board has estimates back to 1950 – when Switzerland was just behind Luxembourg.  But in this post, I’ll use OECD data, which goes back to 1970.

As recently as 1970, Switzerland still held that sort of rank (as it did for nominal GDP per hour worked –  in some ways a superior measure, but good timely estimates for the current situation aren’t available).    These are the OECD countries for which there is 1970 data.

switz 1970

We weren’t doing too badly either –  just slightly below the median for example, and in the middle of the big European countries (Spain, UK, France, Germany and Italy).

But here is the cumulative growth in this measure of labour productivity for the full period 1970 to 2015.

switz 70 to 15

Beaten even by New Zealand.  It is a pretty woeful Swiss productivity performance.    Even over the last 25 years when both countries have done a little better relatively (we beat six of the OECD countries), Switzerland still came in behind New Zealand.        Over the decades, they don’t even have the excuse of agricultural protectionism, or being remote in an age when personal connections have become more important.

And what about the present?  Here are the levels of real GDP per hour worked in 2015, for the now much larger OECD.

switz 2015

Switzerland is, of course, still a productive and prosperous economy.  But over the last 45 years, it has slipped a long way down the league tables.    As for us, of the countries on the first chart who had lower productivity than New Zealand in 1970, only Turkey, Portugal and Korea still do.    (I hadn’t really noticed previously that if they don’t shoot themselves in the foot, even Turkey will soon go past us if these numbers are to be believed.)

I’m sure there are many good things about Switzerland.  It is a much richer, and in many ways more successful, country than New Zealand.  But I’m not sure I’d be looking to them, or their governance models (fascinating as they are in many respects), for lessons on what New Zealand should do to lift its relative economic and productivity performance.

The IMF opines on the economy

The International Monetary Fund (IMF) was out yesterday with two major reports on New Zealand.    One was the Financial System Stability Assessment, the conclusion of the quite infrequent (the last one for New Zealand was in 2004) FSAP programme of reviews of the regulation of countries’ financial systems.  I haven’t read that document yet, but from media accounts there are some recommendation I’d agree with (eg deposit insurance, as second-best) and a great deal (mostly derived from the “nanny knows best” starting point) that I’ll have more problems with.

But this post is about the Article IV report –  the (typically) annual review and assessment of a member country’s macro economy.

Once upon a time, these reports were simply confidential advice to the government.  These days, at least for countries like ours, it is all out in the open.  And, partly in consequence, there often isn’t that much to see.  The IMF might be a prestigious organisation full of rather highly-paid economists, but it is striking how weak their surveillance reports often are.   Perhaps there just isn’t a gap in the market that can usefully be filled by a handful of Washington-based economists looking at our economy for a couple of months a year.

The challenge is compounded by the fact that no one much cares about New Zealand.  We are small, in an age when the IMF is heavily-focused on systemic risk, global spillovers etc.    We aren’t in Europe –  still over-represented at the Fund –  or from one of those Asian countries where governments are hyper-sensitive about anything the Fund says.    It is decades since we had an IMF (borrowing) programme ourselves.  And, whether this is cause or effect I’m not sure, but for decades no one here has paid much attention to the Fund.  As an example, our capital city newspaper this morning has some coverage of the FSSA, but really nothing at all about the Article IV report.  If a tree falls in the forest, and no one is around to hear it, does it make a sound?    (By contrast, when I was at the Board of the IMF, my Australian boss was very exercised about each year’s Australian Article IV report.  He’d get phone calls direct from the Treasurer about it, and the serious Australian media gave the reports a lot of coverage.)

Oh, and of course, the other challenge for those reviewing New Zealand is the features that stand out, and which haven’t readily and convincingly been explained.  Thus, we have a lot of reasonably good micro policies, we have pretty good government finances, a floating exchange rate, low and stable inflation, sound banks, high levels of transparency, and low levels of corruption.     And yet……having once been among the very highest income countries in the world, we now languish.  International agencies find Venezuela’s decline easy to explain.  New Zealand’s not so much.

But with all the resources at their command, including the benefit of being an organisation with data and perspectives on all the countries in the world, none of it really excuses the mediocre quality of what gets dished up each year.  Or the inconsistency from one year to the next.   Last year, for example, we were told that raising national savings rates was “critical” –  and it was reported that the NZ authorities agreed –  but this year there is barely even any mention of the issue.

This year we are served up some mix of regurgitated PR spin about how well New Zealand is doing, and when it comes to policy suggestions we get a grab-bag of bits of conventional wisdom, or favoured centre-left policy positions, without any discernible sign that the authors (or their reviewers in Washington, or the Fund’s Board) had any sort of robust framework (or ‘model’) for thinking about the New Zealand economy.

It isn’t easy to excerpt a fairly lengthy report, and often it is the omissions that are more striking than what is in the report itself.      Thus, the release opens with this

Since early 2011, New Zealand has enjoyed an economic expansion that has gained further broad-based momentum in 2016, with GDP growth accelerating to 4 percent, and the output gap roughly closing. Reconstruction spending after the 2011 Canterbury earthquake was an important catalyst, but the expansion has also been supported by accommodative monetary policy, a net migration wave, improving services exports, and strong terms of trade.

On its face, that all sounds quite good.  But countries don’t get rich by rebuilding themselves after disasters –  that reconstruction process mostly displaces resources from other, typically more productive and prosperous uses.   They don’t get rich through monetary policy either, valuable a role as it has in short-term stabilisation.  And although services exports grew quite strongly for a while (a) little or none of it was high value products (lots of tourism, and students pursuing immigration access at PTEs), and (b) in a world in which services exports are becoming steadily more important (as illustrated in eg this recent IMF working paper), for New Zealand services exports as a share of GDP are materially lower than they were 15 years ago.

In fact, you could read the entire Article IV report and not find any mention of the fact that, with total population growing at around 2 per cent annum and working age population growing at around 2.7 per cent annum, per capita income growth in the last few years has been pretty unimpressive.  And you’d find no mention –  explicit or by allusion – to the almost five years that have now passed since we saw any labour productivity growth in New Zealand.   I guess that would have undermined the relentless good news story the Fund staff seemed determined to tell.

Perhaps more surprising is the treatment of the external sector of the economy, typically a subject of considerable interest to the IMF.  Readers of the Article IV report in isolation would have no idea that exports (and imports) as a share of GDP have been falling –  not just this year, but for some time on average.  Nor would they appreciate that per capita real GDP of the tradables sector has shown no growth at all for more than 15 years.     The report does note that an overvalued real exchange rate is probably an obstacle to faster growth in the tradables sector, but again there is no hint of any sort of integrated understanding of what is going on with the real exchange rate, and what might make some difference in future.

The complacency, and weak analysis, carries over to the labour market.

The unemployment rate fluctuated around the natural rate of unemployment of 5 percent in 2016

But there is not a shred of analysis presented to suggest that the NAIRU for New Zealand is now anywhere near as high as 5 per cent.  It would be very surprising if it were that high, whether in view of continuing very weak wage inflation, the history of the last cycle (in which unemployment got to 5 per cent fairly early in the recovery), and changing demographics which are appearing to lower the NAIRU.  Oh, and not forgetting that our Treasury has published its own estimate of the NAIRU, at something close to 4 per cent.

The Fund isn’t really much better on the housing market.   They are all very interested in the various tweaky tools the government and its agencies have applied in the last couple of years (LVR limits, tax changes etc) and – contrary to many of the pro-immigration people in New Zealand –  they are at least quite clear that rapid increases in population are contributing directly to high house price inflation.    But there is no simple and straightforward observation that, at heart, the house price issue is a matter of regulatory failure, and that the current government (like its predecessors) has done little or nothing to fix the problems. Instead, we get banalities along these lines

Tighter macroprudential policies, higher interest rates, lower rates of net
migration, and increasing housing supply should help moderate house price inflation and stabilize household debt vulnerabilities in the medium term.

If you don’t change the fundamental structural distortions that gave rise to the problem in the first place, it is a little hard to take seriously the idea that things will come right even “in the medium term”.  You would not know, reading this report, that almost nothing substantive has been done to free up the market in urban land.    An organisation with the benefit of cross-country perspectives and databases might usefully have pointed out that this is an obstacle not just in New Zealand but in Australia, the UK, much of the east and west coasts of the US, and other places besides.  The silence might suit the current government, but it also makes the Fund complicit in the failure.  The Fund’s Board considered the material in the Article IV report on housing. They observed, in conclusion, that

Recognizing the steps being taken by the authorities to address the demand-supply imbalance in housing markets, Directors generally highlighted that further tax measures related to housing could be considered to reduce incentives for leveraged real estate investments by households. Such measures could help redirect savings to other, potentially more productive, investments and, thereby, support deeper capital markets.

Except that very little has actually been done on the supply side, and not much has been done to change the medium-term “demand-supply imbalances”.      Perhaps there is a place for tax changes (I’m sceptical, including that any changes would make much difference –  where else have they?) but the Board didn’t even seem to recognise that inconsistency in their own advice.  Do we have too many houses in New Zealand or too few?  Most people, rightly, would say “too few”  (a good indicator of that is the ridiculously high prices).    And yet the Fund Board thinks that a greater share of investment should go into other things, and a smaller share into housing?????   (As it happens, I agree with that, but only on the basis that we have much slower population growth, something there is no hint of in this report).

Buried deep in the report, is a recognition of some of the longer-term challenges facing New Zealand.

New Zealand’s structural policy settings are close to or mark best practice among
OECD economies, but persistent per capita income and productivity gaps remain. Income is lower than predicted by these policy settings, by an estimated 20 percent. Growth in labor productivity has declined, with multifactor productivity growth slowing from the early 2000s, and capital intensity has stagnated recently.

One could question even those details.  I wrote a bit about our structural policies a few weeks ago, as illustrated by the OECD’s Going for Growth publication.  There are plenty of areas in which we are well away from best practice, and overall at best you could probably say that our structural policies aren’t bad by OECD standards.  But there is no doubt that productivity levels are far lower than most would have expected based on those policies.

What does the IMF propose in response?   They reckon remoteness is a problem and for some reason, despite that, still seem very keen on lots of immigration.  But here is the rest of their list:

  • Targeting housing supply bottlenecks more broadly would safeguard the
    attractiveness for high-skilled immigration and business.
  • More central government property taxes, the proceeds of which would be distributed to local authorities.
  • Trade liberalization could help to strengthen competition and productivity, including in the services sectors.
  • Tax incentives for private R&D spending
  • As discussed during the last Article IV mission, there is also scope for tax reform to raise incentives for private saving and discourage real estate investment as a saving vehicle

And that is it.

I’d certainly support fixing up the land supply market and foreign trade liberalisation.  I’m a lot more sceptical of the other items.  And what about, for example, our high compayn tax rates?  But my real challenge to them is twofold:

  • first, where is the model or framework that explains how the absence of these policies is at the heart of New Zealand’s disappointing long-term economic performance (because it feels more like a grab bag of ideas they picked from one person or another), and
  • second, how large a difference do they really believe these measures, even if they were all implemented flawlessly, would make?     Without much more supporting analysis, they have the feel of playing at the margins, as if they felt obliged to offer up some suggestions, any suggestions.

A year ago, the Fund seemed quite taken with the idea that the persistent gap between our interest rates and those abroad was an important issue (they even cited approving my own paper on this issue), but that flavour seems to have disappeared this year.  And when they allude briefly to our high interest rates it is to fall back on the discredited risk premium hypothesis.

Of course, the government is just as much at sea.   The NZ authorities get to include some responses in the Article IV report.  In this section, they begin thus

The government’s ongoing Business Growth Agenda (BGA) aims to help overcome the disadvantages of distance and small market size, in particular by deepening international connections, with a focus on increasing the share of exports in GDP to 40 percent by 2025, and diversifying the export base.

Just a shame that, if anything, things have been going backwards on that count, and show no signs still of progress.

And, finally, from the final paragraph of the Executive Board’s assessment

Directors agreed that measures to lift potential growth should focus on leveraging the benefits from high net migration and interconnectedness.

But there is nothing in the report to show what these benefits might be (recall that the focus here is on potential growth, not the short-run demand effects), let alone what “leveraging the benefits” might involve (generally, I thought the IMF was uneasy about leverage).   I guess it is just an article of faith.

It is pretty depressing all round.  Supposed international experts fall for the spin, and can offer nothing very profound on even the longer-term challenges.  Our own government agencies seem to be at sea, or just happy to go along.   Our representative on the Board of the IMF  – no longer a public servant, but now the (able) former chief (political) policy adviser to John Key – was happy to go along.  In his statement to the Board, published as part of the package of papers, he observed

As staff observe, New Zealand’s structural policy settings are close to, or mark, best practice. Lifting productivity, in the face of New Zealand’s small size and isolation, therefore requires incremental reforms across a broad range of areas. Recognizing this, the Government has established the Business Growth Agenda as an ongoing program of work to build a more productive and competitive economy,

When various major OECD countries have productivity levels 60 per cent above ours, who are they trying to fool in pretending that we have policy broadly right, and just need to keep tinkering (“incremental reform”) at the margin?

As part of the package of material released with the Article IV report, there is an interesting empirical annex on immigration.  It isn’t well-integrated with the report itself, and I will cover it in a separate post.  The annex probably should have had some publicity in the local media, given the salience of the issue in New Zealand debate at present.

The sort of productivity growth we once achieved

Over the weekend I was (as you do) dipping into the 1968 edition of the New Zealand Official Yearbook, in pursuit of some material I might write about later in the week.

As I flicked through the pages, I stumbled on a table showing labour productivity for the previous 12 years.  It wasn’t an ideal measure.  There wasn’t a good series of hours worked nationwide in those days, so this series was a measure of real GDP per person employed.  But what really caught my eye was the numbers.  Over only 12 years, labour productivity was estimated to have increased by 28.9 per cent.  And this was in an era when experts, and official agencies, were starting to worry about New Zealand’s productivity growth, and to produce data showing that we were beginning to fall behind other advanced economies.

Here is the chart showing both the old data (for 1954/55 to 1967/68) and the same measure (real GDP per person employed) for the 12 years from 2004 to 2016.  For the more recent period I have (a) used an average of the production and expenditure GDP measures, and (b) adjusted for a lift in measured employment of around 2 per cent in June last year, solely because of the change in the HLFS itself.

real gdp per person employed

Over 12 years, they managed 28.9 per cent productivity growth in the 50s and 60s (with a fairly inward looking economy, with high levels of trade protection), and in our generation  in the same period we’ve seen only about 7.9 per cent growth.

Of course, much of the slowdown is a common phenomenon seen across the advanced world, so this isn’t intended mainly as a stick with which to beat New Zealand governments specifically.    But is a sobering reflection on how little material progress we, and other countries, are now making, relative to the astonishing progress seen in those post-war decades.

And, of course, we do have better data now.   A rising share of part-time workers tends to dampen GDP per person employed.  Here is real GDP per hour worked for the same modern period – ie 2004 to 2016.

real gdp per hour worked 04 to 16

Overall growth has been a bit stronger (12.1 per cent in total) on this better measure.  But this measure also puts the New Zealand specific problems into sharper relief.  We’ve had no productivity growth at all, on this measure, for four or five years.  And that isn’t a global phenomenon, just a New Zealand one.

Could we manage 28.9 per cent productivity growth over 12 years again?  It is only an average annual growth rate of a touch over 2 per cent, and the gaps now between New Zealand average productivity and that in the leading OECD economies are so large (they are more than 60 per cent higher than us) that it really should be achievable.   But it would probably require, as a first step, giving up the rhetoric suggesting that really everything is just fine in New Zealand, and starting to focus on measures that might make a real difference.


A government that simply makes things up

Perhaps all governments these days eventually do it, but one of the things that I’ve come to dislike most about our current government is the way they and their acolytes simply make stuff up.    I could, I suppose, understand them not actually doing anything much.  After all, they didn’t promise to do anything much.

But the endless spin, and stuff that is just made up, sickens me.  Apart from anything else, I try to bring up my kids heeding the biblical injunction to honour those in authority over us.  I don’t read that as suggesting people won’t disagree with those who hold office, but there is something quite sick about the political process –  and perhaps about a society that tolerates this stuff –  when so often one reads comments from senior ministers or the Prime Minister to which one can only  explain to kids interested in such things that “they are just making it up”.    We should expect much better than that.

I’ve written before about the current and former Prime Ministers’ dismissal of housing or conjestion problems as “quality problems” or “signs of success“.  And there are the repeated claims that New Zealand’s economy is doing better than almost any other advanced country –  a suggestion ably challenged in an article by journalist Graham Adams yesterday.   But today, since it is the day Murray McCully leaves ministerial office after a very long period in ministerial roles in two governments. I wanted to focus on an unfounded claim in a recent speech to the New Zealand Institute of International Affairs by the outgoing Minister of Foreign Affairs.

He begins with an unexceptionable observation

The key feature of the past decade has been the rise of China, in terms of both our bi-lateral relationship, and as a regional and global power.

Not just of the past decade, but the past several decades.

And, as the Minister notes, there has been a big growth in bilateral trade (goods and services).

In my eight and a half years in this role I have seen our exports to China increase from around $2 billion to nearly $10 billion, and visitor numbers more than quadruple from under 100,000 to over 400,000.

But then he dramatically over-reaches

Had it not been for the dramatic expansion of trade and economic relations with China in the early years of the Key Government, New Zealand would have suffered a long and sustained recession, and all of the associated social challenges that we have seen in some European nations.

There is simply no support for this proposition anywhere in the rest of the speech.

The implication, of course, is that New Zealand has done well over the term of this government.  But here is a chart of real GDP per capita for New Zealand and the United States, both normalised to 100 in the December quarter of 2007, just prior to the recession.

real GDP pc NZ and US

The United States, you will recall, was the epicentre of the financial crisis, and had a very nasty fall in house prices.  The United States cut interest rates as far as they then thought they could go.

New Zealand, by contrast, had a relatively modest home-grown financial crisis (localised in the non-systemic finance companies), never reached the limits of conventional monetary policy, and had a much stronger fiscal position going into the recession than the US (or most other advanced countries had).  Oh, and we the big bonus of a sharp fall in interest rates, as a country that had borrowed heavily from the rest of the world.

And yet look at the chart.  The initial recession was certainly a little deeper in the US than it was here –  but China wasn’t a significant influence on what was happening here in 2008/09.  But then we had a double-dip recession in 2010.

For a couple of years it looked as though we might be doing a bit better than the US, at least on this metric, but even that optimistic possibility has now faded away.  Over the nine years shown, real GDP per capita has grown almost exactly as slowly in New Zealand as it has in the United States (average growth rates of barely 0.5 per cent per annum).   You’d have to know economic data pretty well to be able to tell apart the US and New Zealand lines for the last six years or so.

So we had a pretty nasty recession, which we took years to recover from.  On some metrics – eg the unemployment rate –  we still haven’t.  And all that even though China took up a larger share of our exports.  It is so even though in those “early years of the Key government”, China was a big source of demand driving activity in our biggest trade and investment partner, Australia.

The Minister seemed to be telling a trade and exports story –  certainly those are the numbers he quoted.    But here are exports as a share of GDP for the two countries, again back to December 2007.

exports to GDP US and NZ

In both countries, exports took a hit during the recession – in the US’s case it was mostly volumes, while it our case much of it was prices (the fall in export prices).   But, despite all that additional trade between New Zealand and China, our export share of GDP has fallen quite a bit over the last few years, while that in the US (always much lower, given that the US is a large country) has held remarkably steady.

Perhaps this fawning “China our saviour” line went over well when the Premier of China was visiting recently, but it really doesn’t amount to much at all.  The country composition of our exports has changed –  and for a couple of years perhaps high prices out of China for milk powder lifted farmer incomes –  but as a share of the overall income, exports have been shrinking.  We produce stuff (mostly bulk commodities), and someone buys it.  In recent years, China has been a more important buyer –  although Australia remains our largest export market –  and the free trade market with China is likely to have been helpful, but it has hardly transformed our economic fortunes.

There are other differences between the US and New Zealand experiences.  The US unemployment rate went up much more than ours did during the recession, but then came down much more sharply and is now a bit lower than ours.

U rates in floaters

But one striking difference over the last few years is in the estimated population growth rates.

population US and NZ

Overall, ours is a story of little or no productivity growth (none for the last five years), of an economy that –  going by the headline statistics –  seems increasingly inward focused, reliant on population-fuelled (and earthquake rebuild fuelled) domestic demand.   And it is a pretty poor performance all round.

There are, of course, worse places among the advanced countries, and if that is all the Minister had wanted to say, no one could disagree.  But instead he over-reached, suggesting that somehow we’d done well.  We haven’t.  And mostly that is down to our own choices –  or, more specifically, those of the government in which Mr McCully has been a senior minister.