R&D tax credits: more ill-considered corporate welfare

In the minds of members of our new government, much of whatever hope they have of transforming New Zealand’s economic performance (productivity, foreign trade and so on) seems to rest on the proposed R&D tax credit.

Don’t just take my word for that.  Yesterday, they released a discussion document on details of the new tax credit, which is scheduled to take effect next year.  The document is headed Fuelling Innovation to Transform our Economy” .  In the Foreword, ministers gush

This Government’s vision is to build a better New Zealand for all our people and we see an incredible opportunity ahead of us to do this.

That means a country with affordable, healthy homes; an environment we can be proud to leave to future generations; and a diverse, sustainable, and productive economy that delivers for our people.

This vision can’t be delivered with the same old approaches. We need new ideas, new innovations, and new ways of looking at the world.

And that is where science, innovation and research can play an important role. That is where we see our innovators, our scientists, our entrepreneurs and our visionaries building a better New Zealand.

In the view of the government, businesses don’t spend enough on research and development.  They need to spend more.   Knowing better than businesses apparently, the government is to fling another subsidy into the mix.  My mind is carried back to bad old days of export incentives, and other patchwork attempts to avoid addressing the real issues (in those days, heavy import protection and a (typically) overvalued real exchange rate).

As far as I can see, the only thing released yesterday was the discussion document.  There was no officials’ advice on the economics of the proposal, no Cabinet paper, no regulatory impact statement. Not really anything at all, other than few assertions and then straight to the details of the proposed scheme –  the only bit they seem actually interested in consulting on.  Not once –  in yesterday’s document, or in anything else the government has published –  have I seen any considered analysis of why profit-maximising firms might have not regarded it as worthwhile to do more R&D spending here.   If you don’t understand that, it is unlikely that any proposed remedy is a serious well-structured response.  Much seems to rest on the fact that most –  but by no means all – OECD countries also offer these subsidies.

There is quite a reasonable argument to suggest that research and development spending is already rather favourably treated by the tax system.   Purchase a physical asset as part of your firm’s production, and you can only deduct it against taxable income through depreciation, over the expected economic life of the asset.  But research and development spending is really just another form of investment –  it is even in the national accounts (GDP numbers) as such.  But most of that spending is immediately deductible for tax purposes.   The R&D spending that Boeing did to come up with the 747 generated sales and profits over decades, but instead of that spending being offset against those profits in the  years they were earned, it would all have been deductible up-front.  The time-value of that favourable treatment is considerable (huge when the R&D leads to a product with a long period in the market).  And since New Zealand has now one of the higher company tax rates in the OECD, the value of that standard ability to deduct is already larger here than in many other OECD countries (and before people start invoking our imputation scheme, it is the company tax rate that matters for foreign investors and in the document the government says “We also want to attract large
international R&D intensive firms to New Zealand”).

In the discussion document there is a full page graphic highlighting gross R&D spends in a variety of advanced countries.  For some reason, even though the R&D credit is aimed at businesses, they don’t quote business R&D expenditure, so in this table I’ve added that column as well, using data from the OECD.

Total R&D Business R&D
% of GDP
United States 2.8 2
United Kingdom 2.9 1.1
Canada 1.7 0.9
Ireland 1.5 1.1
Finland 2.9 1.9
Denmark 3 1.9
Israel 4.3 3.6
Switzerland 3.4 2.4
Australia 2.8 1.2
New Zealand 1.3 0.6

Which is interesting, but it is perhaps worth pointing out that of those countries, Finland, Denmark, and Switzerland (as well as New Zealand) don’t have R&D tax credits.  As I’ve pointed out in other posts Germany doesn’t either –  and business expenditure of R&D there is about 2 per cent of GDP.    On OECD estimates, the value of the US tax credit is also very small.

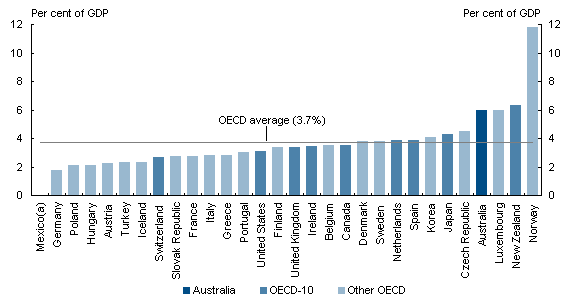
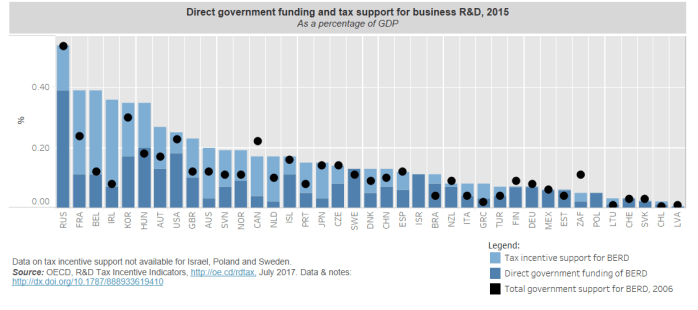
R&D tax credits aren’t the only form of government spending to subsidise business R&D – in fact, the government’s new scheme involves doing away with the current grants.   And as it happens, OECD numbers suggests we already spend more (per cent of GDP) on such subsidies than Germany (DEU), and quite a lot more than Switzerland (CHE).

Direct government funding and tax support for business R&D, 2015

All of which might suggest taking a few steps back and thinking harder about why firms themselves don’t see it as worth undertaking very much R&D spending here.  But given a choice between hard-headed sceptical analysis and being seen to “do something”, all too often it is the latter that seems to win out.

In an earlier post, I pointed out

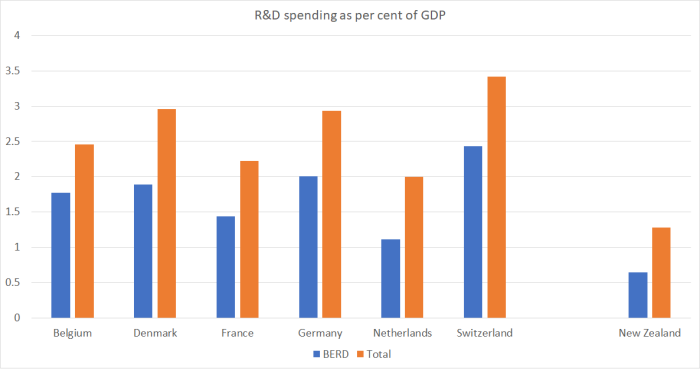
Formal research work done previously suggests that the rate of business R&D spending in New Zealand partly reflects the sort of stuff we produce.  One way to see that is to look the OECD’s commodity exporting countries, and compare them with seven economies at the heart of advanced Europe.  These are simply different types of economies.

BERD (% of GDP) BERD ( % of GDP)
Australia 1.23 Austria  2.03
Canada 0.93 Belgium  1.58
Chile 0.14 France  1.44
Mexico 0.17 Germany  1.96
New Zealand 0.57 Netherlands   1.10
Norway 0.87 Switzerland   2.05
Denmark   2.oo
Median 0.72 Median 1.96

In passing, it is also perhaps worth highlighting Israel –  an economy with very high business spending on R&D, and yet not only an economy with GDP per capita around that of New Zealand, but with a similarly poor longer-term productivity record.  They make and sell different stuff –  some of which clearly needs lots of R&D –  but not, overall, any more successfully than we do.

A reasonable counter to this sort of line of argument might be “ah yes, but we want to be Denmark –  after all, in some sense they once were New Zealand (agricultural exporter etc)”.     But if the opportunities are really here for such a transformation, has the government and its advisers stopped to think about why firms don’t seem to see investing in more R&D as offering a worthwhile expected return?  Danish firms didn’t seem to need an R&D tax credit to get there.

Personally, the 2025 Taskforce’s approach to the issue seems more persausive

The 2025 Taskforce addressed some of these issues in their 2009 Report (around p 70).  They argued that more attention should be given to the possibility that high levels of business R&D spending might reflect more about where particularly economies are at (near the frontier or not, differences in product mix) rather than being some independent factor explaining the success or failure of nations.  In their view, a highly successful New Zealand was likely to be one in which more business research and development spending was taking place, but as a consequence of that transformation rather than an independent cause of it.  That still seems like a pretty plausible story to me –  although New Zealand is long likely to be primarily an exporter of commodities, and richer commodity exporters (Norway, Australia and Canada) don’t have particularly high levels of business R&D spending.

And part of the transformation in New Zealand seems almost certain to involve a much lower real exchange rate for a prolonged period.  It was an important message in the 1980s –  when officials actually took it seriously –  and remains no less important today, even if ministers and officials now seem to ignore the issue.

I don’t want to spend time on the detailed issues of the design of the new tax credit.   But I did notice this

A business will need to spend a minimum of $100,000 on eligible expenditure,
within one year, to qualify for the Tax Incentive. The rationale for setting the threshold at $100,000 of eligible expenditure is to filter out claims that are not likely to be genuine R&D. $100,000 of expenditure is roughly the cost of one full time employee’s salary and related overhead costs.

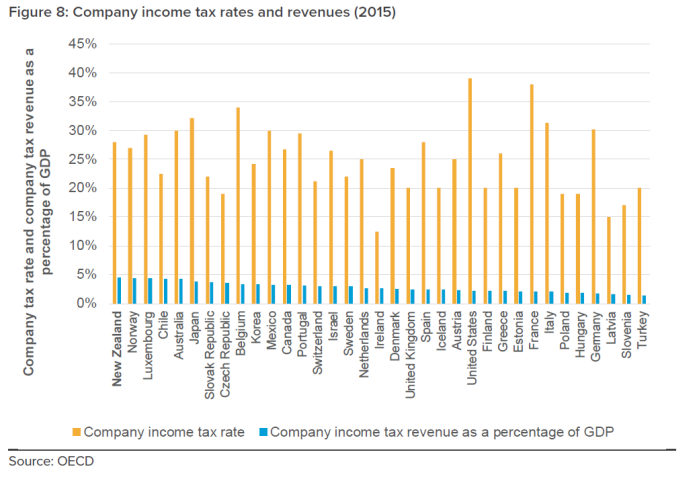
It isn’t clear why small claims should be less likely to be all genuine R&D than large ones. But then juxtapose the planned threshold with this chart

BERD by firms NZ

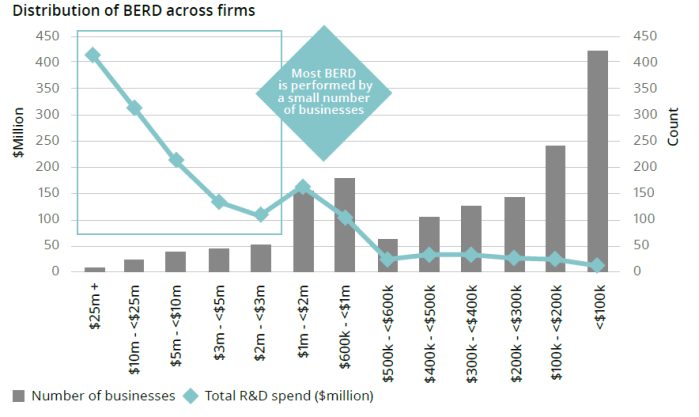
In other words, a large proportion of the companies doing R&D won’t be eligible for the new subsidy at all, while the “big end of town” can gobble up generous subsidies from the taxpayer.  It is corporate welfare, deliberately skewed to the bigger firms.

An interesting feature of the proposed new tax credit is that there is no attempt to structure it to incentivise increased levels of R&D spend.  The tax credit will apply to the first dollar of R&D expenditure (for firms above the $100000 threshold) –   much of it spending the firm would have done anyway.  No doubt there are arguments for such an arrangement in practicality and minimising compliance costs.  But it also means that the returns to whatever additional R&D spend might take place as a result of the tax credit will have to be very high, to cover the cost of the whole programme.  And yet there is no attempt at any sort of cost-benefit analysis (actually not even an estimate of the fiscal cost) in the discussion document –  or even a hint that one has been done elsewhere.  It is as if the government believes that any increase in recorded deductible gross R&D spending will offer gains in material living standards for New Zealanders.   Perhaps, but it would be nice to see the case rigorously made, and the detailed assumptions exposed to scrutiny.

A visiting Australian politician

A fairly prominent Australian politician was in town last week.   Andrew Leigh was previously a professor of economics at ANU, and for the last eight years has been a Federal Labor MP.  He is the Shadow Assistant Treasurer, Shadow Minister for Competition and Productivity (and spokesman on various other minor portfolios), and so presumably fairly likely to become a Federal government minister if the next election result follows the polls and Labor is elected.

Leigh was here to give a couple of lectures in the series being sponsored by the NGO Presbyterian Support Northern on topics related to child poverty and wellbeing.  As it happens, next month I’m also giving one of the lectures in this series –  on the role productivity growth plays in ending poverty – and if anyone is interested you can book  one of the (free) sessions here   (there is one in Auckland and one in Wellington).

I didn’t get to hear Andrew Leigh while he was here, but both his Auckland text  and his Wellington text are available on line.   The substance of both addresses is well worth reading –  he is a widely-published researcher on inequality (the Auckland address) and has just published a book about the use of randomised control trials as a tool in better evaluating which policy interventions might work and which don’t (the focus of the Wellington address).   I don’t claim to be a fan of the Australian Labor Party, but politics is likely to be better for having at least a few people, preferably on both sides of politics, able to address serious issues this seriously.

Having said that, I was mildly amused by the introduction to his Wellington speech.   I guess it is standard advice to butter up, and flatter just a bit, your audience.

New Zealand has turned out to be a pretty good predictor of what’s likely to happen next in Australia.

New Zealand women won the right to vote nine years earlier than Australian women.

Your country enacted same sex marriage four years before we did.

You even gave Barnaby Joyce citizenship before we did.

So to be in New Zealand isn’t just a chance to see the sun rise a couple of hours earlier – it’s also an opportunity to get a sneak peak into some of the things that might shape Australia’s future.

And I have to say that as a member of the Labor opposition in Australia, I’m keenly hoping that this year or next will see Australia’s voters follow your lead in electing a progressive government.

I’m pretty sure that, even if it got a good laugh, he is wrong about Barnaby Joyce –  a citizen by birth of both countries, and there was only a single birth.

But no mention at all –  none, as far as I could see across two speeches –  of the most striking area of New Zealand/Australia comparisons where Leigh must surely hope that New Zealand doesn’t offer a “sneak peak” into Australia’s future.  And that is the, not trivial, matter of relative productivity and prosperity.

As I noted yesterday, for 100 years or so (from the time of our gold rushes onward) New Zealand and Australia are estimated to have had average real per capita incomes that were much the same.   Each country had specific idiosyncratic events and influences, so that at times we did better, and then for a time they did better.  Those differences were reflected in the trans-Tasman migration data –  at times the (significant) net flow was one way, and at times the other way.

The standard collection of such data is that by former OECD researcher Angus Maddison  Here is the chart of the data he judged best (no doubt far from ideal in both cases), starting from 1870 when he first reports annual numbers for New Zealand.  (Maddison died a few years ago so the data aren’t updated to the present.)

aus vs nz real gdp pc

The red line is the average of the series for the full period 1870 to 1970: on average, on these measures, New Zealand had very very slightly higher average incomes than Australia.  On different measures you might get a slightly different picture, but the overall story won’t change much.  The performance of our two economies was pretty similar.  But it is no longer.   The IMF’s current estimate is that New Zealand real GDP per capita, converted at purchasing power parity exchange rates, is about 76 per cent of that of Australia.

We don’t have a time series of productivity data for the historical period, and although Australia has an official series of real GDP per hour worked back to 1959, here official data can only take us back to the late 1980s.    In this chart, I’ve shown the relative performance of labour productivity (real GDP per hour worked) in the two countries since 1989 (for New Zealand, using the average of production and expenditure GDP measures, and the average of the QES and HLFS hours series, as in earlier posts).

real GDp per hour aus vs nz

In 29 years, we’ve lost a lot more ground –  15 percentage points-  relative to Australia.  It isn’t a particularly steady process (at least as represented in these data) but the trend decline shows no sign of ending, let alone reversing.

And thus when, as in one of his speeches, Andrew Leigh notes that

It is not as though the child poverty rate is noticeably different in our two countries. According to the OECD, the child poverty rate – measured as the share of children living in households with disposable incomes of less than half the median – is 13 percent in Australia and 14 percent in New Zealand.

what he is omitting is that incomes in Australia are a lot higher, and thus so too is the relative poverty line measure he is using.  Australia’s poor should be less badly off than our poor, because Australia’s relative economic performance is so much better.

For Australia’s sake, I hope New Zealand’s path doesn’t foreshadow their own.  Then again, in some respects it already has.    On the Maddison numbers, back in 1870 both New Zealand and Australia were more prosperous than the United States.  As recently as 1938, we were about equal with the US.  And now, we do particularly poorly, but Australia’s relative performance is nothing to write home about.

rel to US

Interestingly, Leigh touches on one possible aspect of the story.

Third is to recognise the role that foreign investment plays in sustaining employment. As you know, the antipodes enjoyed among the highest wages in the world at the end of the nineteenth century. One reason for this was the high amount of land per person. While Europeans lived cheek-by-jowl, there was plenty of room to swing a sheep in Australia and New Zealand. In economic terms, one reason that wages were high was that the capital to labour ratio was high.

Today, both Australia and New Zealand have strong immigration programs. Migrants can fill skill gaps and start businesses, boost innovation and encourage exports. But they also have the inevitable impact of lowering the capital to labour ratio. To the extent that migrants are adding to the number of workers available to do a given job, this may put downward pressure on wages.

It was former Treasury Secretary Ken Henry who pointed out to me that foreign investment has the opposite effect. By increasing the available capital, it pushes up the capital to labour ratio. So by accepting foreign investment as well as migrants, a country can keep its capital to labour ratio constant, and therefore its wage rates.

I think that is partly true and partly not.  As he notes, in the 19th century what marked out both countries was abundant land – which in turn attracted both migrants and foreign investment.  These days, foreign direct investment can help improve prospects –  and I’m strongly supportive of us being open to FDI –  but FDI doesn’t add to the stock of land and natural resources (even if it can help exploit those resources more fully), and even when regulatory restrictions are out of the way, it flows in the direction of opportunity.  Neither country has been particularly successful in seeing internationally competitive industries not based on our natural resources develop.  Attractive opportunities in either location don’t seem thick on the ground,

It is, nonetheless, good to see a left-wing politician openly addressing these issues.  Would that it were happening here.

Leigh’s other speech was devoted to the merits of randomised trials of proposed or actual policy interventions or welfare programmes.  In many areas, they are the single best way of identifying what works and what doesn’t.  Here are a couple of examples from his text (in this case, of programmes that proved not to work).

In some cases, the Education Endowment Foundation trialled programs that sounded promising, but failed to deliver. The Chatterbooks program was created for chil­dren who were falling behind in English. Hosted by libraries on a Saturday morning and led by trained reading instructors the program gave primary school students a chance to read and discuss a new chil­dren’s book. Chatterbooks is the kind of program that warms the cockles of your heart. Alas, a randomised trial found that it produced zero improvement in reading abilities.

Another Education Endowment Foundation trial tested the claim that learning music makes you smarter. Students were randomly assigned either to music or drama classes, and then tested for literacy and numeracy. The researchers found no difference between the two groups; suggesting either that learning music isn’t as good for your brain as we’d thought, or that drama les­sons are equally beneficial.

In a similar vein, a recent randomised trial of free school breakfast programs in New Zealand schools found that it reduced hunger rates (by 8.6 units on the ‘Freddy satiety scale’, in case you’re curious). However, free breakfasts did not improve school attendance or academic achievement for low-income children.

Unfortunately, attractive as this approach is, it isn’t really an option for most of the sorts of policy interventions I write about here, which are economywide by construction.  One can’t split the country into 100 different monetary regions, and apply different OCRs to each (chosen randomly) –  and nor, frankly, should one want to.   Even if some global dictator could do it across countries, there are far too few countries (and so many differences across them) for the results to be anything as valid as those from an evaluation of (say) a school music programme with (say) 500 kids split randomly into groups participating and not participating in the programme.  The same goes for aggregate fiscal policies, or immigration policies.  One might, perhaps, be able to do randomised trials around small aspects of, say, the Essential Skills visa programme, but not about overall approaches to immigration.  I

Instead, we are forced back onto looking what is really a small range of countries (say 40 advanced countries), over relatively short periods of history (the last couple of hundred years), and –  given that and all the other individually confounding factors –  it is perhaps less surprising that people of goodwill still differ on quite what role some of these policy interventions have to play, and what their overall effects are.  Of course, many other areas of policy are much the same –  think foreign affairs and defence –  and the difficulty of reaching of conclusive results doesn’t change the importance of ongoing analysis, research and debate, testing and evaluating the relevant comparisons and insights that history (our own and others), theory, and current experience appear to be offering.

Small size simply isn’t the issue

Just yesterday I wrote, in response to a comment, that

My point simply was that there is no obvious correlation, in the cross section, between population size and GDP per capita (or productivity). I’m not aware of any serious observer arguing otherwise

At the level of very simple correlations, I’d illustrated this lack of relationship –  whether for all countries, just advanced countries, excluding the handful of extremely large countries, or whatever.  Bigger countries (by population) don’t, on average, have higher per capita incomes than smaller countries.

But then I went to a seminar at the Productivity Commission yesterday afternoon, attended by various private and public sector people.  The substance of the seminar –  a new MBIE report on the manufacturing sector, and the discussion of it and of possible policy responses –  is embargoed until David Parker releases the report next week.   But I hope I’m not breaching any rules in simply reporting that I noted around the room an almost unquestioned acceptance that size (small) is one of New Zealand’s economic problems.  Normally I might barely have noticed it, but having been writing about the topic in the last few days, it niggled away at me.

The more I’ve thought about that issue over the years, the more I’ve concluded that those who hold it are simply wrong, and perhaps in the thrall of the political equivalent of Keynes’s “defunct economists”  –  the long tradition of political leaders, dating back at least to Vogel, who’ve wanted, as a matter of policy, a lot more people in New Zealand, believing (presumably) that New Zealanders would be better off as a result.  There doesn’t seem to be much –  any? –  evidence in support of any economywide economic benefits flowing from this preference.

One hears talk in such discussions of ideas like “markets work better in big economies”, or even talk of economies of scale –  or opportunities for specialisation – in government/regulation.  In principle, the arguments sound plausible enough.

But they rarely seem to confront the simplest stylised data.  For example, Australia and New Zealand are almost equally remote (on standard measures), but Australia’s population has been consistently much higher than ours, and yet for a century (say 1860 to 1960) material living standards (GDP per capita) were much the same on the two sides of the Tasman.

Or we could look at some advanced countries where distance/remoteness is much less of an issue.  In what follows I’ve looked at the OECD member countries in Europe (continental plus the UK and Ireland).  There are 24 of them, ranging in population from Germany’s 82 million to Luxembourg’s 0.6 million.  Five of these countries – New Zealand’s size or smaller – didn’t even exist as independent states thirty years ago.

In this chart –  for 2016 –  I’ve ordered those 24 countries by population size and shown the real GDP per capita for each.  I’ve also shown the median (so not distorted by Luxembourg, or issues around Irish tax) for the group of countries with a population less than 10 million, and also the median for the large European OECD countries.

europe real GDP and popn

If anything, the typical larger country has a lower per capita income than the typical smaller country.  Of course, these are small samples, so not much weight should be put on them, but there is nothing to suggest bigger countries are performing better than smaller countries.  And if one insisted on excluding the former communist countries – even though they are now 25 years on as market economies –  the gap (in favour of the smaller countries) – is larger.

In many respects,  real GDP per hour worked  (labour productivity) is a better metric of economic performance.  Here is the same chart, for 2016, using the OECD’s data on productivity.

europe real gdp phw and popn

I could exclude Ireland and Luxembourg, I could exclude the ex-communist countries, I could add to the “small” category the countries (Portugal to Belgium) with populations just over 10 million, and it won’t change the story.  There is nothing in the simple stylised facts of European OECD countries suggesting that bigger countries do better than smaller ones.  Even at the most prosperous core bit of Europe (London is the richest –  by income –  region in Europe), Belgium, Switzerland, Denmark and Austria do really well.  And so do France and Germany (the UK less so).

Of course, there are lots of other things that help explain any individual country’s performance. Norway, for example, wouldn’t rank so high without oil, or Ireland without the features of its corporate tax policy which see a lot more economic activity booked in Ireland than directly results from economic activity occurring in Ireland.  One issue, of course, is the quality of policy.  There are lots of different dimensions of that, and sometimes one sees a story in which small countries try harder, regulate less, or whatever to overcome the alleged disadvantages of size.   One widely-used indicator is the OECD’s index of product market regulation.  As it happens, the PMR score for the median small country in OECD Europe is less good (ie more less-liberal regulation exists) than in the median large country.

Smarter people with richer datasets and serious econometric skills can produce much more complex models, encapsulating a lot more information simultaneously.  But whatever the results of such models –  which often end up depending on the modellers’ embedded assumptions –  it is always worth bringing them back to check against the simplest stylised facts.  Even in a region where distance is much less of a differentiator among countries (it isn’t nothing –  Portugal and Greece would have it tougher than Belgium and the Netherlands even with great policy) population size doesn’t seem to be an advantage, and isn’t associated with either higher GDP per capita or higher productivity.

For decades, I’ve used the line that if only we could detach New Zealand from the ocean floor and relocate it –  land and all –  in the Bay of Biscay, just off the coast of France we’d be much better off materially, all else unchanged.  Perhaps the North Sea would be even more propitious.  But the point remains, the biggest handicap to economic success in New Zealand is our distance/physical remoteness –  in an age when, across the board (although with individual pockets otherwise) distance isn’t becoming less of an issue, but perhaps even more of one.    A modest number of people probably can do very well here, but not many.   And yet our policymakers –  aided and abetted by official advisers –  keep driving policy to locate ever more people in a really quite unpropitious –  even if beautiful and (now) peaceful –  location.

There is simply no evidence supporting the notion that our small size is “the problem” (or even a material part of it), and when the story continues to be invoked it simply serves as a distraction –  mostly unwittingly so –  from a focus on the real issue, responding realistically to the unchangeable (absent quite different technologies) constraints of our physical isolation.

A “very, very healthy economy”?

In his press conference with the Minister of Finance, the day before taking office last week, the new Governor of the Reserve Bank offered some brief and gratuitous thoughts on the state of the New Zealand economy.

Orr said he was happy with where the economy was at the moment.

“I’d say that we are running a very, very healthy economy at the moment,” he said.

In one sense, it doesn’t greatly matter what the Governor of the Reserve Bank thinks.  His primary (monetary policy) job is to keep core inflation near 2 per cent (something Graeme Wheeler failed to do).  There isn’t much connection between whether or not an economy is doing well in some medium-term fundamental sense and the average inflation rate.

Then again, Orr is now the most prominent (and powerful) public sector economist, and was sharing a stage with the Minister of Finance.  Intended or not, his comments could reasonably be seen as an endorsement of economic management and performance by past and present governments. An endorsement of the status quo in fact.

Perhaps that wasn’t the Governor’s intention. Perhaps it was just the first thing that came to mind on his big day and he didn’t stop to think what he was saying? But perhaps he genuinely believes it, which in some ways would be even more concerning.   Especially as it is presented as an unconditional, absolute, statement, with two intensifiers.  If we take the Governor seriously, things must really be doing well here.

I’m not sure what the Governor had in mind.  But when I rack my brain and look for whatever positives I could find, this is what I came up with:

  • the terms of trade are near record levels,
  • government debt is pretty low, and the government operating accounts are in surplus,
  • the financial system appears to be sound,
  • after nine years above, the unemployment rate is now finally down to around the level the Reserve Bank thinks of as the NAIRU (the non-accelerating inflation rate of unemployment).

Try as I might, I couldn’t find anything more that suggested a “very very healthy” economy.  There were a few other indicators that perhaps a lay observer might try to cite, but economists probably shouldn’t:

  • employment rates are quite high.  We don’t put too many regulatory/tax obstacles in the path of employment (a good thing), but employment is a still cost –  foregone leisure –  not a particular achievement.  Unemployment and underemployment rates are typically the better indicators (when lots of people want work and can’t find it that is a problem),
  • interest rates are low.  As they are around the world, reflecting how difficult the advanced world has found it to achieve sustained growth since the last recession.  Ours remain well above those in most other advanced countries,
  • our balance of payments current account deficit is less than it was (and the external debt –  % of GDP –  is less than it was).  This is partly a reflection of unexpectedly low interest rates –  servicing costs are less than they were, and partly of pretty subdued investment,
  • headline annual GDP growth rates have not been high –  by standards of earlier growth phases –  but have sounded respectable enough (typically with a 3 in front of them).   But much of that simply reflects unusually rapid population growth rates.

And on the other hand, and in no particular order

  • how could we go past house prices?  How can the Governor –  of all people –  consider our economy to be “very very healthy” when house and urban land prices are so far out of whack that few young can any longer afford to buy a basic first home?
  • even if, on some metrics, we’ve done less badly than some countries in the last decade, almost the whole advanced world has done absolutely poorly.  Investment and productivity growth have typically been weak, and interest rates have needed to be astonishingly low for prolonged periods (not yet over) simply to support demand and activity.
  • real per capita GDP growth, even at peak, has been weaker than in previous recoveries,
  • if most of the advanced world has done quite poorly, New Zealand started so far behind that we needn’t have been badly affected.  Simply catching up some way towards the frontier would have been a considerable achievement.  But we haven’t. There has now been almost no labour productivity growth here for the last five or six years, and that shows no sign of changing yet.
  • inflation has been (is still) persistently below target (and thus below the level successive governments and Governors have considered desirable for the best possible economic outcomes),
  • although interest rates are low in absolute terms, they remain above those in most other advanced countries, for reasons that have nothing to do (see above) with superior productivity performance.
  • rates of business investment remain very subdued (despite, for example, the strong terms of trade, or rapid rates of population growth).
  • the growth in the economy has continued to be concentrated in the non-tradables sectors, rather than the bits in which New Zealand firms successfully compete against international competition here or abroad.   I haven’t shown this (indicative) chart for a while
  • T and NT to Dec 17
  • relatedly, the export share of GDP has been shrinking, when a typical aspect of any successful economic catch-up has involved a rising share of exports, as the success of domestic policy and domestic firms translates into more firms and more products beating the world (in turn, enabling more of what the world produces to be imported).
  • the real exchange rate remains very high, well out of line with developments in relative productivity and terms of trade trends.
  • meanwhile, among the other relatively poor OECD members many that did far more wrenching economic reforms than we did 25 or 30 years ago (and they needed to do more) really are making progress to catch the OECD leaders. In some cases, their average productivity levels are already at New Zealand levels, and almost all are growing faster than New Zealand.

And all that without even getting to the risks and costs that seem set to flow from grappling with things like improving water quality, and with successive government’s commitments to reducing carbon emissions, in a country with some of the highest marginal abatement costs anywhere.

Quite how the Governor can seriously think –  if he really does –  that this is a “very very healthy” economy is a bit beyond me.  It has the feel of ill-considered quasi-political rhetoric.  In a post a few weeks ago (with charts illustrating some of the points above) I called it a rather moribund economy, and that still seems right to me.

My young daughter asked me “what boring stuff are you writing about this morning”.  I told her it was about the health, or otherwise, of New Zealand’s economy.  “Does the economy have cancer?” she asked.  It isn’t like that I said, more like some chronic condition that won’t kill us, probably won’t even end in a crisis, but constantly holds us back from achieving what we might, from delivering better material living standards for New Zealanders.   The Governor of the Reserve Bank has a defined and limited job to do, which he can do whether or not the chronic ailment is fixed.  But he shouldn’t use his office and bully pulpit it provides to help politicians evade responsibility for the decades of disappointment.  The status quo has failed, is failing, and seems set to go on failing.

So much company tax, so little investment

Almost 10 years ago I stumbled on this chart in the background papers to Australia’s tax system review.

Chart 5.11: Corporate tax revenue as a proportion of GDP — OECD 2005

Aus company tax as % of GDP 2008

I was intrigued, and somewhat troubled by it.   New Zealand collected company tax revenue that, as a share of GDP was the second highest of all OECD countries.   And yet New Zealand:

  • didn’t have an unusually large total amount of tax as a share of GDP, and
  • had had quite low rates of business investment –  as a per cent of GDP –  for decades, and
  • as compared to Australia, just a couple of places to the left, New Zealand’s overall production structure was much less capital intensive (mines took a lot of investment).

And, of course, our overall productivity performance lagged well behind.

Partly prompted by the chart, and partly by a move to Treasury at about the same time, I got more interested in the taxation of capital income.   After all, when you tax something heavily you tend to get less of it, and most everyone thought that higher rates of business investment would be a part of any successful lift in our economic performance.  That interest culminated in an enthusiasm for seriously considering a Nordic tax system, in which capital income is deliberately taxed at a lower rate than labour income.  It goes against the prevailing New Zealand orthodoxy –  broad-base, low rate (BBLR) –  but even the 2025 Taskforce got interested in the option.

Flicking through the background document for our own new Tax Working Group the other day I came across this chart (which I haven’t seen get any media attention).

company tax revenue

It is a bit harder to read, but just focus for now on the blue bars.   On this OECD data New Zealand now has company tax revenues that are the highest percentage of GDP of any OECD country.   A footnote suggests that if one nets out the tax the government pays to itself (on businesses it owns), New Zealand drops to only fourth highest but (a) the top 5 blue bars are pretty similar anyway, and (b) it isn’t clear who they have dropped out (if it is just NZSF tax that is one thing, but most government-owned businesses would still exist, and pay tax, if in private ownership).

So for all the talk about base erosion and profit-shifting, and talk of possible new taxes on the sales (not profits) of internet companies, we continue to collect a remarkably large amount of company tax (per cent of GDP).  Indeed, given that our total tax to GDP ratio is in the middle of the OECD pack, we also have one of the very largest shares of total tax revenue accounted for by company taxes.

The Tax Working Group appears to think this is a good thing, observing that it

“suggests that New Zealand’s broad-base low-rate system lives up to its names”

There is some discussion of the trend in other countries towards lowering company tax rates, but nothing I could see on the economics of taxing business/capital income.  It is as if the goose is simply there to be plucked.

There are, of course, some caveats.   Our (now uncommon) dividend imputation system means that for domestic firms owned by New Zealanders, profits are taxed only once.  By contrast, in most countries dividends are taxed again, additional to the tax paid at the company level.    But, of course, in most of those countries, dividend payout ratios are much lower than those in New Zealand, and tax deferred is (in present value terms) tax materially reduced.

And, perhaps more importantly, the imputation system doesn’t apply to foreign investment here at all.   Foreign investment would probably be a significant element in any step-change in our overall economic performance.  And our company tax rates really matters when firms are thinking about whether or not to invest here at all.  And our company tax rates are high, our company tax take is high –  and our rates of business investment are low.  Tax isn’t likely to be the only factor, or probably even the most important –  see my other discussions about real interest and exchange rates – but it might be worth the TWG thinking harder as to whether there is not some connection.

Otherwise, as in so many other areas, we seem set to carry on with the same old approaches and policies and yet vaguely hope that the results will eventually be different.


The boondoggle

Earlier this week, Kiwirail released its most recent half-yearly financial result.  Once again, the taxpayer was poorer for their operations.   They make great play of a modest “operating surplus” but I rather liked this summary table from their latest Annual Report

kiwirail

In other words, no returns to shareholders at all; in fact losses in one year of a third of the (periodically replenished) shareholders’ funds

Last year, they had operating revenues of $595 million, and an overall loss of $197 million (much the same as the year before).  So roughly a quarter of their overall costs are not covered by income.   As an organisation –  and with all due respect to the energies of individual employees (including the five earning in excess of $500000 per annum) – it has all the appearance of being a sinkhole, absorbing more of the scarce resources of taxpayers each year.

And before people start objecting that roads don’t make a profit, it is worth remembering that airlines do and coastal shipping operations do –  and, if they don’t, they usually go out of business.

An organisation that operates such large losses (acquiesced in by successive shareholder governments) clearly isn’t one that applies the most demanding tests possible to the question of whether individual lines should be opened or closed.  Occasionally people attempt to justify government intervention in this or that activity on (questionable) grounds that the private sector is applying too high a cost of capital.  But in this case, the state operator’s average return on capital (ie over all its operations) is substantially negative, and it has no expectation of changing that.

A few years ago, Kiwirail closed the Gisborne to Napier line.  Rail volumes had been low and falling –  some trivial portion of the volume that Kiwirail estimated would have been required to make the line viable.  But ever since, there have been people hankering for the line to be reopened.

And yesterday, as part of the first wave of projects approved under the new Provincial Growth Fund, the Minister of Regional Development announced that

“We’re also providing $5 million to Kiwirail to reopen the Wairoa-Napier line for logging trains, taking more than 5700 trucks off the road each year.”

 In the more detailed material released with the announcement there is a suggestion that the Hawkes Bay Regional Council may also be putting in money.

There is no sign of any cost-benefit analysis of this proposal having been released at all. But we can assume that the proposal wouldn’t pass any standard (weak) Kiwirail commercial test since otherwise Kiwirail would have reopened the line without taxpayers’ having to chip in more money directly.

There used to be some logs/timber carried on the Gisborne-Napier line, but a reader pointed me to the numbers: in the final full three years of operation, a total of 327 tonnes of it.

There are, apparently, going to be a lot more logs to move in the coming years.  In the Minister’s words

“The wall of wood is expected to reach peak harvest by 2032 so reopening this line will get logging trucks off the road and give those exporting timber options that they currently do not have,” Mr Jones says.

“It makes sense to consolidate that timber in Wairoa and use rail to take it to the Port of Napier.

Except that apparently officials and Kiwrail had already looked at this option a few years ago.  In a report released only a few year ago it was noted that

“We note that Kiwirail was not convinced this would be finanically viable for users given the relatively short distance involved and the need to double-handle the logs.  Industry feedback has also indicated that transport of logs on rail across the study area was unlikely to be economic.”

Perhaps the economics has suddenly changed?  But, if so, where is evidence?  None was published yesterday.   We aren’t even told what assumptions are being made about how much of the logging business will be captured.

The Minister’s release also argued that there were climate change benefits from this move

“It will also mean 1,292 fewer tonnes of carbon dioxide released into the atmosphere each year.”

Even if this were relevant –  don’t we have an ETS supposed to deal directly with pricing emissions? –  and accurate (what assumptions are being made, including about the carbon costs of the double-handling?), it sound doesn’t terribly impressive.  A single 747 flying to London and back once apparently emits 1100 tonnes of carbon dioxide.

This is just one of the numerous projects the government is going to spend money on in the next few years.  I’ve only looked through the Gisborne/Hawke’s Bay list, and none of it fills me any confidence.   What, for example, is central government doing on this?

The Provincial Growth Fund will provide $2.3 million to redevelop the Gisborne Inner Harbour as part of a wider tourism investment programme.

If, as the Minister claims,

“Tairāwhiti is brimming with potential and untapped opportunities

you would have to wonder why the private sector, and the local authorities, don’t seem to think them worth spending money on.  (On my story, a materially lower real exchange rate would help quite a bit, but the government shows no sign of addressing that.)

A couple of weeks ago, I commented on the Minister of Finance’s underwhelming exposition of what the government was going to do to transform the productivity outlook in New Zealand.   The Minister noted

A major example of this is the Provincial Growth Fund developed as part of our coalition agreement with New Zealand First.  This will see significant investments in the regions of New Zealand to grow sustainable and productive job opportunities.

To which my response was

If it ends up less bad than a boondoggle we should probably be grateful.  It isn’t the sort of policy that has a great track record, and it is hard to be optimistic that one new minister –  with a vote base to maintain –  is going to transform the sort of flabby thinking around regional development presented at Treasury late last year.  

hen again, the Secretary to the Treasury might quite like the idea of paying to reopen the Napier-Wairoa line.  I’ve told previously the story of Gabs Makhlouf, fresh off the plane from the UK, lamenting that the one thing New Zealand hadn’t sufficiently taken from the British Empire experience was to invest more heavily in rail (in response, assembled Treasury officials were not quite being sure where to look).

Sometimes economic policy in this country seems almost designed to defy reason and evidence in an effort to make us poorer, to hold back national productivity prospects.  Spraying around $5m here and $5m there –  $3 billion over three years, in some scheme reminscent of congressional earmarks in the United States – not backed, it seems, by any robust supporting analysis, seems just another  step along that path.

Robertson on productivity: not much basis for confidence

I’m not going to write much about the Productivity Hub (Productivity Commission, MBIE, Treasury, and Statistics New Zealand) conference yesterday on “Technological Change and Productivity”.   Not all of it was even about productivity, not all of it was even relevant to New Zealand (there was a genuinely fascinating presentation from a US academic on the economics of wind and solar power, which must matter a lot if half your power is generated from fossil fuels, but rather less so in a country where 90 per cent of power is hydro-generated).   And there was lots of focus on micro data on firm (or agency) level productivity, even though no work in that area has yet been shown to shed much light on the large gap between economywide average productivity in New Zealand and that in most other advanced OECD countries.   But the “Reddell hypothesis” did get a (positive) mention from the platform, when the Productivity Commission’s Director of Economics and Research, Paul Conway, reprised some of the thoughts from his 2016 “narrative”, highlighting the likely importance of the macroeconomic symptoms: persistently high real interest rates (relative to other countries) and a high real exchange rate.   Conway suggested that we should focus much more on bringing in highly-skilled migrants, and that if that led to a reduction in total numbers that might well be a good thing.     With 47 MBIE people among the 200 or so (mostly public service) registrations, I don’t suppose that proposition commanded universal assent, but there wasn’t any further open discussion.

I couldn’t stay for the final session, but fortunately that speech has been made widely available.  The Minister of Finance gave an address on “The Future of Work: Adaptability, Resilience, and Inclusion”.   At one level, I was pleasantly surprised: there was more about the productivity challenges New Zealand faces (our overall underperformance) than I’d expected.  And if I’m sceptical about the Treasury Living Standards Framework, and attempts to build policy around “well-being”, I couldn’t really disagree with the thrust of this line from early in the speech

Improving productivity is key to improving wellbeing. By producing more from every hour worked, businesses become more profitable, incomes rise, and workers’ wellbeing rises as time is freed up and purchasing power rises.

And it was good to have the new Minister of Finance remind us that productivity growth (lack of it) has been a longstanding problem in New Zealand.  Although even then he seemed inclined to underplay the problem: for example, basically no productivity growth at all for the last five years.   And he noted that GDP per hour worked is now around “20 per cent below the OECD average”.   But since the average includes places like Turkey and Mexico, and a group of countries (ex eastern bloc) which weren’t market economies at all 30 years ago, it might be better to highlight the point I made in yesterday’s post:   for New Zealand to catch up with the G7 economies as a whole, we’d require a 50 per cent lift from current levels (assuming those countries had no growth at all), and to match that group of highly productive northern European economies (France, Belgium, Netherlands, Germany, Switzerland and Denmark), we’d need more like a two-thirds increase.   Even to catch Australia –   which lags some way behind the OECD leaders –  would take a 40 per cent increase in economywide productivity.   That lost quarter-century won’t be regained easily.

But it is one thing to recite these numbers (early in one’s term as Minister of Finance).  As even Robertson put it

I am most certainly not the first New Zealand politician to both highlight the challenge of low productivity, nor to say that we will address it.  So the proof will be in what we actually do. 

And what is on that “to do” list?   And that is where it gets a bit disconcerting.

There are a couple of the reviews underway

Our Tax Working Group and the reforms we are making to the Reserve Bank Act are an important part of setting the path to a more productive economy.  That focus on improving productivity is at the heart of the terms of reference for both these reviews.

No serious observer believes that the sorts of changes foreshadowed for the Reserve Bank Act –  desirable as the general thrust might be –  will make any difference whatever to the trend level of productivity in New Zealand.  Monetary policy just isn’t that potent.  As for the Tax Working Group, a (limited) capital gains tax might, or might not, be a good idea but I’d be surprised if anyone believed it would make a very material difference to overall economic performance (and, after all, much of the TWG documentation has a prime focus on fairness).    For all the talk about “too much investment in housing” recall –  as the Minister doesn’t in his speech –  that a key element of government policy is building lots more houses.  Resources used for one thing can’t be used for other things.

What else is the government planning?

The government has committed itself to the goal of a net zero carbon economy by 2050.  This is an essential shift for New Zealand away from an economy that hastens climate change to one that is more sustainable and develops New Zealand’s strategic advantages.

We will need to ensure this is a just transition where affected industries and communities are given the support to find new sustainable growth opportunities.

Again, you might or might not think this is a worthwhile goal, but it isn’t going to lift economywide productivity relative to what would have happened without the net zero goal.   Even the Minister is here focused on smoothing transitions, minimising disruption.

Then there is skills.

The Future of Work was the catalyst for our three years’ free training and education policy. One of this Government’s key policies is to provide one year of free post-secondary education or training, gradually progressing to 3 years by 2025.

So in a country where the OECD data suggest that the skill levels of New Zealand workers are already among the very highest in the OECD, the government is going to spend rather a lot of money (all funded by taxes, with their deadweight costs), in the expectation that a marginal cohort of people who would not otherwise have invested in formal training/education will now do so.  Most of the immediate gains will go to people who would in any case have gone to university (or done other comparable training)  –  I’m expecting my kids to be in that category –  and most of the people who take up formal training who otherwise would not have done so, are likely to well below the leading edge in terms of productivity potential.    If there are gains at all economywide –  which seems unlikely, but I’m open to persausion –  they will almost certainly be pretty small.  It is mostly a middle class welfare policy, not a productivity policy.

Then there is regional development policy

A major example of this is the Provincial Growth Fund developed as part of our coalition agreement with New Zealand First.  This will see significant investments in the regions of New Zealand to grow sustainable and productive job opportunities.

The details of the Fund are to be released shortly and will provide some of the most significant development of our regions in decades.  These will be driven from the ground up, with the Government as an active partner.

If it ends up less bad than a boondoggle we should probably be grateful.  It isn’t the sort of policy that has a great track record, and it is hard to be optimistic that one new minister –  with a vote base to maintain –  is going to transform the sort of flabby thinking around regional development presented at Treasury late last year.   At very very best, it is all rather small beer.  Recall that we need a two-thirds lift in economywide average productivity to catch those northern Europeans.

It goes on

It is my strong belief that the most critical element to New Zealand succeeding in the Future of Work is a renewed social partnership between businesses, workers and the government. 

If we look at Germany as an example, union members often sit on company boards as part of the decision-making process, ensuring that employee wellbeing is considered alongside high-level corporate profit and financial targets.

One of my goals as Minister of Finance is to develop this new partnership at a system-wide level to promote a combined work stream on how we can apply these lessons to other industries and sectors. 

Maybe the Minister doesn’t see this sort of stuff mostly affecting productivity performance.  But if not, what will?

Perhaps R&D.

In the Coalition Agreement with New Zealand First we have set a target of hitting an R&D spend of 2% of GDP in ten years. That’s more than a 50% increase in R&D investment relative to GDP over that time and will make a significant contribution to improving our productivity.

Officials say that this is an ambitious goal. We believe this can be done, with the Government incentivising such vital work by the private sector.

Minister for Research, Science and Innovation, Megan Woods, has already begun work on overhauling New Zealand’s R&D regime, with Ministers set to discuss officials’ initial findings later this month. We are committed in the first instance to restoring R&D tax credits to give firms some certainty about their investments.

But, as with earlier comments the Minister made in his speech about relatively low rates of business investment, there is no suggestion that the government has thought about what it is in the economic environment that leaves private businesses –  pursuing profit opportunities where they find them –  unwilling to spend more, whether on R&D or investment.

It was interesting that the Minister of Finance chose to highlight comparisons with Germany in his speech.  As I’ve pointed out in an earlier post,  Germany doesn’t have an R&D tax credit (actually of those successful northern European countries I highlighted earlier, neither does Switzerland) –  although the senior OECD official whose seminar I attended the other day, who didn’t seem wildly enthused about the merits of such tax credits, did note that the German government is under business pressure to introduce such a scheme because, eg, France and the Netherlands have them.

There are stories galore about what gets claimed for under R&D tax credits, and one person at the seminar the other day indicated that the Australian government is currently looking to wind back its R&D tax credit, having realised that a significant amount of money is being rorted.  If free tertiary education is (largely) welfare for middle class parents and their children, R&D tax credits look like welfare for the owners (often foreign) of businesses.    The R&D spending already happening would, presumably, have taken place anyway, so if there is to be a tax credit in respect of that spending it is pure gift (on top of the advantage of being able to immediately expense anyway).   There will be significant incentives to reclassify some activities as R&D that weren’t previously (because there was no advantage to doing so).  Some of that will bring to light genuine R&D spending that wasn’t previously visible – slightly tongue in cheek, the OECD official noted this was one advantage of R&D credits.   Other spending won’t really be R&D at all, and IRD will be engaged in a constant battle to hold the line.  And perhaps there will be some additional R&D work undertaken that wouldn’t otherwise have occurred.  But surely –  a bit like the increased teritary participation that will flow from fee-free study –  most of that will be, almost by definition, the least valuable, most marginal, activities; the stuff not worth doing without a subsidy?

It is, frankly, a bit hard to believe that even the best R&D tax credit –  and I gather MBIE officials are working hard to limit any abuses and wasteful transfers in the forthcoming tax credit –  will be a transformative part of the story.

Let’s go back to those northern European countries, with a slide from the OECD official’s presentation:

pilat

France –  third bar from the left –  has some of most generous government support for business R&D of any country in the OECD database, including a generous tax credit.   That support has materially increased in the last decade, but it was still fourth highest in 2006 (the white diamond).   Germany (DEU) has low overall government support, and no R&D tax credit at all.     These are both advanced industrial economies, situated right next to each other, with lots of trade between them.   And here is OECD data on the respective levels of real GDP per hour worked.

fr and ger

Identical at the start, identical at the end, and never –  through the whole period (Mitterrand, absorbing East Germany or whatever) – any very material deviation between the two lines.  It is the sort of relationship –  univariate and all –  that makes it more than a little hard to take seriously suggestions that introducing an R&D tax credit here will make any material difference to our relative productivity performance.

And here is the OECD data (for 2015) on R&D spending in each of those six highly productive northern European countries, and New Zealand.  “BERD” is business expenditure on research and development.

R&D spend n europe.png

Remember that Germany and Switzerland are the two of the northern European group that don’t have R&D tax credits, and provide little direct government support to business R&D.   I’m not suggesting any sort of perverse relationship  –  a lot probably depends on the specific sectors businesses in particular countries concentrate on – but it should at least be a little sobering to reflect that the two countries in that grouping with no R&D tax credits have higher rates of business spending on R&D than any of the other countries in the group (even with all the incentives that such credits create to classify spending as “R&D”).  One might wonder if the big French incentives –  increased in the last decade –  might not have been sold on the basis on “we are lagging behind Germany in R&D spend” and need to “do something” to catch up.

Mostly, a reasonable hypothesis still looks to be that firms will invest (including spending on R&D) when it appears to be profitable for them to do so.  If so, it might be better to spend some more time understanding what holds firms back –  addressing issues at source if possible –  rather than just throwing more government money at a symptom.  There isn’t much sign the government has done anything more than highlight a few trendy symptoms, rather than really engaging in an integrated narrative of New Zealand’s economic performance.  The Minister of Finance concluded his speech yesterday

I want us to re-write our productivity story, so that New Zealand becomes a leading example of a sustainable and productive economy in which everyone gets a share of economic success.

It is a worthy aspiration –  shared, no doubt, by a long line of predecessors stretching back decades –  but there is little sign of the sort of serious thinking –  or even engagement with the full range of symptoms (eg weak export share, high real interest rates, high real exchange rate, physical remoteness and yet rapid population growth) – that would provide much reason for confidence that they might yet devise an effective strategy to respond to the specifics of New Zealand’s situation.

And since a common response whenever I write along these lines is “but what would you do differently?” here are links to a version of my story given to a business audience , a version given to the Fabian Society, a more recent version to a general audience.   In the margins of the conference yesterday, one person commented that he thought one problem was that few officials had read my original paper, prepared a few years ago for a Reserve Bank/Treasury-hosted conference, which puts the basics of the argument in a standard two-sector (tradables and non-tradables) analytical framework, here is the link to that paper too.


More than a quarter of a century behind the advanced world

I’m spending today in a conference organised by the Productivity Commission and various government departments on technological change and productivity.  Yesterday afternoon I went to a seminar at the Productivity Commission at which one of the conference speakers, a senior OECD official, was speaking on technology, “innovation policy” etc.  It had been billed as something that would address the huge gap between New Zealand average productivity levels and those in much of the rest of the OECD.  In fact, it hardly touched on that issue at all, and much of the discussion had the feel of analysis and advice for the OECD grouping as a whole, and particularly its more advanced members (the speaker himself was Dutch), rather than for a laggard country.

For New Zealand the biggest challenge, by far, is –  as it has been now for some decades –  catching-up again.  Decades ago we were at or near the frontier –  economic frontier that is, rather than physical remoteness –  with per capita incomes in the top 2 or 3 in the world.  These days, probably a few New Zealand firms are at or near the frontier, but the overall New Zealand economy lags quite badly behind.

My favourite base for comparison is real GDP per hour worked.  Levels comparisons are really only approximate, but using OECD data –  based on the 2010 purchasing power parity (PPP) exchange rates –  here is how New Zealand’s real GDP per hour worked compared to the OECD countries that have higher average productivity than we do.   You could discount Ireland to some extent –  there are some measurement/classification issues around their tax system, and in truth productivity in Ireland might be nearer German or Dutch levels. On the other hand, I don’t show Slovakia which, on this particular metric, went past us a couple of years ago.

GDP phw Feb 18

As it happens, of the 23 bars shown, the G7 countries’ total is the median observation.  Our real GDP per hour worked in 2016 was only 67.6 per cent of that for the G7 group of countries as a whole.  In other words, it would take a 50 per cent increase from here –  with no change in those countries – for us to catch up again.   If we take the subset of countries from Belgium to Germany, it would take about a two-thirds increase in our average productivity to catch up again.  When the OECD data series starts –  1970 –  average productivity here was about equal to that of the G7 countries as a whole.

Another way of looking at these same data is to look at when other countries reached the level of productivity New Zealand had in 2016 (37.5 USD per hour, expressed in real 2010 terms, converted at PPP exchange rates).

Some of the other OECD countries first get to that level in the early-mid 70s (Luxembourg, Switzerland, Netherlands, Norway).  Two only got to our current level in the mid 2000s (Iceland and Japan), but of course even that leaves us at least a decade behind.    The G7 countries as a group got to our current level of real GDP per hour worked in 1990, and the median country (as per the chart above) got to our current level of real GDP per hour worked in 1989 –   27 years, or just over a quarter of a century, ahead of us.  Jacinda Ardern would have been in primary school then.

One can’t too much weight on the precise numbers/data –  different conversion rates will produce somewhat different gaps –  but the gaps are huge, and we –  in aggregate – are a long way behind.  I’m hoping –  but am not optimistic –  that today’s conference might help shed some further light on the matter.  I’d settle for some hardheaded realism about how far behind we now are –  lagging the core of the advanced world (the countries we usually liked to compare ourselves too) by a quarter of a century now.

And, of course, the idle hope is that some political leaders might (a) care and (b) set about doing something about closing the gap.  Productivity is the foundation for prosperity, and many desirable social goals.  It isn’t everything of course –  even if, in economic terms, it is almost everything in the long run.   But in all the hoopla about the first 100 days of the government, or even its challenges for the next thousand, there wasn’t any sign of a determination to reverse these decades of underperformance.  Sadly, although there were a few references to the productivity failure during the campaign, the new government seems to have lost interest even faster than their predecessors did.

Remote regions, immigration, and prosperity

A couple of years ago I did a post on some remote and very small places, many of which had quite a lot of land and very few people.  My point was to suggest that New Zealand was quite unusual in having so many people in such a remote spot, all the more so when much of the population growth had been accounted for by deliberate immigration policy.    As readers will know –  apart from anything else, I keep pointing it out –  over at least the last 70 years, productivity growth here has been pretty poor and we’ve drifted a long way down the global league tables.  My proposition is that the two stylised facts aren’t unrelated.

At the time of the earlier post, my young daughter was fascinated by a book on remote islands.   At the moment –  a bit older now –  she’s got really interested in Wales and keeps telling me all sort of interesting snippets.  But talking with her about Wales reminded me that at the time of the Lions Tour last year I’d been meaning to write a post highlighting just how little population growth there had been in some of the outer reaches of the United Kingdom.

More generally, I’d been thinking about how global studies attempting to assess the economic impact of immigration focus on comparing across countries.  In some ways, that makes sense –  data are often easier to come by, and countries control immigration policies.    But I suspect there is information in the experiences of remote regions.   After all, if there were typically really good economic opportunities in remote regions, people in a country are free to move there.  The population of the United States, for example, has risen by over 200 million people in the last 100 years –  through a mix of immigration and (mostly) natural increase.  Those peope have been free to locate themselves where the best opportunities are.   One can think of parts of Canada or Australia in the same way.  And if our politicians had made different choices in the 1890s, we could simply have been part of the Australian Commonwealth, and it seems unlikely that the economic opportunities here would have been much different if that choice had been made.

Here I’ve focused on the last 100 years or so.   Why?  Mostly because just prior to World War One New Zealand had probably the highest (or 2nd or 3rd highest) GDP per capita of any country in the world (per the historical tables put together by Angus Maddison).  But it was also some decades on from the first big waves of colonial settlement (whether here, Australia, Canada, or the mid-west and west of the United States).  At around 1 million people in the 1911 Census, New Zealand was already a functioning country of reasonable size (not large, but there are many smaller countries even today).

In this table I’ve focused on population growth between the Census nearest 1910 and the most recent Census (in most cases 2010 or 2011, but in New Zealand 2013).   The chart shows the percentage increase in population for these remote regions of countries, plus that for New Zealand  (Nebraska gets chosen as a “remote” US area mostly because I happen to have been there a few times.)

remote regions

Australia and Canada (and the US) have had rapid national population growth rates, but these remote regions  (Nebraska, Newfoundland, and Tasmania) have had much lower population growth rates than New Zealand.  (And, on checking, each of those three have lower population densities now than New Zealand does.)   But given that all of these regions have small populations, relative to the respective nation’s total population, there would have been nothing to stop lots of people gravitating to the remote spots if there was real evidence of good economic opportunities for many people in those places.

It has, after all, happened in some remote regions: West Australia for example, now has about 10 times the population it had in 1910, presumably attracted by the mineral resources that mean West Australia has the highest GDP per capita of the Australian states.    And two really remote parts of the United States –  which I didn’t show on the chart, partly because they were settled so much later (not admitted as US states until 1959) –  are Hawaii and Alaska.  Both have had faster population growth than New Zealand over the last 100 years (although between them only around 2 million people in total): in Alaska’s case no doubt the oil resources attracted people (Alaska also has among the highest GDP per capita of any state).

But over that hundred years –  or any shorter period you like to name really –  New Zealand (like Wales, Northern Ireland, Tasmania, Nebraska, or Newfoundland) has had no big natural resource discoveries, or asymmetric productivity shocks specifically favouring our location.   Like those places, we’ve only had the skills of our people and the instititutions we’ve built or inherited (in the case of this group a fairly-common Anglo set) to make the most of, and to overcome what appear to be the resurgent disadvantages and costs of distance/remoteness.  Our birth rates won’t have been much different over long periods, and New Zealand like all these places –  the Shetlands most extremely of the places on my chart –  have seen outflows of our own people.  The big difference here is immigration policy, which has actively sought to substantially boost the population.

Try a thought experiment.  Say the New Zealand and Australian governments had simply combined their respective immigration policies over the last 100 years or so  (eg if New Zealand was offering 45000 residence approvals per annum and Australia 200000 –  similar to the current policies –  the two countries simply said we’ll issue 245000 residence visas and the arrivals can go wherever they like), what would have happened.   By construction, the total population of the two countries would have been pretty much the same as what we actually see (5.4 million in 1910, and about 29 million now) but what would the distribution look like?     We know that in Australia –  given the same choice –  the remote region with a mild climate and no big new natural resources (Tasmania) saw much weaker population growth than the rest of Australia.   Why wouldn’t it be the case that New Zealand would have experienced much the same phenomenon?    At Tasmania’s population growth rate for the last 100 years we might now have a population of around 2.5 million.   After all, for almost 50 years now native New Zealanders have (net) been relocating to (the non-Tasmania) bits of Australia, so why –  given the free choice –  wouldn’t the migrants –  facing a free choice at the point of approval –  have done so too?

Would we have been better off?    The migrants who went to Australia instead presumably would have been –  both judged from revealed preference (they made the choice) and that incomes in Australia are higher than those here.  I’d argue that the smaller number of New Zealanders probably would have been economically better off as well.  Natural resources are still a huge part of the economic opportunities in these remote islands –  perhaps still 85 per cent of our exports –  and those limited resources would be spread across a considerably smaller number of people.  For those who simply prefer “more people” for its own sake, perhaps they’d have been worse off –  but then such people could have self-selected for Sydney or Melbourne (as Tasmanians of a similar ilk do, or people in Newfoundland who wanted to be part of something big self-select for Toronto).

I’m not suggesting something conclusive here, just that people pause for thought, and reflect on what questions the experiences.    For a remote place we aren’t particularly lightly settled, and especially not as a remote place without the sort of abundant natural resources of –  say –  a West Australia.  We’ve had no distinctive favourable productivity shocks, and we’ve long lost any claim to be the richest (per capita) country on earth.  It is no surprise that some people want to move here –  plenty would want to move to Nebraska if it had its own immigration policy like ours – but there isn’t much evidence, from experience of other remote regions, to suggest we benefit from them doing so.   Without big new natural resource discoveries, remote places –  regions, territories  – in the advanced world  tend to have quite weak population growth rates.  It isn’t obvious why in New Zealand we should let immigration policy up-end that otherwise natural outcome.

Savings rates in international context

In putting together yesterday’s post, I stumbled on something I hadn’t noticed previously.  In yesterday’s post I showed only New Zealand saving rates –  in particular, net national savings (ie savings of New Zealand resident entities, after allowing for depreciation) as a share of net national income.  The net national savings rate has picked up quite a bit in the last few years, although not to historically exceptional levels.

But here are the New Zealand and Australian net national savings rates plotted on the same chart.

net nat savings nz and aus

For the last couple of years, the net savings rate of New Zealanders has been higher than that of Australians.  I wouldn’t want to make very much of a couple of years data, and over, say, the last 25 years, the average savings rate of New Zealanders has still been a little lower than that of Australians.  But even that average gap has been much smaller over that period than over, say, the previous 20 years.

It isn’t a story you would typically hear from those who argue that savings behaviour is at the heart of New Zealand’s economic challenges.   Some will point to the compulsory private savings system now in place in Australia (phased in from 1992).  There is no easy way of assessing the counterfactual –  what if the system had never been introduced? –  but there is no obvious sign that the system has led to a lift in national savings rates in Australia, whether absolutely or relative to New Zealand.  Others will (rightly) highlight the big tax changes implemented here in the late 1980s which materially increased the tax burden on income earned by savers (in a way pretty inconsistent with the recommendations of a lot of economic theory).  I don’t think those changes were appropriate, or even fair, and would favour a less onerous regime.  But in the decades since the changes were made, our savings rates have been closer to those in Australia (where a less onerous tax regime applies as well) than they were in the earlier decades.

One policy change that may have made a difference is overall fiscal policy: the improvement in New Zealand’s overall fiscal position (reduction in general government debt) has been larger than that in Australia (largely reflecting the fact that we were in a bigger fiscal hole 25 or 30 years ago).   Higher average rates of public saving may have lifted average national savings rates to some extent.

What about other countries.  In a paper I wrote some years ago for a Reserve Bank/Treasury conference, I illustrated that over time New Zealand’s savings rate hadn’t been much different from that of some other Anglo countries.  Here is a more recent version of that sort of chart.

net nat savings anglo

New Zealand’s national savings rates have typically been below those in the OECD group of advanced countries as a whole (and perhaps particularly some of the more economically successful of those countries –  whether by chance, cause, or effect).   But even on that score the last few years look a little different.   This chart compares New Zealand against the median of the 22 OECD countries for which there is consistent data over the full period.

net national savings oecd

It is quite a striking change, and the reasons aren’t at all clear (see yesterday’s post on the puzzles around the New Zealand data).  Perhaps in time some of the rise in the New Zealand savings rate will end up being revised away.  Perhaps the lift will prove real, but temporary (as, say, happened for a few years around 2000). But if not, the apparent change in the relationship between our savings rate and those in other advanced countries should help keep our real interest rates –  and our real exchange rate –  a bit lower than otherwise.  If sustained, that would be expected to lift our economic prospects a bit, all else equal.

But it is worth remembering that, all else equal, a country with materially faster population growth than its peers should typically expect to have a higher national savings rate over time than its peers.   All else is never equal of course, but New Zealand continues to have a population growth rate well above that of the median advanced country.