Fortune for the favoured

The coverage in recent days of the first (branded) KiwiBuild houses –  one purchased by a young well-travelled couple, no children, she just graduating as a doctor, he something in marketing –  brought to mind the books I’d had sitting on a pile for ages intended for a post about the first Labour government’s state house building programme (we used to be told that the KiwiBuild vision was modelled on the earlier programme).

As for the KiwiBuild houses themselves, even the purchasers are unashamed in talking up their good fortune (at the expense of the taxpayer).

The owners of one of the new homes have compared their purchase to winning Lotto.

Couple Derryn Jayne and Fletcher Ross paid $649,000 for their four bedroom home, which they said is great value for money, compared to prices elsewhere in Auckland.

They had given up hope of finding a house on the open market after a year-long search.

Which, frankly, is a bit odd.  Of course house prices in Auckland –  and much of the rest of the country – are obscene, but even in Auckland you can pick up a first house for well under $649000.   I googled houses for sale in Clendon Park for example.  It mightn’t be a suburb entirely to everyone’s taste but my in-laws lived there until a decade or so ago.  And it is a first house we are talking about, where it isn’t obvious why the taxpayer should be assisting a lucky young couple into a brand-new four bedroom house.

Defenders of the government are quoted in the media.  There is an article in this morning’s Dominion-Post (which I can’t find online) in which, for example, Shamubeel Eaqub notes that

…the eligibility criteria were broad. “People also may not know how challenging it is to be a doctor without a private practice and with large debts.  I have heard stories of young doctors leaving places like Queenstown because they couldn’t see a way of ever owning a home there.”

Another person quoted in the article observes “even doctors have to start somewhere”.

No doubt. And no doubt it is quite tough for many people starting out, even professionally-qualified couples.  But lets just think for a moment about people rather further down the income ladder, typically without the sort of future income advancement opportunities that (many) doctors have.  Teachers and nurses for example, or motor mechanics, or retail managers, hairdressers, and so on.   If we “need” special lotteries to help favoured young professional couples into homes, how are people further down the income scale ever supposed to manage?  Ah, but, says the minister Phil Twyford, that is to miss the point: apparently KiwiBuild isn’t supposed to help low-income families, even though if there was ever a case for direct state intervention in the market it would surely be for those people rather further down the income scale; the sorts of people who not many decades ago could reasonably have expected to buy a basic first house.

An Auckland University economist (Ryan Greenaway-McGreevy) is also quoted in the article.  He argues, sensibly enough, that “it shouldn’t be a surprise that a new doctor could qualify. ‘Perhaps it speaks to how unffordable housing has become.'”

Which is, surely, the point.  Most people further down the income scale, and especially in Auckland, simply can’t afford to purchase a house at all, at least not without ruinously overburdening themselves. The economist goes on to suggest that KiwiBuild will lower prices for everyone.   Even if that were true, it still wouldn’t justify a lottery in which the favoured few pick up a house below market price at the expense of the taxpayer.  But, of course, there is little sign that it will be true –  many of the early KiwiBuild projects are just rebadging construction that was already going to happen, and over time there is no clear reason as to why we should not expect any specific KiwiBuild construction not to displace private sector activity that would otherwise have taken place.

And surely the evidence against that optimistic hypothesis is in the market prices.   If people really believed that whatever the government was doing –  KiwiBuild or whatever –  was going to lower house and urban land prices over time, then those prices would be dropping already, perhaps quite steeply.  Sure, Auckland prices seem to have gone sideways over the last 18 months or so –  after a huge surge over the previous few years –  but those in many other urban areas are still rising (in both real and nominal terms).   Over the last five years, the REINZ numbers now indicate that Auckland and non-Auckland house prices have risen at around the same rate (on average 8 to 9 per cent per annum).  CPI inflation is, by contrast, averaging under 2 per cent.   When nothing has been done to fix the land market, and most KiwiBuild construction is likely to simply displace private sector construction, none of that should be very surprising.  KiwiBuild is producing photo-ops, and Lotto-like wins for the favoured (and lucky) middle class few, but it is no fix  –  not even any material part of a fix –  to the dysfunctional housing market successive governments have delivered us.

And what of the first Labour government’s state-housing programme?  Actually, it didn’t do a lot for people at the very bottom either.  In the mid 1930s there was much talk of “urban slums”.   Ben Schrader’s history of state housing in New Zealand has a nice quote from a newspaper editorial written just a couple of weeks after the 1935 election, contrasting the newly built National War Memorial Carillion tower with the surrounding neighbourhood (in Wellington’s Mt Cook)

“The Tower was built right in the middle of Wellington’s slum area, and a stone’s throw away from it, men, women, and children are making a different kind of sacrifice.  They live  in squalor and dirt, in little shacks lacking even the ordinary comforts of existence.”

But the state house programme wasn’t for these people. They couldn’t afford the rents.  In fact, as Schrader records, one contemporary critic calculated that a worker would have to earn 20 per cent above “the weekly living wage (the amount the Arbitration Court determined was necessary to support a familiy in “reasonable comfort’) to be able to afford the rent on a state house.    In its defence, Labour argued that people moving into state houses would free up other houses for poorer people –   and in those immediate post-Depression years without the sort of tight land use controls we have today perhaps there was even something to that story (but I’m not aware of any evidence to confirm that conclusion).  But it certainly wasn’t a programme targeted to help those at the bottom (indeed, when later governments offered to sell state house to sitting tenants there was often a material wealth transfer to the fortunate minority).   And for the first decade or more Maori was also explicitly excluded.  Again from Schrader:

“This thinking [around separatism] was challenged in 1944 after the Department of Native Affairs surveyed Maori housing conditions in the industrial Auckland suburb of Panmure.  It found Maori crowding into tents and shacks made from rusting corrugated iron and discarded packing cases. Cooking was mostly done over open fires and sanitary conditions were primitive. Sobered by this and other similar reports, the government agreed in 1948 to build state houses for Maori.”

As for the photo-ops in an earlier age, everyone is familiar with the picture of Prime Minister Savage helping to carry the dining table into the first state house in Miramar, but Schrader records

“The Fife Lane function was so successful that a coterie of cabinet ministers repeated the furniture-carrying stunt at the opening of the first state house in each of the main cities.”

I wonder how more photos of Jacinda Ardern and Phil Twyford appearing with new KiwiBuild owners there will be?  And how people further down the income scale –  perhaps mostly Labour voters –  will be feeling about their own prospects of ever owning a modest house (not even a four bedroom brand new one) in one of our major cities.  That only seems likely if the government were to tackle the regulatory constraints on our urban land market, and despite the pre-election talk there is still as little sign of that so far as there was action under the previous government.  Very little.

(On a completely different topic, I’d just add my voice to the long list of those seriously troubled by the government’s decision to give residency to an imprisoned Czech convicter of dishonesty, and convicted and imprisoned for drug importing, and not even to be willing to explain why.   Personally, I can’t conceive any circumstances under which I would support giving such a privilege to a person with such a –  very recent – background, the more so when such a person comes from an EU country –  none of them is perfect, but none is Somalia or the People’s Republic of China.  There are plenty of decent and honest people who would like to live here, and we only take so many: why favour the Czech drug smuggler over any of them?   As with the extraordinary exercise of ministerial discretion under the previous government to grant Peter Thiel citizenship, these sorts of cases point to a need for much more openness and accountability.  If you want ministers to exercise personal discretion in your favour, you should expect all the details of your case to be published routinely, so that ministers can be properly held to account.  It simply isn’t good enough to have the Prime Minister tell us we should “read between the lines” and then refuse to go further.   Why would we be inclined to believe that ministerial discretion is being appropriately exercised in this case –  and that a drug smuggler with gang associations should be free to stay among us – when the track record (under both parties) inspires so little confidence?

I noted that there are plenty of decent and honest people who would be keen to live in New Zealand.  Stuff’s new article on the utter failure of the Immigration New Zealand arm of MBIE to take seriously the scams suggests that many of those who do get to live here probaby do so at the expense of the honest and decent ones.

[head of immigration advisory agency Carmeto] Malkiat believed most visa applications contained some level of exaggeration and misrepresentation, and significant number involved substantial corruption. There was now a generational pattern of exploited migrants in turn exploiting the next wave to arrive, he said.

“The reality is that if all immigration advisers speak up, 80 to 90 per cent of all applications are wrong, and should not be approved – it is a massive number,” he said.

“Most of the industry exists because of fraud. If there was no fraud, many advisers and lawyers would leave the industry [because they wouldn’t be needed].”

It was clear Immigration NZ was not equipped to deal with the widespread fraud that it was encountering, Malkiat said.

Former immigration minister Tuariki Delamere, now an immigration adviser himself, said he too had sent tip-offs to INZ but seen no action. “I sympathise with that adviser [Malkiat] doing that. Senior [INZ] staff have said to me they are understaffed and there are so many [cases to investigate]. I sympathise with them … but I am happy you are exposing it because the only way you stop [these frauds] is by prosecuting them and publicising it.”

Lawyer Alastair McClymont said he “used to tell INZ about them all the time as well – but nothing ever happened”.

Immigration New Zealand declined to comment on the complaints about its service.

That final line says it all really.  It is a disgrace.  Whether through these immigration scams or the political donations process, Labour and National in turn preside over the increasing corruption of the New Zealand system.    And yet their inaction –  and silence –  suggests they just don’t care. )


A couple of (RBA) housing finance charts

Comment on the Governor’s sprawling speech “Geopolitics, New Zealand and the Winds of Change” (curiously, a speech in which “geopolitics” didn’t appear at all) is held over until tomorrow.

But I was reading an interesting speech from a senior RBA official, Assistant Governor Michele Bullock, which happened to include this chart.

bullock

It captures a couple of important points relevant to thinking about household debt.   You quite often see comment about how high the level of household debt is in New Zealand.  But Bullock’s chart illustrates a pretty straightforward point: when almost all your housing stock is owned by households (whether owner-occupiers or investors) you’d expect that, all else equal, household debt relative to household income (or GDP for that matter) would be higher than in countries where a larger share of housing stock is owned by other sectors.  Of the countries Bullock shows data for, New Zealand and Australia have the highest share of the housing stock owned by the household sector.  New Zealand is very close to the median country in this sample, notwithstanding the high share of houses owned by households.

The chart highlights another important point sometimes lost sight of in international comparisons (but which our own Reserve Bank sometimes acknowledges).  In some countries, interest on an owner-occupied mortgage is tax deductible.  That might, all else equal, encourage household to take on more net debt (cost of borrowing and bringing forward consumption is lower), but it certainly tends to encourage people not to rush to pay off the mortgage even as they may be accumulating financial assets (and the tax treatment of some financial assets is also often quite favourable relative to, say, the situation in New Zealand).   And so Sweden, Switzerland, Denmark and Norway have much more gross household debt outstanding –  but not necessarily any more financial system risk –  than countries with similar household sector ownership of the housing stock but a different tax treatment.   (The US is a bit of an outlier here, and from the look of it the data may not be fully comparable.)

Of course, what Bullock doesn’t highlight in her chart is two things:

  • Australia and New Zealand have high house price to income ratios by international standards, which tends to boost the amount of household debt required to accommodate such prices, and
  • Australia’s compulsory private superannuation system will, all else equal, tend to mean that Australian households will more often have substantial financial assets tied up in superannuation schemes while at the same time having large outstanding mortgage debt.  (Kiwisaver, more recent and on a smaller scale, will now be tending to have the same sort of effect in New Zealand.)

There was one other interesting chart in the Bullock speech.

bullock 2

For all the talk about households taking on more and more debt, the median advanced country’s ratio of household debt to income hasn’t changed materially in a decade, despite the fall in global interest rates.  Of course, all else equal, if interest rates had been higher debt would have been lower, but so would real and nominal GDP, asset prices, inflation (but, pace Lars Svensson, debt to GDP ratios might not have been much lower)…..and unemployment would have been higher.   All else is never equal, and it is important to remember that interest rates are low for a reason (or set of reasons) grounded in the fundamentals of the really economy, factors which central bankers and banking regulators have little influence over.

Building work

Yesterday Statistics New Zealand released the quarterly data on building work put in place. The release included this chart.

building work

SNZ like this sorts of chart, which tend to reinforce the relentlessly upbeat tone favoured by the department.

But most economic series reach new highs quite frequently, even volume measures.  Real GDP, for example, is higher this year than it has ever been before, and almost all future years will be higher again.  Knowing that doesn’t tell one much.

For a start, one usually wants to transform these series into per capita measures, particularly in a country whose population is growing relatively rapidly.  New Zealand’s population, for example, has increased by just over 25 per cent since 2000, when that SNZ chart starts.

Here is the same data, over a longer run of time, in per capita terms.

BWPIP 1

In per capita terms, the volume of building work has been (a) pretty flat, and if anything falling back slightly, for the last couple of years, and (b) around the same level as the previous peaks (around 2004/05).

But the demand for new buildings isn’t just related to the level of the population, but to the increase in the population (with a flat population, most of the building work occurring would just be replacing the effects of depreciation of the stock).  And population increase is both high and quite volatile in New Zealand, mostly because of the effects of immigration policy and New Zealand emigration.

BWPIP 2

Just looking at the volume of building activity relative to population growth produces this chart.

BWPIP 3 
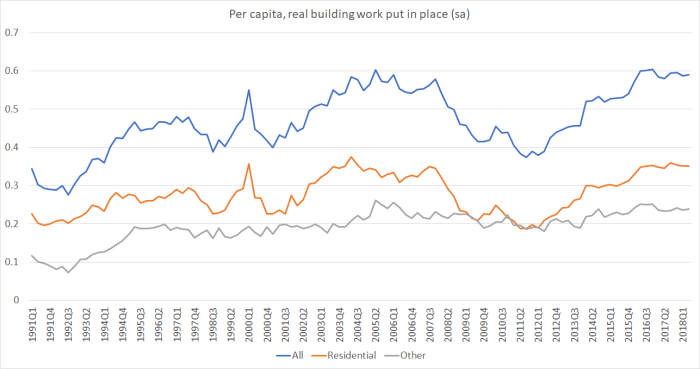
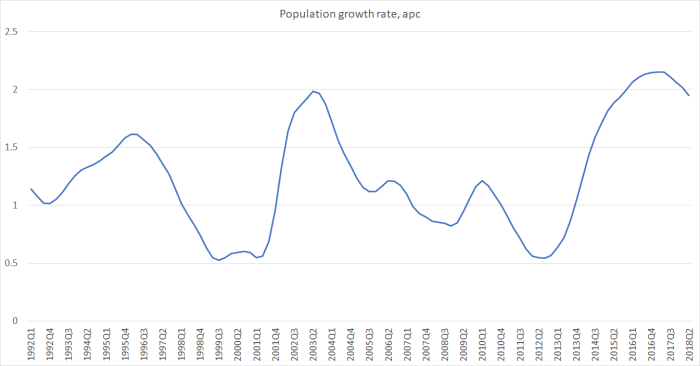
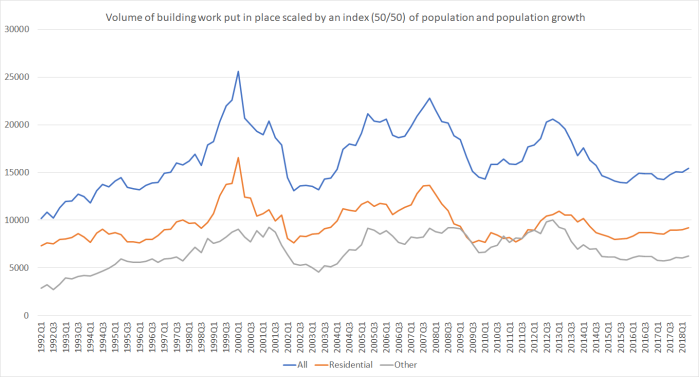
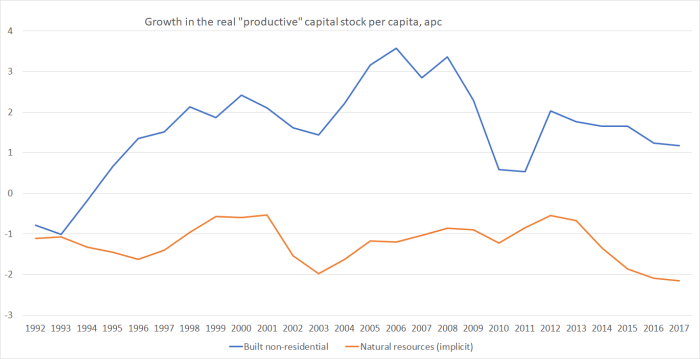
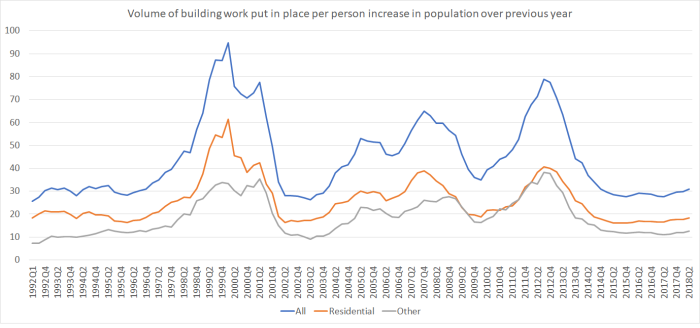
The peaks on this measure happen when population growth is at its cyclical troughs –  unsurprisingly, since the normal base level of replacement and improvement work is still going on.

So what if we, somewhat arbitrarily, assign equal weights to the level of the population (influencing replacement/improvement demand) and the growth in the population (key driver of the demand to increase the total stock of buildings).  Doing that produced this chart.

BWpip 4.png

Two of the peaks (around 1999 and 2012) are still when population growth was at its lowest, but there is also a sustained period of strength through 2004 to 2007, a period when population growth was still quite high, but slowing.  House (and commercial property) prices were, of course, still rising.

What, if anything, to make of the current situation?

I’ve been sceptical for some time of the claim that there was insufficient building going on.  If that were so –  demand was persistently and substantially exceeding supply –  we would see prices rising strongly.  At least in Auckland that isn’t so now. On my telling, high land prices –  mostly reflecting regulatory and related constraints – have choked off large amounts of effective demand.  There are plenty of people who would like more houses at Houston or Atlanta prices, but not at Auckland (or Wellington or most other places in New Zealand) prices.  I’d consume more scallops (eg) at half the price too.  There are few/no signs I’ve seen that land prices are falling, so it is difficult to envisage much more effective demand emerging.  Unless developers themselves are making super-profits, why would the rate of new supply increase?

Having said that, population growth does appear to be beginning to slow.  If that continues and if building activity were to remain around the same levels as the last couple of years, then measures calculated relative to population growth would increase.  That seems to have happened over 2004 to 2007, so perhaps it can happen again.  But the economic climate seems less propitious now than it was then (credit conditions were looser, incomes were growing more rapidly, the terms of trade were beginning to lift, and so on).  And even then, it wasn’t enough to sustainably lower the level of house prices –  notwithstanding the temporary fall in the 2008/09 recession –  which isn’t surprising, as the core problem (land and associated infrastructure financing) had not been seriously addressed.

Another Orr interview

The Governor of the Reserve Bank was interviewed over the weekend on Newshub Nation. Perhaps even fewer people than usual watched the programme, since it was  on over a holiday weekend, but I saw a few comments –  public and private –  suggesting it was a rather odd performance so I finally had a look myself.  I had to agree with the commenters.

There were three broad topics covered in the interview:

  • infrastructure finance,
  • bank conduct issues, and
  • mortgage lending.

Of those three topics, only the third is really within the ambit of the Governor’s responsibilities.

On infrastructure finance, you’ll recall that a few weeks ago the Governor weighed in on this issue, claiming to be speaking both in his former capacity of head of the New Zealand Superannuation Fund (NZSF) and in his current role as Governor.  He was venting about his frustration that NZSF had not been able to invest in infrastructure projects in Christchurch after the earthquakes.

“My single biggest frustration when I was at the Super Fund was the inability to be able to invest in New Zealand infrastructure.

“We never got to spend a single penny in Christchurch. I stopped going down. It became too hard,” Orr said.

“I went down, even once CERA [the Canterbury Earthquake Recovery Authority] was formed, and the person said ‘it’s great to see you here, Minister [Gerry] Brownlee is very pleased you’re here. Now, tell me again which KiwiSaver fund you’re from’.”

Understandably, that upset Gerry Brownlee and prompted a rare criticism of a central bank Governor from the Leader of the Opposition and a suggestion that the Governor should stick to his knitting –  the core stuff he now has legal responsibility for.

Orr now claims he wasn’t being specifically critical of the Christchurch situation –  although see the quote – and that he was just making a general point, one he is not defensive about at all.  There isn’t, in his view, enough “outside capital” being brought into infrastructure development, here and abroad.

His mandate, so he claimed in this latest interview, was his obligation to contribute to “maximum sustainable employment” –  the words recently added to the Policy Targets Agreement governing the conduct of monetary policy.   As I’ve pointed out recently, this argument just doesn’t stack up: the words in the PTA are about the conduct of monetary policy (interest rates and all that) not a licence for the Governor to get on his bully pulpit and start lecturing us –  politicians and citizens –  about all manner of other policies he happens to think might be a good idea.   It is a doubly flawed argument because even the new monetary policy mandate is about employment –  not productivity or GDP per capita –  and the Governor will know very well that you can have a poor fully-employed economy or a prosperous fully-employed economy.   Infrastructure finance –  even well done –  has almost nothing to do with sustainable levels of employment.

In the latest interview, he was asked (very first question) about the recent bid by NZSF to invest in light rail in Auckland.  Instead of gently reminding the interviewer that such things aren’t his responsibility any longer, the Governor weighed in.  Any opportunity for outside capital should be welcomed, we were told.  The Governor went on to lament the “hang-ups” people have –  “people”, we were told, were the problem here, “getting in the way” of sensible solutions.  The Governor complained that all this leads to infrastructure being financed by debt or taxes, when it really should –  in his view –  be financed by equity (perhaps he didn’t notice that the NZSF itself was, and is, funded by debt and taxes, or that he has previously called for governments to take on more debt).  The Governor complained about politicians being scared of tolls, and argued that they “need to get over it”.     Challenged as to whether these were not political debates, the Governor argued that he was trying to get these out of the political debate –  as if mere citizens, the dread “people”, might not reasonably have a view not only on what projects should be done, but how they should be owned/financed.   Wrapping up that particular segment of the interview, the Governor opined that the wider economic benefits of light rail were “incredibly important” to maximising sustainable employment”.

It all remains, as I put it some weeks ago, very unwise and quite inappropriate.  Even if his views had merit (which, I would argue, they mostly don’t), these are issues which have nothing to do with the Reserve Bank (where the Governor wields a great deal of barely trammelled power).  As I put it in an earlier post

The Governor holds an important public office, in which he wields (singlehandedly at present) enormous power in a limited range of areas.  It really matters –  if we care at all about avoiding the politicisation of all our institutions –  that officials like the Governor (or the Police Commissioner, the Chief Justice, the Ombudsman or whoever) are regarded as trustworthy, and not believed to be using the specific platform they’ve been afforded to advance personal agendas in areas miles outside the mandate Parliament has given them.   We don’t want a climate in which only partisan hacks have any confidence in officeholders, and only then when their side got to appoint the particular officeholder.  And that is the path Adrian Orr seems –  no doubt unintentionally – to be taking us down. 

The arrogance of it all is pretty breathtaking too –  we “the people” are the problem.  Officials and politicians sometimes say things like that in private (feeling that they really deserve a better class of “people”), but generally not in public.  And the Governor seems to have no conception of the way in which genuine outside capital in a private project in a competitive industry, where all the gains and losses accrue to the private providers, differs from the public-private partnerships he waxes lyrical about (even while championing what would, at best, have been only public-public partnerships, since NZSF is just another pot of government money).    Contracting, in ways that both preserves the public interest and ensures continuity of high quality service, has proved hellishly difficult.   Providers of outside capital in PPPs –  whether state entities of the sort Orr has championed or private ones –  don’t care at all about the fundamental merits of a particular project, so long as they can write a contract that more or less guarantees returns to them.  In such a world, easy access to money can be a recipe for a smoother road to more really bad projects being done –  anyone recall the synthetic petrol plant, as an example of outside capital and guaranteed rates of return?

I’m not suggesting the Governor is totally wrong –  I’m pretty sympathetic to congestion pricing on city roads for example –  but in his official capacity, it is none of his business.    There is a vacancy coming up for Secretary to the Treasury; perhaps could apply for that position?  Or he could run for Parliament –  though probably not with that dismissive attitude to “the people” –  or retire and get a newspaper column.  But it is nothing to do with the Reserve Bank, and he jeopardises the Bank’s position –  both the ability to do its day job with general support, and increasing the chances of future partisan hack appointments –  if he goes on this way.

And what about his claim that infrastructure finance is really core to what the Reserve Bank does?  There was this from his public statement a couple of weeks ago

I have spoken about specific issues recently because increased infrastructure investment opportunities provide sound investment choices, risk diversification for financing goods and services, and improves maximum sustainable employment by relieving capacity constraints.

These are all core components of the Reserve Bank’s role and something we often speak about in our Financial Stability Reports.

In the last month, we’ve had a Monetary Policy Statement and a Financial Stability Report.  There were no mentions at all of infrastructure in the Monetary Policy Statement and, once again, a single mention in the Financial Stability Report –  a brief reference to “market infrastructure”.  The Governor just seems to be making it up on the fly, when these issues are no more part of his official brief than most other areas of government policy are.  

The second strand of the weekend interview had to do the ongoing banking conduct investigation  –  in which the Reserve Bank and the FMA demand banks and insurers prove their innocence, on points which (at least in the Reserve Bank’s case) are really not the government agency’s business.  There wasn’t much new in this part of the interview, apart from the somewhat surprising claim that the Reserve Bank has a very good insight into banks and insurers (which makes you wonder how CBL failed, or Westpac ended up using unapproved capital models for years, or how a few weeks ago the Governor could have been convinced there were no problems here, but now leaves open the possibility that he could recommend a Royal Commission).

As the Governor ran through his checklist of issues, it was more and more clear how little any of this had to do with the Reserve Bank’s statutory responsibilities.  He was concerned, for example, as to whether banks were “customer-focused”.  Personally, I rather hope that, as private businesses, they are shareholder-focused, working first in the interests of the owners.   Now, working in the interests of the owners does not preclude caring a great deal about good customer service (whether in banking or any other sector) but it shouldn’t be the prime goal.  And whether or not banks offer good customer service has very little to do with the Reserve Bank’s statutory focus on the soundness and efficiency of the financial system.    Perhaps we all wish it did, but some friendly customer-focused banks fail, and most flinty hardnosed one don’t, and vice versa.  There is no particular connection.

Similarly, the Governor was concerned about remediation when customers have problems with their banks.  Perhaps there is a role for some agency of government to take an interest (perhaps…..) but there is no obvious connection to the Reserve Bank’s prudential regulatory functions.  Over the years I’ve had plenty more complaints about my supermarket than about my bank, but (fortunately) no one seems to think governments should regulate customer service in supermarkets.

The Governor has found a partial defender in Gareth Vaughan at interest.co.nz.  But as Vaughan notes, it hasn’t typically been the Reserve Bank way

In 2015 when Australian authorities were probing high credit card interest rates, my colleague Jenée Tibshraeny tried to find someone, anyone, in a position of power in New Zealand to take an interest in credit card interest rates here that were at similar levels to Australia. This is what a Reserve Bank spokesman told Jenée;

“The Reserve Bank of New Zealand regulates banks, insurers, and non-bank deposit takers (NBDTs) at a systemic level – i.e. to make sure the financial system remains sound.”

“We don’t regulate from an individual customer protection perspective and don’t have comment to offer about pricing of products and services offered by banks, insurers and NBDTs,” a Reserve Bank spokesman said in 2015.

That stance is entirely consistent with the legislation the Reserve Bank operates under.  Vaughan concludes

Personally I welcome the Reserve Bank thinking of consumers, be they borrowers, savers or insurance policyholders. By taking an interest in consumer outcomes Orr is humanising the Reserve Bank, and making it more relevant to the general public.

However, if this is the path the Reserve Bank wants to go down, and has government support to do so, then perhaps phase 2 of the Government’s Reserve Bank Act review is a good opportunity to enshrine this more consumer outcomes focused role into the Reserve Bank Act. The terms of reference for Phase 2 are due to be published during June.

In a sense, that is the point.   Responsibilities of government agencies are something for Parliament –  the pesky “people” and their representatives again –  to assign, not for individual officials to grab.  I happen to disagree with Vaughan here –  between the FMA and generic consumer protection law, there is no obvious gap for the Reserve Bank –  but it should be a matter for Parliament.

It remains hard not to conclude that Orr is driving this populist bandwagon for two reasons:

  • to avoid letting the FMA take the limelight (the Reserve Bank has never been keen to play second fiddle to the FMA, especially on anything affecting banks) and
  • to distract attention from the Reserve Bank’s own poor performance as a prudential regulator, encapsulated in the recent scathing feedback in the New Zealand Initiative report.

He seems to have been remarkably successful so far – journalists seem to have been so pleasantly surprised by on-the-record media access to the Governor that they don’t bother asking the hard questions, and the Governor gets to portray himself as some sort of tribune of the abused masses (with or without evidence).

Personally, I find the sort of concerns outlined in today’s Australian about the Royal Commission itself , or concerns about the potential for these show trials to reduce access to credit, including (in particular) for small businesses, ones our officials or politicians might take rather more seriously.  But, probably, feel-good rhetoric is more satisfying in the short-term.

The final part of the Governor’s interview was about mortgage lending.  It wasn’t impressive.  The Governor declared that “we’re scared” about the high debt to income ratios evident among households with mortgages, but then in the next breath stressed that banks were very well capitalised and highly liquid etc.     Those two observations are simply inconsistent: if the Reserve Bank really has grounds to be scared (a) bad outcomes should be showing up in their stress tests (which they don’t) and (b) the Bank should be articulating a concern that banks are insufficiently capitalised and raising capital requirements further.  And it isn’t clear how the Governor thinks that, in a regulatory climate in which land prices are driven artificially high, ordinary people would be able to buy a house without a very high initial debt to income ratio.  But this seems to have become an evidence and argument-free zone, in favour of emoting about the “high debt” (not, as I noted last week, much higher relative to income than it was a decade ago).

The final question in the entire interview was about whether loans for Kiwibuild houses should be exempt from the LVR restrictions.  The Governor’s initial response was that he didn’t know, and couldn’t answer.  But then, pushed a little further, he expressed a view that such loans should be exempt……..they were, after all, about adding supply, and doing it quickly, and helping low income people into homes who might not otherwise be able to manage it.

Quite what was going on there wasn’t very clear.  There is already an exemption for people purchasing new houses (and any debt developers take on in the construction phase isn’t covered by LVR restrictions anyway).

The new dwelling construction exemption applies to most residential mortgage lending to finance the construction of a new residential property.

The construction loan should either be
(1) for a property where the borrower has made a financial and legal commitment to buy in the form of a purchase contract with the builder, prior to the property being built or at an early stage in construction. This could be traditional ‘construction lending’ where the loan is disbursed in staged payments, or it could be a loan to finance the purchase of a property, which will be settled (in one payment) once the build is complete.

(2) For a newly-built entire dwelling completed less than six months before the mortgage application. The dwelling must be purchased from the original developer (the contract to buy at completion can be agreed while the building is still being constructed).

This exemption didn’t exist when LVR were first rushed in by the previous Governor, but pretty quickly industry and political pressure built up and the Reserve Bank amended the policy.  In doing so, they revealed the fundamental incoherence of the LVR framework:  the Reserve Bank has always claimed that it is about protecting financial stability and reducing (their view) of excess risk in bank mortgage books.  And yet, lending on new properties –  all else equal – is riskier than lending on existing houses.  Existing houses are, for one thing, finished.  They are also in areas that have been occupied for some time.  By contrast, new houses –  especially in new subdivisions –  can be left high and dry when and if the property turns, or the economy turns down.  Think of the pictures of abandoned subdivisions on the outskirts of Dublin, or of some US cities in the last downturn.

And the Governor’s, apparently off the cuff, suggestion that credit restrictions should be easier for low income people who might not otherwise be able to get into a house, was distressingly reminiscent of the US policies –  political and bureaucratic – in the decade before the US crisis, which ended badly (for banks, and for many borrowers).   It is a recipe for encouraging banks –  supposed to be “customer-focused” in the Governor’s view –  to be more ready to lend to people relatively less able to support debt.  It is, frankly, irresponsible.   (And all this is before one even gets to questions about the extent to which Kiwibuild will simply crowd out other construction –  the Bank’s analysis on which they simply refuse to release, despite having opined on the issue in past MPSs.)

The quality of policymaking – official and political – in New Zealand has fallen away quite sharply in the last 15 or 20 years.  Sadly, Adrian Orr as Governor increasingly seems at risk of averaging it down further.  All while showing no sign of addressing the problems in his own backyard –  whether as regulator, analyst, or as sponsor.

A decade of real house prices

In their Financial Stability Report the other day, the Reserve Bank suggested that low interest rates are a significant part of the story as to why house prices have risen so much, and are so high. I showed this snippet in an earlier post.

fsr chart 1

Not only was there no sign of any analysis of the reasons why interest rates remain low –  they aren’t just some random variable delivered to us from on high, but arise from the interplay of real economic forces –  but they started their analysis from the trough of the financial crisis and (just to compound things) showed asset prices in nominal terms.

The Reserve Bank indicated that they were using the OECD house price index, so I had a look at that data.  Conveniently, the OECD presents the data in real terms, and they provide individual country data for most member states.

In this chart, I’ve shown three lines –  each starting from 2007q4, just prior to the international (and domestic) downturn beginning.   It wouldn’t materially change the chart if I started a year earlier (the peak in US house prices was 2006q4.   Here I’m showing real house prices for New Zealand, for the median of the 30 or so OECD countries for which there is complete data, and the OECD total series (the real equivalent of the line the Reserve Bank showed).

real house prices OECD

Over the full ten year period, real house prices in the advanced world as a whole have barely changed, while in New Zealand real house prices are now 40 per cent higher than they were at the previous peak (having already risen more than in the typical OECD country in the previous surge).   Not one of these countries –  well, there is a possible exception of Turkey, in the midst of a currency crisis at present –  has interest rates anywhere as high as they were 10 years earlier.

In this chart, I’ve just shown the individual country data.

real OECD house prices

New Zealand’s experience isn’t uniquely bad by any means, but it isn’t representative either.  It didn’t have to be this way, but it was a predictably awful outcome once one knew that land-use laws weren’t being materially altered, and the sheer scale of the population pressures government policy has contributed to.    The combination has been toxic, especially for young people who were already struggling to get into the market.

It isn’t even some sign of general success either.  Your eye might go to Greece and Spain at the far left of the chart.  But other countries to the left of us include, for example, the group of central and eastern European countries that I’ve written about previously, who’ve been catching-up and achieving consistently better productivity growth than New Zealand (the Czech Republic and Poland aren’t on the chart because the data for each doesn’t cover quite the full period –  but on the data we have both would also be well to the left of New Zealand).   Our house price debacle has been a disaster all of our own –  well, our central and local politicians’ –  making.  It just didn’t need to be that way.


There is abundant land

Sometimes –  well, quite often actually –  I’m tempted to despair of the elected leadership in this country.  For decades they’ve failed to reverse –  barely even stopped –  our decline in the international league tables, when productivity growth is the only secure foundation for sustained improvements in material living standards.  They’ve presided over an economy that has mostly been inward-looking –  remember, foreign trade shares have been shrinking, as has the relative size of the tradables sector of the economy –  when increased international trade is a typically a key marker of a successful economy.  Business investment has been weak, for decades.  And they’ve managed to preside over a situation in which, in a land-rich country, we have some of the most unaffordable houses in the advanced world.    And still, apparently, they and their advisers think they know best.    And they wonder why life is tough for altogether many people, as they run around proposing band-aids, while never sorting out the fundamental problems.  Arguably, in fact, they are simply making them worse.

The prompt (the latest one) for that paragraph was an article that appeared on Stuff a couple of days ago (and made it to the hardcopy Dominion-Post this morning).   In it, we read

Wellington region’s population, including the Hutt Valley and Porirua, will increase from 413,400 to 459,200 over the next 25 years, according to Statistics New Zealand.

Wellington City Council district plan manager John McSweeney​ said there was about 290 hectares of greenfield land left to develop in the region – enough for about 3500 houses, based on existing residential subdivision plans which allows up to 12 houses per hectare.

McSweeney said it was likely that the council would have to encourage developers to build more houses closer together.

When I checked, I found that Wellington City covers an area of 29024 hectares.  And yet the Wellington City Council’s (WCC) planning pooh-bah claims there is a mere 290 hectares of land left to develop –  not just in Wellington City, but in the entire region.

This is how much land is in each of the five local authority areas that make up greater Wellington.

Wellington City                         29024 hectares

Hutt City                                     37664 hectares

Upper Hutt                                 53992 hectares

Porirua                                       18251 hectares

Kapiti                                          73148 hectares

Wellington City itself has more than 40 per cent of the population of the greater Wellington region, less than 15 per cent of the land, and yet –  check out the map at this link (and especially the satellite image https://satellites.pro/Wellington_map.New_Zealand#-41.286600,174.776000,12) –  less than half of Wellington City land is in built-up area.

There is abundant land.  Visible, in particular, to anyone who ever flies into or out of Wellington.

And if you object that much of the land is quite hilly, well take a look at the existing city.  This is part of the view from my study.

hills of Wgtn

Hills are everywhere.  Die-hard locals (the sort who find plausible Deutsche Bank’s claim that Wellington is the most liveable city in the world –  of whom I’m not one) even claim to like them, but at very least we all live among, or on, them.   And, in among that vast undeveloped area of Wellington City is lots of pretty-flat land –  the Ohariu Valley for example.

The Wellington City bureaucrat, presumably channelling his political masters, decrees that

The council was looking at options in some of the northern suburbs where land could be rezoned from rural to residential, McSweeney said.

That could create enough residential land for another 10 years of housing developments.

When the real question for him, and for Justin Lester and each councillor, should be, why is all of Wellington City not zoned residential (with appropriate requirements on developers regarding infrastructure provision)?

As one my readers notes, the only way that house prices can be where they really should be –  and for a long time were – at around three times median income is when developers can buy rural land at rural land prices (in turn, requiring that there is plenty of competition so that no potential seller can corner the market, holding the only parcels of (lawfully) developable land.    And yet what we see in and around Wellington –  and around so many other cities and towns – is almost the precise opposite.

Thus, there was a story the other day about the sale of 386 hectares of farm land just north of Wellington (in Porirua city).

The land is currently zoned for farming, but is part of the Porirua City Council Northern Growth Structure Plan. In 2016, it had a rateable value of $3m, but has previously been assessed as being worth more than $60m.

It is obscene.  “Value” created by bureaucrats and politicians, at the expense of potential home owners in greater Wellington, in this case apparently accruing to a family that has held the land since the 1960s.

It calls to mind a conference the Reserve Bank and Treasury held a decade or so ago at which a very able senior figure on the Wellington city council staff spoke.  He noted that most of the developable land (ie zoned residential) was owned by perhaps four groups who, of course, managed the release of this land in a drip-fed way, so as not to dampen the price of their land.    There was, of course, no thought to zoning all the land residential, or even applying land value rating which, at the margin, creates more of an incentive to actually use the land.

Meantime, each new rising generation suffers the heavy burden of trying to get into the housing market, all while bureaucrats and their political masters talk of a “need” to squash people in tighter or live in apartments without gardens etc.

It is 40 years and a few weeks since I first moved to Wellington.  Coming from Auckland as a teenager in 1970s, I still vividly remember the shock I experienced as we drove in Newtown and Berhampore (for those who know the place, think Rintoul St and Adelaide Road) for the first time, on our way through to Island Bay.  Was this the New Zealand equivalant of Coronation St, I wondered even then?   Most of Wellington (city in particular) is pretty densely populated as it is by New Zealand standards, and even the roads are often pretty narrow.  And yet the bureaucrats and politicians want everyone to squash in tighter.  It isn’t how economic development is supposed to work –  space is, after all, a normal good and, in New Zealand, there is no shortage of land.

For once, I’m with a real estate agent, quoted in the original story linked to above.

Bayleys Wellington general manager Grant Henderson said the thousands of sections set to come on market was not enough.

“For Wellington to continue to keep up, it has to keep developing greenfields. It’s crucial we do the developments.”

The latest residential development is earmarked for Plimmerton Farm, which was sold to Upper Hutt developer Malcolm Gillies and his business partner Kevin Melville.

The duo plan to create more than 1500 sections and 60 lifestyle blocks on the site, with some lots expected to hit the market in late 2020.

Up to 100 sites a year would be developed, meaning it would take about 20 years to complete.

By then, the region’s population will have grown by 45,800.

Henderson said there was a lot of residential land yet to be unlocked in Wellington.

“There are huge opportunities, and the sooner we get some supply into the marketplace, the better.”

And Council planners, even if they had the best will in the world –  about choice, and options, and lowering house prices –  still couldn’t tell what would be enough.  That is one of things we have markets for.

Elected councillors do make an appearance in the article

Wellington City Council councillor Andy Foster, who is in charge of urban development, said about 40,000 houses needed to be built in Wellington to cater for population growth over the next 30 years.

This did not include growth in the wider Wellington region, he said.

The council has commissioned research to establish how much space was left to develop and if the city could hold another 40,000 houses, he said.

“Most likely we can’t, and we are very much expecting that. So then we have to say, ‘Well where are they going to go? What do we need to change to accommodate growth?'”

There was a need to densify further. However, it was unclear which parts of the city were best suited for that, Foster said.

“This is going to be a really challenging conversation, and it’s going to be a really big one.”

Or, councillor Foster, you and your colleagues could just give citizens, residents, and potential residents, the choice.  People who want to live more densely should, of course, be free to do so.  Revealed preference –  the way our towns and cities evolve when there is no particular population pressure –  suggests that most would prefer not to, and of those who do end in terraces or apartments many do so simply as a less-unaffordable second-best, there being less land per dwelling in those sorts of developments.

The tragedy is that there is no public revolt against this political and bureaucratic mentality, which undermines communities and renders housing ever-more unaffordable, all in pursuit of some central planner’s vision for the way people should be, more or less, compelled to live.  There is no shortage of land –  and certainly not in Wellington city, or greater Wellington.   Even politicians who seem occasionally to display signs that they know better –  and there have been a few in both National and Labour –  don’t actually do anything about it.   We wouldn’t be having futile debates about Kiwibuild –  or “shortages” of physical houses –  if the land market was deregulated. Instead our so-called leaders –  elected officeholders anyway –  just preside over regimes that, by doing the same thing again and again, can’t but produce much the same dreadful results for a another new generation.  In a few years those will be my kids entering the market, another generation betrayed by our leaders.

Please Mr Orr, could we have some better analysis

In yesterday’s post, I was a bit critical of the relatively superficial analysis in much of the Reserve Bank’s Financial Stability Report.

Here is one example

fsr chart 1

A snippet which seems to contain three problems in just a few lines.  First, the Bank runs their asset price charts from the bottom of the international financial crisis and recession in 2009.  Of course, equity prices have risen strongly since then.  Second,  all these series are shown in nominal terms: in the case of OECD house prices (red line in the second panel) there will have been hardly any increase at all in real prices over the nine years.    And thirdly, they are attempting to argue that low interest rates have been a major causal influence on debt levels and asset prices without (a) looking back at whether trends are more pronounced this decade than they were in the previous –  higher interest rate –  decade (hint: they aren’t) and (b) without giving any apparent consideration to the reasons why interest rates might have been persistently low.  For a central bank, that really is inexcusable sloppiness.

Take household debt, for example.  Here is the Reserve Bank’s chart

FSR chart 2

It is interesting to see the breakdown between households with a mortgage and the all-households number.   Perhaps even more interesting is the snippet they include in the text that “only 8 per cent of households own investment properties, but they account for 40 per cent of housing debt” (although it would be interesting, in turn, to know how that share has changed over, say, the last decade).

But what I’ve always found striking about charts like Figure 2.1 is how small the increase in household debt ratios has been over the last decade or so.   In the previous house price boom, household debt to income ratios rose much more sharply than they have in the most recent boom.  Among households with mortgages, the ratio rose by 90 percentage points of income from the cyclical low in real prices in mid 2001 to the peak, but that same ratio has risen by less since 30 percentage points from the previous peak to now.  On the more familiar metric –  total household debt to total household income –  the comparable numbers are 47 and 10 percentage points respectively.

Another way of looking at the data –  which I prefer, for various reasons including that all national income ultimately belongs to households –  is to look at the ratio of household debt to GDP.  Here is the chart of that series.

chart 3

Household debt as a share of GDP is lower now than it was a decade ago.   Even if you make allowance for the fact that the previous peak itself was during the recession (when GDP had dipped), the current ratio of household debt to GDP has barely changed since the previous peak in real house prices in mid 2007.  In many ways, this is extraordinary.

(And recall, of course, that banks’ housing loan portfolios came through the last recession –  a pretty serious recession, with a fall in nominal house prices –  unscathed.)

Here is the chart of real house prices (the QV index deflated by the CPI), expressed in log form.

chart 4

Real house prices are much higher than they were at the peak of the last cycle, and have risen by about 60 per cent from the 2011 low.

As the chart in log form illustrates, the percentage rate of increase in house prices has been less this time round than in the previous phase of the boom (2001 to 2007) when real prices rose by 87 per cent on this measure.

But that shouldn’t be any comfort.  If real house prices go from $250000 to $500000 in one period, and then from $500000 to $750000 in a subsquent period, the percentage increase is lower in the second period.  But if real incomes haven’t changed, one $250000 increase is just as burdensome as the other.

And that is pretty much what has happened with New Zealand house prices.  Relative to a base of 100 in mid-2001, real house prices increased by 84 percentage points from 2001 to mid 2007.   From mid 2011 to the present (Dec 2017 data being most recent) the increase, again relative to a base of mid-2001 prices, has been 94 percentage points.   Real incomes have increased a bit, to be sure, but actually the rate of increase (whether simple percentage increases, or relative to the 2001 base) in real GDP per capita was smaller in the more recent period.

None of that should be very surprising. In both periods we had really large, unexpected, population pressures, and in both periods we’ve had binding land use restrictions (not factors featuring in the Bank’s discussion).  Interest rates, of course, have been much lower in the second period than the first, but it doesn’t look as though one needs some exogenous interest rate story to explain another bout of house price increases of similar size to the one that happened when interest rates were a lot higher.

But it all leaves the debt to income (household income or GDP) charts a little puzzling.  As I’ve illustrated before –  and is pretty obvious with a moment’s reflection –  debt increases occur over a much longer period of time than house price increases do.  If house prices double today, the only people who will have been taking on more debt right now will have been the small minority of people transacting in houses in this particular short period. But now that house prices are higher, even if they rise no further, every new purchaser will be needing to finance the new higher prices.  Since the housing stock can take decades to turnover fully, the increase in the debt to income (or GDP) ratios can be expected to lag quite a bit behind house prices.

Here is a very simple stylised example of what I mean.  In this scenario, house prices have been unchanged for a long time, and debt stock is steady.  The aggregate debt to income ratio is about .5 (roughly what it was in New Zealand 30 years ago).  Now assume that some exogenous factor (call it “new land use regulation”) doubles house prices today.  Even if new entrants to the market borrow the same proportion of the purchase prices that their predecessors did when prices were low (on the same 25 year mortgages), it will take decades for the associated lift in the aggregate debt to income ratio to occur (35 years for even two-thirds of the adjustment to occur).

chart 5.png

And yet, in real world New Zealand, despite an equally big house price increase since 2011 as we saw from 2001 to 2007, there has been little or no increase in household debt ratios in the last decade (even though the aggregate ratios should still have been adjusting to the earlier price shock).

I’m not sure quite what the explanation is.  One explanation might be that (real) house prices have risen to such levels that a larger share of the houses are being purchased by more cashed-up buyers.  That would be consistent with the decline in the owner-occupation rate.  Perhaps regulatory financial repression is also playing a part –  successive waves of unprecedented LVR restrictions (grounded in gubernatorial whim rather than robust analysis) may have made some difference, not necessarily in a good way.   But it seems like an issue that we might have expected the Reserve Bank to explore in a document like an FSR.

Similarly, when the Reserve Bank talks up risk

The high level and concentration of household sector debt in New Zealand is the largest single vulnerability of the financial system. …..This risk has not changed materially since the last Report. Growth in household debt has slowed and house price inflation has stabilised, but significant vulnerabilities remain.

you might expect them to discuss:

  • the way rather similar levels of household debt performed in the last severe recession,
  • the Bank’s successive stress tests which suggest bank housing lending is not a systemic threat even under very severe (often unrealistically severe –  around unemployment) scenarios, and
  • their own capital requirements on banks, which are –  we are told –  calibrated to take account of the relative riskiness of different types of loans (even within an overall framework that has further increased capital requirements per unit of risk weighted assets).

But, as far as I could see, there was none of that in the document itself, and nothing of it in the Governor’s remarks at his press conference.    In the meantime, we have distortionary LVR controls kept in place –  on one man’s whim –  when, if anything, there appears to be less credit outstanding than one might reasonably have expected given the way other regulatory distortions have lifted house prices.

In a similar vein, I noted a story on Newsroom this morning, reporting the Governor’s appearance at the Finance and Expenditure Committee yesterday.  He was reported thus

But he told the select committee he would much rather the Reserve Bank, as banking regulator, could trust banks and borrowers to be prudent.

“I would love to not have to be active in that space. If banks had true long-term horizons, if the consumers were fully aware and myopia didn’t exist across borrowers, all the different foibles that people have, then you wouldn’t need the regulatory imposts.”

Talk about “nanny state” –  the Governor wishes he could trust us.  I wish we could trust him and his colleagues.

But, more specifically, the Governor here asserts again that banks are too short-term in their operations, that borrowers are myopic, and we need Reserve Bank intervention (he was talking of LVR and DTI restrictions) to save us from ourselves.  Par for the course, the Governor offered no evidence for his proposition (and there was none advanced in the FSR), it just seems to be some sort of new gubernatorial whim (as Graeme Wheeler came with the scarring experience of living through the US crisis, in this case Orr comes with an NZSF perspective –  neither grounded in specific  analysis of the New Zealand banking system).  I’ve lodged an OIA request this morning for any Reserve Bank analysis in support of these propositions.

I could have added, but overlooked doing so, a request for any evidence that – the private sector being inevitably flawed (by nature of being human) – that government regulators (also being human) can consistently improve on the outcomes of the market.  In a banking system (New Zealand, but Australia as well) where the only financial crisis in more than 100 years arose in the transition as heavy controls were being removed –  and neither the private sector nor the regulators really knew what they were doing –  you might suppose some presumption of responsibility and capability might be accorded to the private sector.  But not, it appears, by this Governor, or this Reserve Bank.  When a big ego and extensive statutory powers combine in a single person, the lack of serious supporting  analysis itself becomes a threat, including to the efficiency of the financial system.

LVR limits revisited

The Reserve Bank was out the other day with some research on the impact on house prices of the successive waves of loan to value limit restrictions put in place from 2013 to 2016.     It was a rare Reserve Bank discussion paper –  pieces typically designed to end up in a journal publication –  to get some media attention.   That was, no doubt, because of the rather bold claims made in the non-technical summary to the paper

Overall, we estimate that the LVR policies reduced house price pressures by almost 50 percent. ,,,,, When it becomes binding, LVR policy can be very effective in curbing housing prices.

Since nationwide average house prices (QV index measure) increased by about 40 per cent over the four years from September 2013 (just prior to the first LVR restrictions coming into effect) to September 2017), you might reasonably suppose that the researchers were suggesting that, all else equal, LVR restrictions had lowered house prices by almost 40 per cent (in other words, without them house prices would have increased by around 80 per cent).  Of course, that isn’t what they are claiming at all.

The paper was written by several researchers in the Bank’s Economics Department (two of whom appear to have since moved on to other things), and carries the usual disclaimer of not necessarily representing the views of the Bank itself.  Nonetheless, on an issue as contentious as LVRs, it seems safe to assume that senior policy and communications people will have been all over the communications of the results.  Even if the Governor himself didn’t see it, or devote any time to it, it seems likely this paper carries the effective imprimatur of the Assistant Governor  (Head of Economics),  the Deputy Governor (Head of Financial Stability) and (at least in the bottom line messages) the Head of Communications too.

In the paper, the authors attempt to identify the impact of the various waves of LVR controls using (a) highly-disaggregated data on property sales, and (b) the fact that shortly after the first LVR restrictions were put in place, the Bank buckled to political and industry pressure and exempted lending for new builds from the controls (even though, generally, such lending is riskier than that on existing properties).  By looking at the relationship between prices of new and existing properties before and after the various adjustments to LVR limits, they hope to provide an estimate of the effect on existing house prices of the LVR controls.

Trying to identify the statistical effects of things like LVR controls is hard, but I’m a bit sceptical of this proposed new approach.  After all, if new and existing houses were fully substitutable a new regulatory intervention of this sort could be expected to affect prices of both more or less equally.  People who were more credit-constrained (by the restrictions) would switch to buying new houses, and those who less affected by the contros (eg cash buyers) would switch more to existing houses.

In practice, of course, the two aren’t fully substitutable, for various reasons (including that most new builds are occurring in different locations –  even in the same TLA – than most existing houses), but in the Reserve Bank research paper I didn’t see any discussion of the issue at all.  If there is no substitutability at all then the research approach looks as though it should be reasonable, but that seems unlikely too.

But I’m more interested in whether the reported results are anywhere near as impressive as the authors claim.

As a reminder, here is their chart of house price inflation developments, with the various LVR interventions marked.

LVR1

And here is their summary table of those successive interventions.

LVR2.png

And here is their summary table of the impact of these LVR adjustments on house prices, as estimated from their model.

LVR3

My focus is on the last two lines of the table: the estimated percentage effect on the various different intervention on existing house prices in Auckland and the rest of New Zealand  (the three asterisks suggest that the results are highly statistically significant).

Take the initial LVR controls first (which had the added effect of being something out of the blue, shock effects of a tool never previously used in New Zealand).  Recall too that, at the time, the big concern was about Auckland house prices and associated financial stability risks.    On this particular set of model estimates, the effect on house prices outside Auckland –  where there wasn’t a particular problem –  was larger than the effect inside Auckland.  In both cases, the effect (2 to 3 per cent) isn’t much different to previous estimates, or (indeed) to the sorts of numbers that were being tossed around internally before the controls were imposed.  It was generally expected that the controls would have a temporarily disruptive effect, lowering house prices for a while, but the effects would wear off over the following few years. (There are some model estimates on page 9 of this paper the Bank published in 2013.)

And what about the second wave of controls (which tightened financing restrictions on investors in Auckland, and eased them for everyone outside Auckland)?  On these latest estimates, those restrictions had no discernible impact on prices in the Auckland market at all, even though they were avowedly put in place because of explicit gubernatorial concerns about investor property lending in Auckland.  On, on the other hand, the moderate easing in the rules outside Auckland was so potent that it full unwound the price effects of the first wave of controls.

And, finally, the third wave of controls.  These represented a substantial tightening in investor-finance restrictions (especially outside Auckland), and a reversal in the easing (in wave 2) of the owner-occupier financing restrictions outside Auckland.   And yet, even though the rule changes were materially larger for borrowers outside Auckland, there is no estimated effect on house prices outside Auckland at all (even though, in wave 2 the easing in owner-occupier restrictions, now reversed, was supposed to have had a large effect).  And although the Auckland rule changes are smaller those outside there is no estimated effect on Auckland prices at all.  These results aren’t very plausible and suggest that – even if the results are statistically significant –  the strategy they used to identify the effect on prices isn’t that good.

One could also note that if one added up the effects across the three columns (which isn’t kosher, but still…….) the total effect outside Auckland is basically zero (actually slightly positive).  Even in Auckland, the total is about 5 per cent.

One of the reasons why simply adding up the estimated effects isn’t kosher is because everyone has always recognised that LVR restrictions are unlikely to have long-term effects on house prices.  They disrupt established established financing patterns, and thus can dampen house prices a bit in the short-term, but the effects dissipate with time.

In fact, the Reserve Bank researchers illustrate exactly that point in this chart which (if I’m reading them correctly) relates to the first wave of LVR controls.

LVR4

As the authors themselves observe

Figure 5 plots the point estimates with 95 percent confidence intervals. Overall, the effect of the first LVR policy on house prices occurs within the first three months and is relatively stable over a six-month period. Thereafter, the moderating effect declines somewhat (to around 1.5 percent after 12 months), perhaps owing in part to individuals having saved up the required deposit under the policy and a price differential having opened up between existing and newly built houses.

Any substantial effects on house prices don’t seem to last long.

To be fair to the Bank, and the former Governor, they never claimed house price effects would last for long.  The argument was that LVR restrictions reduced financial system risks by altering the composition of bank balance sheets.  That is another contentious claim, but it isn’t touched on in the current paper and so I won’t deal with it further here either.

So what led them to write (and their bosses to approve) the extravagant claim that LVR policies reduced house price pressures by almost 50 per cent?    It seems to be this

The moderating effect of LVR 3 was clearly seen in Auckland with a 2.7 percent reduction in house prices. This LVR 3 effect is both statistically and economically significant, as during the same period the average house price increased by 5.8 percent.

Overall, we estimate that the LVR policies reduced house price pressures by almost 50 percent.

But

  • as the table above shows, there was no estimated effect on all (from LVR3) outside Auckland,
  • even inside Auckland, and granting their estimates, 2.7 per cent is under a third of pre-LVR price increases during that specific period (the 5.8 per cent that happened anyway, plus the 2.7 per cent they claim to have reduced prices by).
  • as the chart aboves shows, on their own estimates, the dampening effects of LVR controls seem to dissipate relatively quickly (in that case half of the effect had unwound within 12 months).
  • the estimate seems to take no account of the ongoing house price inflation outside the arbitrarily chosen period they measure.

Contrary to their claims, LVR policy is not very effective in curbing house prices.  Indeed, its staunchest advocates never really claimed otherwise (for them it was mostly about financial stability), which does leave one wondering why today’s Reserve Bank management are publishing such overblown (and undersupported) claims to be made.  As I noted earlier, over a period when nationwide house prices rose by about 40 per cent, this latest model suggests no sustained impact at all on house prices outside Auckland –  despite significant interruptions to established financial structures and effective property rights –  and probably quite limited effects in Auckland too.

Overblown claims about what LVR controls can do for house prices (especially with no discussion at all of efficiency/distributional costs etc) risk distracting attention from the real regulatory failures that explains the dysfunctional housing market.  And they also detracting from the credibility of the Reserve Bank, whose legitimacy depends in part of being authoritative when it speaks.


Taxes, housing, and economic underperformance

Two local articles on possible tax system/housing connections caught my eye this morning.  One I had quite a lot of sympathy with (and I’ll come back to it), but the other not so much.

On Newsroom, Bernard Hickey has a piece lamenting what he describes in his headline as “Our economically cancerous addiction”.    The phrase isn’t used in the body of the article, but there is this reference: “our national obsession with property investment”.   Bernard argues that the tax treatment of housing “explains much of our [economic]underperformance as a country over the past quarter century”, linking the tax treatment of housing to such indicators (favourites of mine) as low rates of business investment and lagging productivity growth.

Centrepiece of his argument is this chart from the Tax Working Group’s (TWG) discussion document released last week.

TWG chart

Note that, although the label does not say so, this is an attempt to represent the tax rate on real (inflation-adjusted) returns.

It is a variant of one of Treasury’s favourite charts, that they’ve been reproducing in various places for at least a decade.   The TWG themselves don’t seem to make a great deal of it –  partly because, as they note, their terms of reference preclude them from looking at the tax-treatment of owner-occupied housing.  They correctly note –  although don’t use the words –  the gross injustice of taxing the full value of interest income when a large chunk of interest earnings these days is just compensation for inflation, not a gain in purchasing power at all.   And, importantly, the owner-occupied numbers relate only to the equity in houses, but most people get into the housing market by taking on a very large amount of debt.  Since interest on debt to purchase an owner-occupied house isn’t tax-deductible –  matching the fact that the implicit rental income from living in the house isn’t taxed –  any ‘distortion’ at point of entering the market is much less than implied here.

Bear in mind too that very few countries tax owner-occupied housing as many economists would prefer. In some (notably the US) there is even provision to deduct interest on the mortgage for your owner-occupied house.   You –  or Bernard, or the TOP Party –  might dislike that treatment, but it is pretty widespread (and thus likely to reflect some embedded wisdom).  And, as a reminder, owner-occupation rates have been dropping quite substantially over the last few decades –  quite likely a bit further when the latest census results come out.  Perhaps a different tax system would lead more old people –  with lots of equity in a larger house – to downsize and relocate, but it isn’t really clear why that would be a socially desirable outcome, when maintaining ties to, and involvement in, a local community is often something people value,  and which is good for their physical and mental health.

So, let’s set the owner-occupied bit of the chart aside.  It is simply implausible that the tax treatment of owner-occupied houses –  being broadly similar to that elsewhere –  explains anything much about our economic underperformance.  And, as Bernard notes, it isn’t even as if, in any identifiable sense, we’ve devoted too many real resources to housebuilding (given the population growth).

So what about the tax treatment of rental properties?   Across the whole country, and across time, any distortion arises largely from the failure to inflation-index the tax system.  Even in a well-functioning land market, the median property is likely to maintain its real value over time (ie rising at around CPI inflation).  In principle, that gain shouldn’t be taxed –  but it is certainly unjust, and inefficient, to tax the equivalent component of the interest return on a term deposit.     Interest is deductible on rental property mortgages, but (because of inflation) too much is deductible –  ideally only the real interest rate component should be.  On the other hand, in one of the previous government’s ad hoc policy changes, depreciation is not deductible any longer, even though buildings (though not the land) do depreciate.

But, here’s the thing.  In a tolerably well-functioning market, tax changes that benefit one sort of asset over others get capitalised into the price of assets pretty quickly.  We saw that last year, for example, in the US stock market as corporate tax cuts loomed.

And the broad outline of the current tax treatment of rental properties isn’t exactly new.  We’ve never had a full capital gains tax.  We’ve never inflation-adjusted the amount of interest expense that can be deducted.  And if anything the policy changes in the last couple of decades have probaby reduced the extent to which rental properties might have been tax-favoured:

  • we’ve markedly reduced New Zealand’s average inflation rate,
  • we tightened depreciation rules and then eliminated depreciation deductions altogether,
  • the PIE regime – introduced a decade or so ago –  had the effect of favouring institutional investments over individual investor held assets (as many rental properties are),
  • the two year “brightline test” was introduced, a version of a capital gains tax (with no ability to offset losses),
  • and that test is now being extend to five years.

If anything, tax policy changes have reduced the relative attractiveness of investment properties (and one could add the new discriminatory LVR controls as well, for debt-financed holders).  All else equal, the price potential investors will have been willing to pay will have been reduced, relative to other bidders.

And yet, according to Bernard Hickey

It largely explains why we are such poor savers and have run current account deficits that built up our net foreign debt to over 55 percent of GDP. That constant drive to suck in funds from overseas to pump them into property values has helped make our currency structurally higher than it needed to be.

I don’t buy it (even if there are bits of the argument that might sound a bit similar to reasoning I use).

A capital gains tax is the thing aspired to in many circles, including the Labour Party.   Bernard appears to support that push, noting in his article that we have (economically) fallen behind

other countries such as Australia, Britain and the United States (which all have capital gains taxes).

There might be a “fairness” argument for a capital gains tax, but there isn’t much of an efficiency one (changes in real asset prices will mostly reflect “news” –  stuff that isn’t readily (if at all) forecastable).   And there isn’t any obvious sign that the housing markets of Australia and Britain –  or the coasts of the US –  are working any better than New Zealand’s, despite the presence of a capital gains tax in each of those countries.   If the housing market outcomes are very similar, despite differences in tax policies, and yet the housing channel is how this huge adverse effect on productivity etc is supposed to have arisen, it is almost logically impossible for our tax treatment of houses to explain to any material extent the differences in longer-term economic performance.

And, as a reminder, borrowing to buy a house –  even at ridiculous levels of prices –  does not add to the net indebtedness of the country (the NIIP figures).  Each buyer (and borrower) is matched by a seller.  The buyer might take on a new large mortgage, but the seller has to do something with the proceeds.  They might pay down a mortgage, or they might have the proceeds put in a term deposit.    House price inflation –  and the things that give rise to it –  only result in a larger negative NIIP position if there is an associated increase in domestic spending.  The classic argument –  which the Reserve Bank used to make much of –  was about “wealth effects”: people feel wealthier as a result of higher house prices and spend more.

But here is a chart I’ve shown previously

net savings to nni jan 18

National savings rates have been flat (and quite low by international standards) for decades.  They’ve shown no consistent sign of decreasing as house/land prices rose and –  for what its worth –  have been a bit higher in the last few years, as house prices were moving towards record levels.

What I found really surprising about the Hickey article was the absence of any mention of land use regulation.  If policymakers didn’t make land artificially scarce, it would be considerably cheaper (even if there are still some tax effects at the margin).   And while there was a great deal of focus on tax policy, there was also nothing about immigration policy, which collides directly with the artificially scarce supply of land.

I’ve also shown this chart before

res I % of GDP

These are averages for each OECD country (one country per dot).  New Zealand is the red-dot –  very close to the line.  In other words, over that 20 year period we built (or renovated/extended) about as much housing as a typical OECD country given our population growth.    But, as I noted in the earlier post on this chart

The slope has the direction you’d expect – faster population growth has meant a larger share of current GDP devoted to housebuilding – and New Zealand’s experience, given our population growth, is about average. But note how relatively flat the slope is. On average, a country with zero population growth devoted about 4.2 per cent of GDP to housebuilding over this period, and one averaging 1.5 per cent population growth per annum would have devoted about 6 per cent GDP to housebuilding. But building a typical house costs a lot more than a year’s average GDP (for the 2.7 people in an average dwelling). In well-functioning house and urban land markets you’d expect a more steeply upward-sloping line – and less upward pressure on house/land prices.

And, since Hickey is –  rightly – focused on weak average rates of business investment here is another chart from the same earlier post.

Bus I % of GDP

Again, New Zealand is the red dot, close to the line.   Over the last 20 years, rapid population growth –  such as New Zealand has had –  has been associated with lower business investment as a share of GDP.  You’d hope, at bare minimum, for the opposite relationship, just to keep business capital per worker up with the increase in the number of workers.

This issue, on my telling, isn’t the price of houses –  dreadful as that is –  but the pressure the rapid policy-fuelled growth of the population has put on available real resources (not including bank credit).  Resources used building or renovating houses can’t be used for other stuff.

And one last chart on this theme.

productive cap stock

The blue line shows the annual per capita growth rate in the real capital stock, excluding residential dwellings (it is annual data, so the last observation is for the year to March 2017), but as my post the other day illustrated even in the most recent national accounts data, business investment has been quite weak.   I’ve added the orange line to account for land and other natural resources that aren’t included in the official SNZ capital stock numbers.  We aren’t getting any more natural resources –  land, sea, oil and gas or whatever –  (although of course sometimes things are discovered that we didn’t know had been there).  The orange line is just a proxy for real natural resources per capita –  as the population grows there is less per capita every year, even if everything is renewable, as many of New Zealand’s natural resources are (and thus the line is simply the inverted population growth rate).

In New Zealand’s case at least, rapid population growth (largely policy driven over time) seems to have been –  and still to be – undermining business investment and growth in (per capita) productive capacity.   Land use regulation largely explains house and urban land price trends.  And it seems unlikely that any differential features of New Zealand’s tax system explain much about either outcome.

The other new article that caught my eye this morning was one by Otago University (and Productivity Commission) economist, Andrew Coleman.    He highlights, as he has in previous working papers, how unusual New Zealand’s tax treatment of retirement savings is, by OECD country standards.  Contributions to pension funds are paid from after-tax income, earnings of the funds are taxed, and then withdrawals are tax-free.   In many other countries, such assets are more often accumulated from pre-tax income, fund earnings are largely exempt from tax, and tax is levied at the point of withdrawal.   The difference is huge, and bears very heavily on holding savings in a pension fund.

As Coleman notes, our system was once much more mainstream, until the reforms in the late 80s (the change at the time was motivated partly by a flawed broad-base low rate argument, and partly –  as some involved will now acknowledge –  by the attractions of an upfront revenue grab.

The case for our current practice is weak.  There is a good economics argument for taxing primarily at the point of spending, and not for –  in effect –  double-taxing saved income (at point of earning, and again the interest earned by deferring spending).  And I would favour a change to our tax treatment of savings (I’m less convinced of the case for singling out pension fund vehicles). I hope the TWG will pick up the issue.

That said, I’m not really persuaded that the change in the tax treatment of savings 30 years ago is a significant part of the overall house price story.  The effect works in the right direction –  and thus sensible first-best tax policy changes might have not-undesirable effects on house prices.  But the bulk of the growth in real house (and land) prices –  here and in other similar countries –  still looks to be due to increasingly binding land use restrictions (exacerbated in many places by rapid population growth) rather than by the idiosyncracies of the tax system.

House prices: Cleveland and Wellington

A few months I signed up to get the e-mail newsletters of US analyst Aaron Renn.

Aaron M. Renn is a senior fellow at the Manhattan Institute, a contributing editor of City Journal, and an economic development columnist for Governing magazine. He focuses on ways to help America’s cities thrive in an ever more complex, competitive, globalized, and diverse twenty-first century.

There is an interesting mix of material on urban issues.   But this morning, one newsletter in particular caught my eye.  The title was a warning: “Sprawl in its Purest Form, Cleveland edition”.    The article began this way.

…..the image below contrast[s] the amount of urbanized land in Cleveland’s Cuyahoga County in 1948 vs. 2002. The county population was identical in both years: 1.39 million.


And the piece goes on to lament how costly the spread of suburbia is, concluding that

As a rough heuristic, development of new suburban footprint should largely be limited to the growth rate in households to avoid saddling a region with excess fixed cost.

It might be music to the ears of some of our own planners, and the politicians who continue to enforce their policies.

Renn laments the fact that, at least in this case, when cities can spread and new houses can easily be built, while the population doesn’t change much, existing houses lose value

If you keep building new homes but you aren’t adding households, then older homes at the bottom of the scale will be abandoned. And all up the stack homes are devalued.

In the same way, when we had restrictions on importing cars in New Zealand for decades, secondhand cars didn’t depreciate much.  Most of us prefer access to newer cars.

I had a look at some Cleveland data.  And sure enough not only has that county’s population been largely unchanged, but greater Cleveland (MSA) with just over 2 million people also hasn’t had much change in population for 50 or 60 years (if anything falling slightly more recently).

I also had a look at house prices.   Demographia reports that Cleveland median house prices are 2.7 times median incomes in Cleveland, averaging US$146000 last year.  Average per capita GDP in the Cleveland metro area was around US$56000 in 2016.

On the other hand, a friend had mentioned the other day a house, perhaps 150 metres from where I’m typing, that had sold the other day for  $831000.    It is a small house (100 square metres) on a pretty tiny section (324 square metres) –  with a major construction project almost on the doorstep for the next 18 months or so – and as far as I can see nothing out of the ordinary.  That is the point –  it isn’t egregiously expensive for Wellington (let alone Auckland) in this day and age.    It is about what one might expect, given our laws and regulatory practices.     Average GDP per capita in Wellington in the year to March 2016 was around $NZ67900 –  a fair bit less than in Cleveland.

Homes.co.nz records that the same Island Bay house sold in 1985 for $76500.   Apply the Reserve Bank’s inflation calculator and in today’s dollars that would be the equivalent of $207000.  The actual recent sale price –  the real increase in price –  was four times that.

How have Cleveland house prices done over time?  Here is a chart, back to 1985, from the FRED database.

cleveland prices

Nominal prices have increased quite a lot.  But in real terms, applying a US inflation calculator, Cleveland house prices have barely moved –  up a bit in the boom years, down in the recession, but over 33 years virtually no change at all.  Houses were highly affordable then, houses are highly affordable now.    And lest you assume Cleveland is some economic wasteland, the FRED database also suggests that the unemployment rate there has been averaging about 5 per cent in the last year or two, very similar to that in New Zealand.

I usually focus on cities with fast-growing populations in discussing US examples of low and affordable house prices – eg Atlanta or Nashville.   And I’ve never been to Cleveland, and have no particular idea how attractive or otherwise parts or all of it are (in Wellington, Porirua and Wainuiomata  –  for example –  also have their downsides).   But the ability of the citizenry to readily expand the physical footprint of the city seems like a success story, producing housing market outcomes that seem much more appealing –  particularly to younger people trying to enter the market –  and affordable than what we now seem to manage in our larger New Zealand cities.

We should steer well clear of “rough heuristics” or tighter rules that try to limit the expansion of the physical footprint of cities, or allow officials and politicians to determine which land can and can’t be built on, in what order.   A competitive market for urban land –  peripheral and central –  remains the best prospect for once again delivering what should be a basic expectation: affordable housing.

Sadly, I noted in ACT’s newsletter earlier in the week, a link to a parliamentary question from a few weeks ago in which the Minister for the Environment indicated that “Cabinet is yet to make any decision about whether to review the Resource Management Act”.  I’ve long been sceptical as to whether, even if some Labour parts of a left-wing government was willing to think about serious reform, such reform would be possible given the reliance on the Greens to pass government legislation.  Sadly, for now it increasingly looks as if those fears are being realised.

House –  and land prices –  need to fall.  This government, like its predecessor, seems at  scared of such an outcome, and unwilling to take steps that offer the prospect of sustained much lower prices.