A couple of weeks ago I wrote a post here, prompted by a paper by the former Bank of England Deputy Governor Sir Paul Tucker. Tucker’s paper was written in the context of the huge losses central banks in many countries, including his own UK, have run up through their large scale asset purchase programmes, especially those undertaken in 2020 and 2021 when bond yields (actual and implied forwards) were already incredibly low. While central banks continue to hold the bonds, the losses are seen every year now as the funding costs on those bond positions (the interest paid on the resulting settlement cash balances) swamp the low earnings yields on the bonds themselves. Bond positions purchased at yields perhaps around 1 per cent are financed with floating rate debt now paying (in New Zealand) 3.5 per cent (a rate generally expected to rise quite a bit further).
Tucker explored the idea that central banks might in future choose not to fully remunerate all settlement cash balances (while still applying the policy rate at the margin), and that if they did not then politicians might in future be reluctant to authorise future LSAPs and associated taxpayer indemnities (this seemed like a bonus to me, but Tucker is a bit more open to the potential of QE generally than I am (for New Zealand). With $60 billion or so of settlement cash injections still in the system (although with other offsets, total settlement cash balances are less than that), there is a lot of money potentially at stake.
My post was pretty sceptical of the idea – it seemed like arbitrary “taxation” by an entity with no mandate and little accountability – and in a Herald article at about the same time I was pleased to see several former colleagues also expressing considerable scepticism. In the wake of my post I had a bit of an email exchange with Tucker and while that didn’t change my mind it did help clarify the importance of reaching a view on whether the LSAP additions to settlement cash balances had resulted in something akin to a windfall boost to bank profits or not. Here is Tucker
Now, reaching a definitive view on a matter like this isn’t easy. Formalised models might even help, although I’m a bit sceptical even they could ever offer anything very definitive, and – in arbitrary taxation at least as much as criminal justice – we might reasonably expect something close to a “beyond reasonable doubt” test to be applied (especially when no one compelled the state to ever do LSAPs at all). You could think of a hypothetical world in which such a windfall might appear to rise – central banks buy the bonds from pension or hedge funds who simply deposit the proceeds with banks and happily (or resignedly) just accept zero interest on the resulting deposits – but it doesn’t seem very plausible. Perhaps there are other hypotheticals, but it still seems a stretch (and we aren’t in the world decades ago where, for example, banks were forbidden from paying interest on transactions balances).
I don’t have the resources or data for the sort of in-depth analysis that might be required if governments and central banks were to be seriously considering the Tucker option. But what do the high-level indicators we do have show? This, inevitably, bleeds into the recent (and annual or semi-annual) ritual in which the political left and the popular media bemoan the profitability of the banking system more generally.
The first increase in the OCR was in October 2021. Until then, settlement balances had been earning 0.25 per cent per annum, so that even if banks had somehow been paying nothing on the counterpart deposits, the amounts involved would have been too small to have shown up in the aggregate data (0.25 per cent per annum on $60 billion is about $150m per annum). But we have aggregate data now up to and including this year’s June quarter.
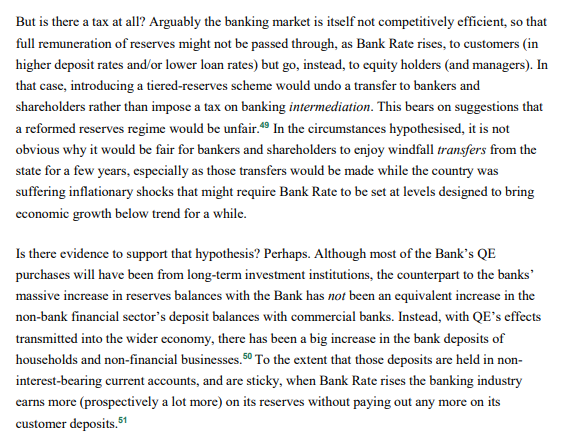
I’m including some long-term charts here (from the Reserve Bank website data, going as far back as their data go), as background to some comments on bank profitability too.
There is return on assets
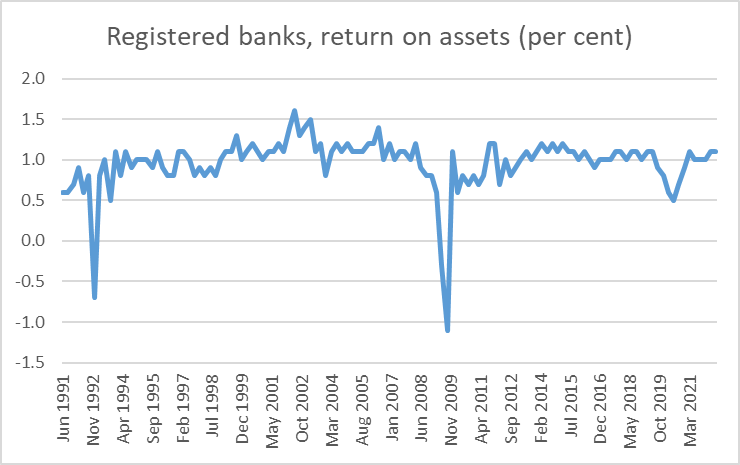
return on equity
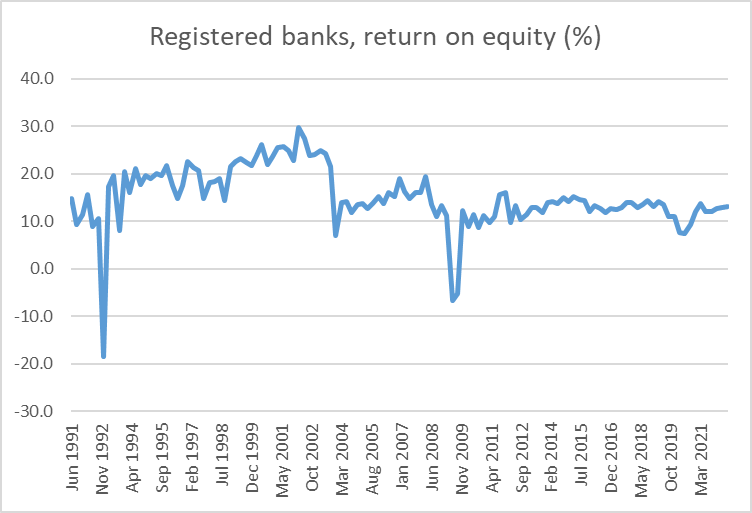
and the net interest margin (shown on the same chart as the average interest rate earned on interest-earning assets)
It is early days – the much higher OCRs for the September and December quarters may shed more light in some months’ time – but at present there isn’t anything much pointing to windfall earnings, whether directly from the Tucker effect or from the LSAP or other Covid interventions. Returns dipped during the 2020 deep (if brief) downturn, and then seem to have returned to about pre-Covid average levels. If the net interest margin has risen a bit, in the June quarter it was at about the average level for the previous 15 years.
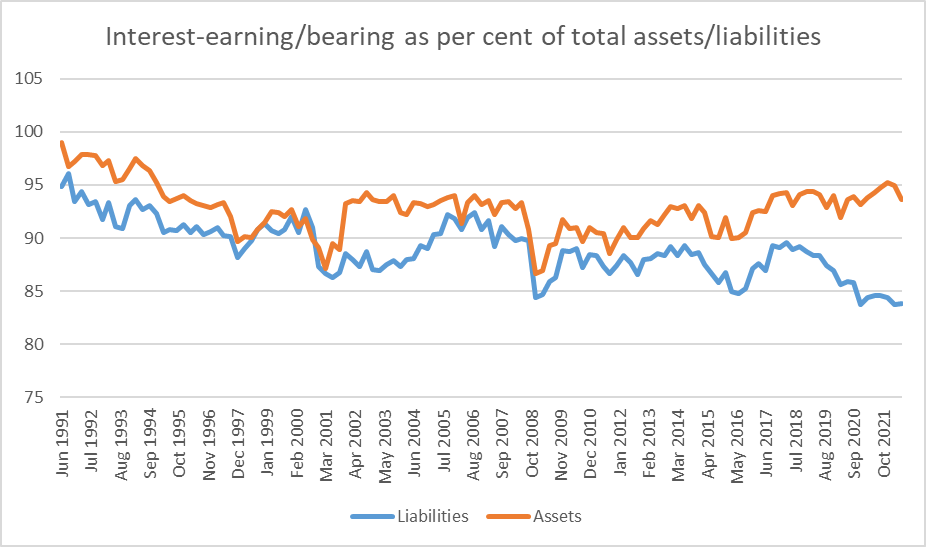
On the other hand, supporters of the Tucker story could point to this chart. It is interesting that interest-bearing liabilities have dropped to a record (over this 30 year period anyway) low but (a) perhaps it is less surprising given that, at least to June, the absolute level of interest rates remained very low (and well below the prolonged period 20 years earlier when the interest-bearing share of total liabilities was also unusually low) and (b) as yet, there is no sign of this reflected in unusually high bank returns (see earlier charts).
Time will tell, but to this point there is no smoking gun, in New Zealand anyway. Tucker does note that (at least in the UK context) windfall returns could be paid away in management bonuses, so that they wouldn’t show up in after-tax profit figures, but (a) that seems more like a UK issues (big bonuses in the City etc) and (b) you would expect to see it showing up in bank disclosures (eg CEO salaries etc) and I’m not aware of any sign it (yet) has.
More generally, what to make of the bank profits story? On a cyclical basis there were reasons one might have expected the last year to have been the best for some time: the economy was extremely overheated, unemployment was extremely low, and although house prices have been falling more recently they only peaked in November last year, having risen to an extraordinary extent over the previous 15 months or so. Banks tend to make lots of money in circumstances like that (and, on the other hand, to do poorly in deep recessions). Perhaps reflecting the abnormal and uncertain state of the Covid world over 2021/22, in fact none of those charts above suggest anything exceptional about bank profitability (at times, really high reported bank profits can themselves be a worrying financial stability indicator – lots of poor quality loans with high upfront fees and/or dodgy accounting can produce very flattering short-term numbers, all while storing up big future losses. Cyclically, the year ahead looks a lot less favourable for banks (as the ANZ CEO noted they are now writing a tiny fraction of the number of new mortgages they were doing at peak) and a recession (with all the attendant reduction in demand for products, reduction in servicing capacity, and outright losses) is generally agreed to be looming.
What about overall average rates of return? When they left aren’t making cyclical complaints, this tends to be where they focus. And of course the return on equity is better than you are going to get on a bank deposit, but it is also a great deal riskier.
One obstacle to analysing the issue in a specifically New Zealand context is that hardly any New Zealand banks are listed on the stock exchange as such, so we don’t have a good read on the value the market puts on them. But the big-4 banks are the dominant players in Australia too, housing lending makes up almost two-thirds of credit in Australia, and Australia has similarly absurd house price to income ratios in its largest cities. Historically, rates of return have also looked quite high
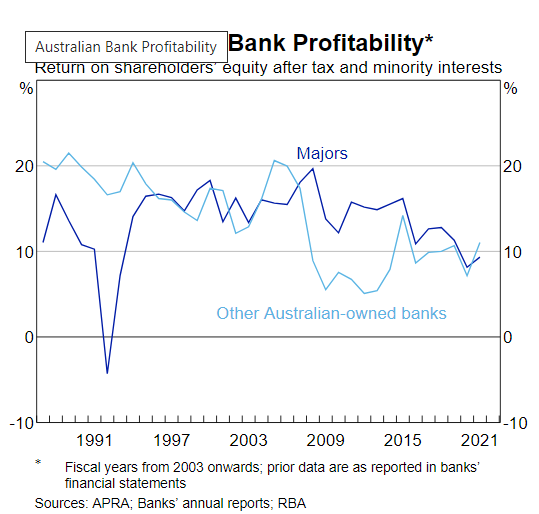
(One might also add that in recent decades the New Zealand and Australian banking systems have been amongst the most stable anywhere).
Then again, the market seems less impressed with the Australian banks than the New Zealand political left are. Price to book value ratios don’t look particularly impressive – for long-established “licence to print money” entities – and of the four big Australian banking groups, in three cases the first time the current share price was reached was well over a decade ago.
We (and Australia) have big banks. When regulation renders house prices absurdly expensive, you need entities that will facilitate very large amounts of debt. Big banks require lots of capital, and on lots of capital lots of money can and should be made. But if the left is so convinced there is money for jam on offer there is a readily accessible market response: buy more shares with their own savings.
Instead, from the party that wants to make us all poorer, force people to live in expensive townhouses, and do all they can to discourage cars and planes (oh, and free speech too), yesterday we got a proposal that there should be an “excess profits tax”. The Green Party’s discussion document is here. I guess it is mostly just political spin to try to keep up the radical left vote, but it really was an astonishingly threadbare document.
For precedent, we are reminded on a couple of occasions that there were excess profits taxes in World Wars One and Two. And since we actually conscripting people – and ordering them into the military or directed service – and restricting all manner of other economic activity probably few people had much problem with that (the idea of “conscripting capital” was (understandably) big on the left in New Zealand. But while the left may like to claim we are now in some “moral equivalent of war”, in fact we are running a market economy in which firms and individuals are free to come and go, invest or not, as they choose. We are also told about windfall taxes on energy companies in Europe at present, but again these are rather more equivalent to an actual wartime situation (very high returns to lower cost renewables producers for example are arising out of the foreign policy choices of governments around the Russian/Ukraine situation).
But nothing in the Greens’ document establishes a serious case for New Zealand now (eg for better or worse we aren’t tied into the global LNG supply chain)
And then there are the basics. This appears early on.

I followed the footnote to be sure I was using the same sources. From the Annual Enterprise Survey
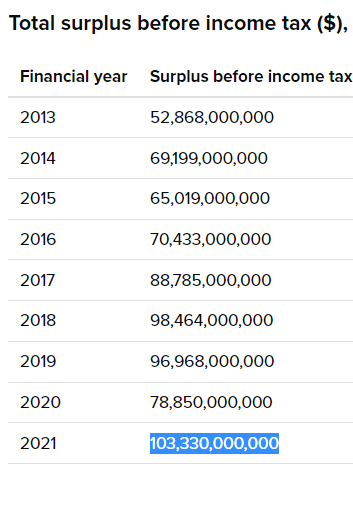
So you can see the $103.3 billion. But you might also note the sharp fall in this measure of profits the previous year (Covid disruption and all that), and the smaller fall the year prior to that. Actual profits before tax on this measure were about 5 per cent high in the 2021 years than in the 2018 years.
And nominal GDP? Well, it was up 17 per cent over roughly the same period (calendar 2021 over calendar 2018).
Then we get charts like this.
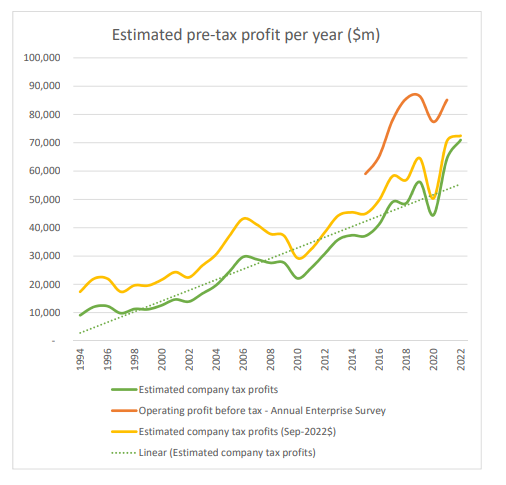
I have no idea where any of the lines comes from but note (a) the orange line, which claims to be taken from the AES, has a latest observation LOWER than the one a couple of years earlier, and (b) while the Greens claim that “the graph below demonstrates that profits are already exceeding prepandemic levels; and are several times higher in real terms than in the 1990s” they fail to point out that real GDP is a lot higher than it was in the 1990s too.
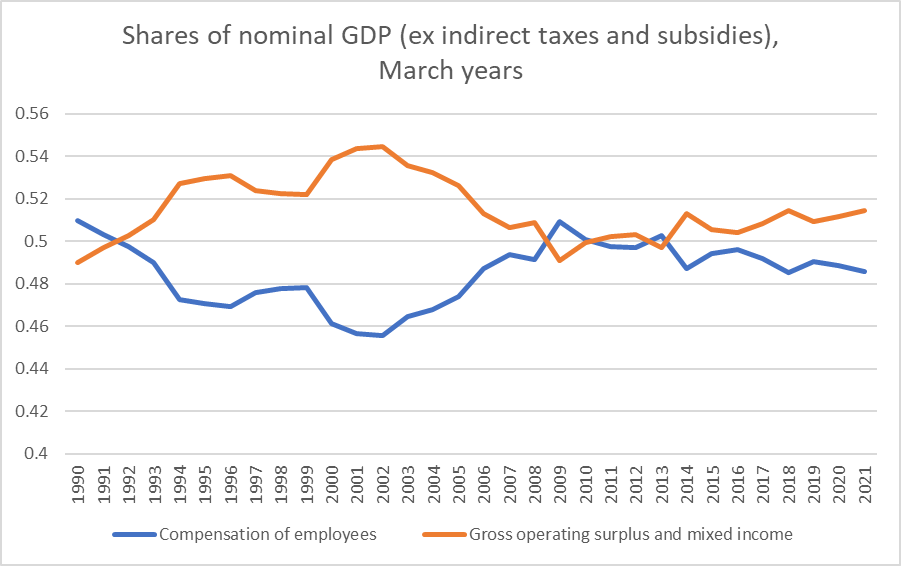
How do those ratios look? From the national accounts we have a breakdown between compensation of employees on the one hand and returns to business (including labour income for self-employed operations). Wage and profit shares have ebbed and flowed but nothing about the last few years looks very unusual.
The same data are now available on a quarterly basis, but only since 2016 (and inevitably the more recent observations are subject ot revisions). This time I’ve just shown the two series as cumulative growth rates since 2016
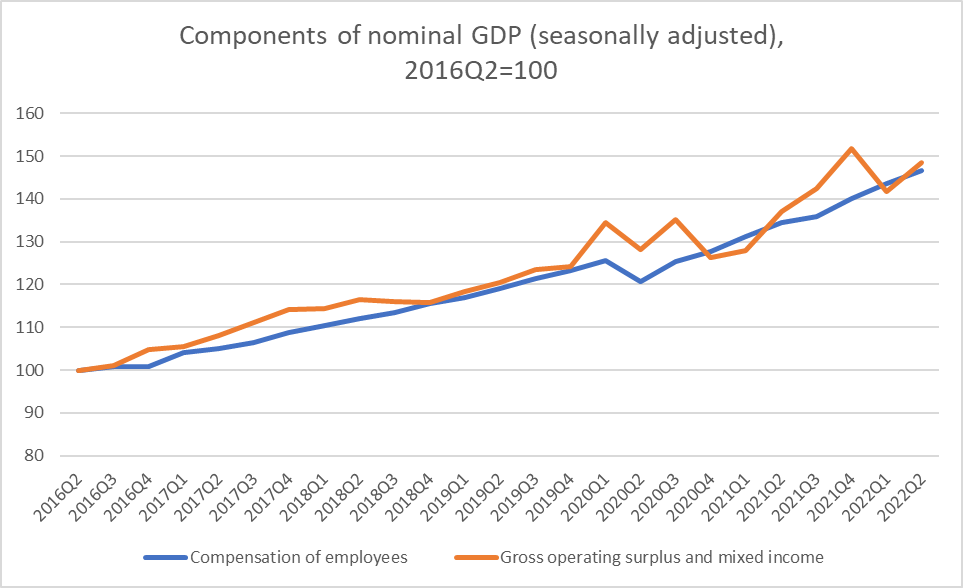
Labour costs and non-labour components of the income measure of GDP have risen over the full period by almost exactly the same percentage (seasonally adjusting through the Covid lockdowns is a real challenge so I wouldn’t pay much attention to those particular quarters).
We are left wondering where all these excess returns the Greens are on about really are. If they mean house prices rising in 2020 and 2021, well of course I can quite understand (and we know they like the idea of a capital gains tax) but……house prices are now falling quite a lot, and excess profits taxes aren’t usually aimed at Mum and Dad (indeed the rest of the document is all about th rapacious capitalists).
One could go on, but I won’t. The Greens seem keener on planning to spend the proceeds of their tax than provide firm analytical underpinnings to it, and of course while feeding the narrative that somehow there is money for jam being left on the table, there seemed to be no mention of countervailing reductions in business taxation if/when there is a deep recession or windfall losses (and in the nature of windfalls, losses are as likely as gains). But why would anyone really be surprised?
The document has this line: “The Green Party considers that record profits during a time of economic hardship for many New Zealanders are immoral and unsustainable”. Except that whether one uses their AES measure, or national accounts measures there isn’t anything very remarkable about profits in recent years – except of course that there is lots of inflation, but even then as that final chart shows returns to labour in total have been growing at about the same rate of returns to providers of other resources.

Reblogged this on Utopia, you are standing in it!.
LikeLike
Great post, thanks for that. The comment I have is on the use of ROA as a metric of profitability for banks. The use of ROA is widespread, and may make sense for corporates.
However, if you look at a balance sheet of a bank, then you will have to admit that they manage 100% assets and about 90% liabilities. The profits are the result of asset and liability management. ROA, however, does not adequately capture the liability-management part.
LikeLike
Fair point. I was using it onlybecause it was on the RB’s spreadsheet, and to check if anything unusual had happened in recent quarters.
LikeLike
Thanks, I agree, this is the territory of geeks 😉
LikeLike
Hi Michael
As always, great reading.
I dont have the numbers, and perhaps you do, but surely one of the major reasons the banks profits as a % asset/capital is more or less steady is a direct result of the RB requiring the banks to increase their capital by a significant amount. The profit goes up nominally (at least) by the increase in capital. And so there’s the answer. So again, the RB is to blame…….directly, but again no acknowledgement when it would be so simple for the public angst (and Ive seen a bit) to be allayed. I would love to see the numbers which I suspect would take me a long time to extract, whereas you will know where to get them. Thanks. But still think that the banks have effectively lost their social licence by their actions
LikeLike
As yet, there has not been a huge increase in capital ratios (lots more to come over the next 6 years) but yes as a return on shareholders’ funds, recent bank profits look v similar to what we were seeing in the decade or so prior to the pandemic.
I’m v sceptical of the “social licence” argument, which mostly seems to amount to people on the political left using the banks as convenient (Australian) whipping boys. It is a bit like supermarket pricing: take out all the alleged supernormal profits and grocery prices might fall by 1-2% (margins in groceries are pretty small). Similarly, if profits of banks fell 20% it would be akin to a 20bps reduction in interest margins (perhaps split between depositors and borrowers). that is real money, but the difference is hardly make or break stuff, given the extent of normal fluctuations in interest rates.
LikeLike