In a post a couple of weeks ago I outlined some reasons for scepticism about the case for increasing the OCR by 50 basis points specifically at the then-forthcoming OCR review. My point was mostly about the data hiatus – the OCR decision would be taking place almost 3 months after the most recent CPI data and more than 2 months since the last main labour market data. It seemed (and seems) foolish for the MPC to stick to its schedule of review dates, including the long summer holiday it will give itself after next month’s MPS. It remains highly problematic that New Zealand governments have penny-pinched on core statistics and as a result we have such slow and infrequent macro data (we got the September quarter CPI inflation data yesterday, Switzerland by contrast released September month data on 3 October).
But there were also some considerations in the macroeconomics
- the reasonably long lags in monetary policy (the OCR really only having been aggressively tightened fairly recently)
- weakening commodity prices,
- relatively subdued nominal GDP growth, among the very lowest in the OECD,
- and some indications in core inflation measures that at least things had not been getting worse (continuing to spiral upwards)
All the inflation rates were, of course, unacceptably high.
Of course, as was universally expected the MPC did raise the OCR by 50 basis points in their October review. And yesterday we got the September quarter CPI data, which took by surprise all those who’d published forecasts (and, I guess, almost any of us who’d heard their headline forecasts). The outcome was higher than the Reserve Bank’s last published forecast, but since that forecast was more than two months old and anyway isn’t broken down into headline and core components – and they’d given us no sense of an update in the October review – not too much weight should now be put on that particular aspect of the surprise.
I don’t do short-term components forecasting, so what follows isn’t about the extent of the surprise (immediate prior expectations vs outcomes) but about what to make of the actual outcomes and current inflation. First, I’ll step through and update the charts from the earlier post.
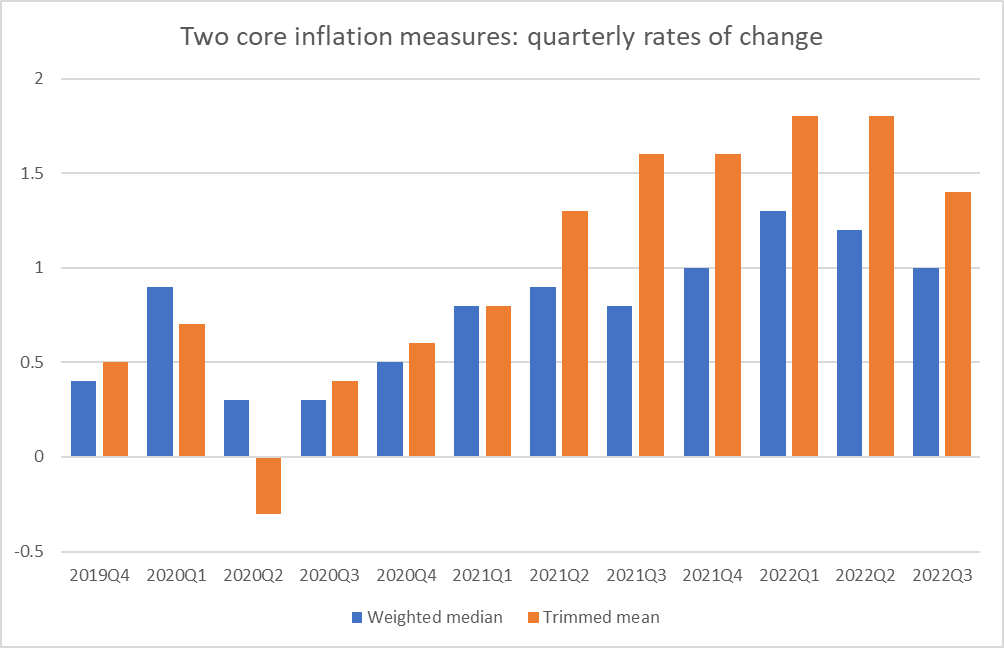
These two – commonly used abroad – core inflation measures might suggest a little room for encouragement. Both quarterly changes are still high (far too high), and the gap between them is unprecedented, but they both look as though they could be past their respective peaks.
Monetary policy always takes time to work, and as this Reserve Bank chart reminds us it was only late last year that new mortgage rates really started rising.

But then there are these two exclusion measures
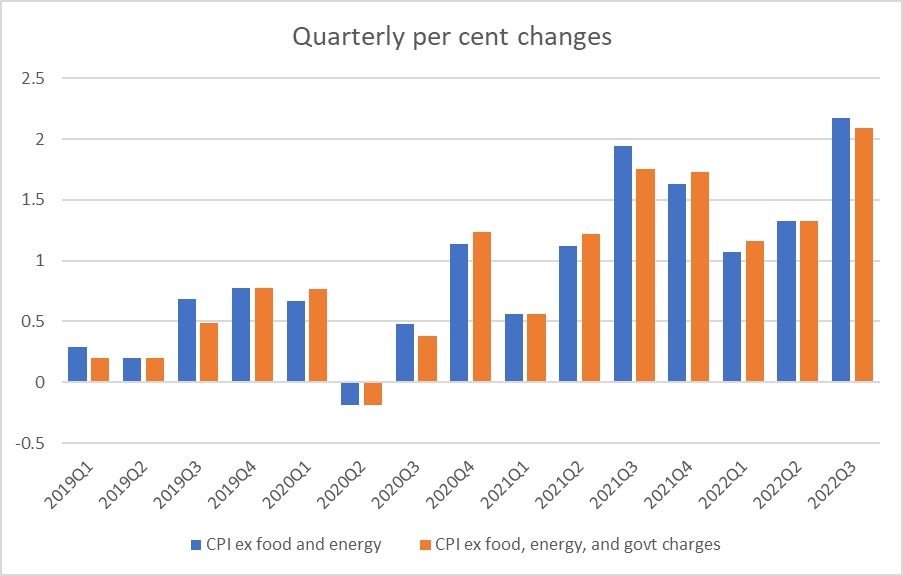
neither of which offers any reassurance.
And the picture here is similar

and from these monthly food price components, a bit of a mixed bag, but at least nowhere near as bad now as a few months ago.

The building market has been one of “hottest” areas of the economy and the labour market, with staggering rates of increases
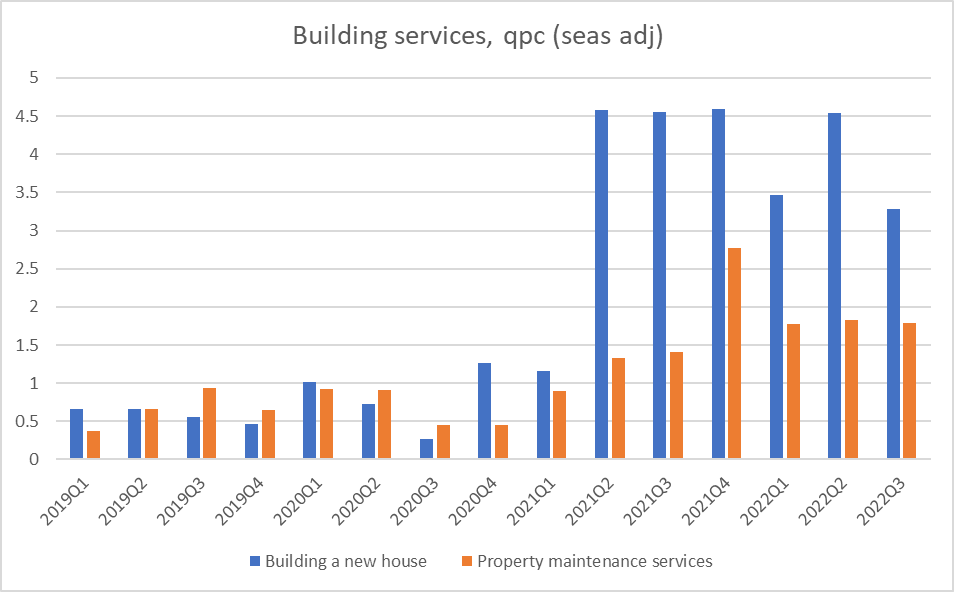
Those numbers are still high but seem to be beginning to move in the right direction.
And then there are rents. Rents now make up just over 10 per cent of the CPI. On a quarterly basis the rents item in the CPI increased by 1.2 per cent in the September quarter, as high (equally high) as it has been this cycle. On an annual basis, this is the picture
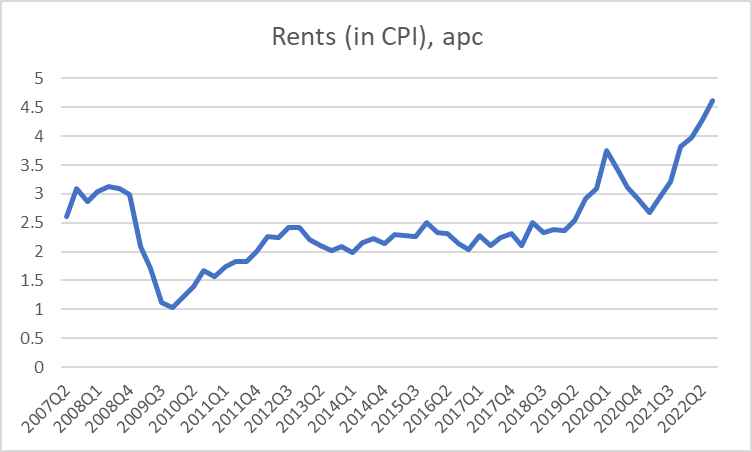
In the CPI rents are included using a stock measure – the rate of increase in the average rents being paid by all tenants. And there is a certain logic to that, but we also know that new rents are falling (not just the growth rate slowing, but the level of rents dropping)
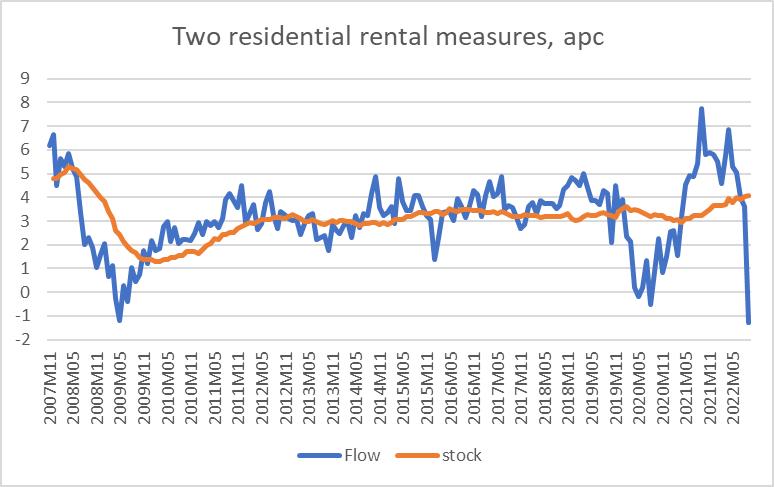
The flow measure – new rents – is (naturally) noisier but it (also naturally) leads the stock measure. There is a lag from monetary policy to the CPI for numerous reasons, but one is the choice to include average prices rather than marginal prices for rents. New rents – the ones policy and market developments affect most immediately – have now been falling for several months.
For completeness, I’m including this chart of the Reserve Bank’s sectoral factor model measure of core inflation.

It used to be the Reserve Bank’s preferred measure (and mine too – I championed it when I was still at the Bank), and it is probably still the single best guide to historical core inflation, but (in the nature of the technique) it is prone to big and lagging revisions when inflation is moving a lot. When the September 2021 CPI came out last October the model estimated core inflation then to have been 2.7 per cent (high, but still inside the target range), but the model – learning from what has happened since – now reckons core inflation last September was already up to 3.8 per cent. At this point, there really isn’t any information (good or ill) in the latest quarterly observations (which in any case use annual rather than quarterly data).
Moving beyond the specific inflation data series, there are a few other considerations that seem relevant to me. The first is to remember the lags (something notably absent from any of the media coverage I heard or read). There are at least two that are relevant. First, the September quarter CPI is really a mid-August measure: there are some noisy components – notably petrol – sampled weekly, and food is captured monthly but the whole thing is centred on 15 August, which is now a bit more than two months ago. So we (and the RB) aren’t exactly using real-time data. And second, the OCR takes time to work – this isn’t in dispute and shows up in all the modelling work – and on 15 August the OCR was 2.5 per cent (it was raised at the MPS a couple of days later). In fact – and it is easy to forget this now – until 12 April, the OCR was no higher than 1 per cent, the level (designed to be somewhat stimulatory) it had been at immediately prior to Covid. Now, of course markets and market pricing anticipated OCR increases to come to some extent, but the market (let alone firms and households) have been repeatedly surprised, constantly revising up their view of what OCR would be required.
I’m also not about to take a view on what the Reserve Bank could or should do in November. Market economists have to, I don’t. There is another round of really important labour market data due out in a couple of weeks (of which the most important bits should be the employment and unemployment numbers rather than wages). Of course, it lags too – centred on mid-August (and I really don’t understand why a household survey collected by phone within a quarter can’t be processed much more quickly than SNZ manages) – but it will still represent an addition to our knowledge. If, for example, the unemployment rate were to have dropped further, the argument for a big OCR increase would inevitably strengthen, all else equal – people will cut central banks less slack now than they might have if we were dealing with core inflation at, say, 3.5 per cent.
But is always going to tempting to just ignore the lags, even after increases in the OCR of unprecedented pace this year. And the lags are real, the lags matter. Robert MacCulloch, macroeconomics professor at Auckland, yesterday reminded us of Milton Friedman’s take on that issue almost 55 years ago.

There was a time for 75 or even perhaps 100 basis point OCR increases – last November or February perhaps – but for now it is much less clear that now is one of those times (and few if any of those now calling for such large increases now were calling for them then).
Of course, it doesn’t help that the MPC chooses to take a long summer holiday. That really should be revisited now.
And just one last graph, since air travel prices were a non-trivial influence in yesterday’s headline (and exclusion) measures. More than a little noise in those series.

