Back in November 2017, just after the government took office, the Reserve Bank in its Monetary Policy Statement identified various assumptions they had made about the impact of various of the new government’s policies. Some of these assumptions made quite a difference to the outlook, but no analysis or reasoning was presented to give us any confidence in the assumptions they were (reasonably or unreasonably) making. One of those new policies was KiwiBuild.
Seeing as the Bank is a powerful public agency, it seemed only reasonable to request copies of any analysis undertaken as part of arriving at the assumptions policymakers were using. The Bank refused and many many months later the Ombudsman backed them up (if ever there was a case for an overhaul of the Official Information Act, this was a good example). The Ombudsman did point out that he had to rule as at the date the request had been made. So, a year having passed, I again requested this material. The Bank again refused (and I haven’t yet gotten round to appealing to the Ombudsman). Quarter after quarter the Monetary Policy Statements talk about KiwiBuild, but we’ve never seen any supporting analysis. A state secret apparently.
Until yesterday that is. In the latest Monetary Policy Statement there was the usual discussion of KiwiBuild – potentially a big influence on one of the most highly-cylical parts of the whole economy – but there was also a footnote pointing readers to an obscure corner of the Bank’s website, and a special background note on KiwiBuild, and the assumptions the Bank is making. All released simultaneous with the statement itself. See, it just wasn’t that hard. And has the sky fallen?
(As it happens I remain rather sceptical of the assumption that KiwiBuild is going to be a significant net addition to total residential investment over the next decade. Why would it, when the main issues in the housing market are land prices and, to a lesser extent, construction costs, and it isn’t obvious how KiwiBuild deals with either of them? If it proves to be a net addition, it will probably be because it is a subsidy scheme for the favoured – lucky – few.)
As for the overall tone of the monetary policy conclusions to the statement, count me sceptical. At one level it is almost always true that the next OCR move could be up or down – and in that sense most forecasting (especially that a couple of years ahead) is futile: useless and pointless. But for the Governor to suggest that the risks now are really even balanced, even at some relatively near-term horizon, seems to suggest he is falling into the same trap that beguiled the Bank for much of the last decade; the belief that somewhere, just around the corner, inflation pressures are finally going to build sufficiently that they will need to raise the OCR. We’ve come through a cyclical recovery, the reconstruction after a series of highly-destructive earthquakes, strong terms of trade, and a huge unexpected population surge, and none of it has been enough to really support higher interest rates. The OCR now is lower than it was at the end of the last recession, and still core inflation struggles to get anywhere 2 per cent. There is no lift in imported inflation, no significant new surges in domestic demand in view, and as the Bank notes business investment is pretty subdued. Instead actual GDP growth has been easing, population growth is easing, employment growth is easing, confidence is pretty subdued, the heat in the housing market (for now at least) is easing. Oh, and several of the major components of the world economy – China and the euro-area – are weakening, and the Australian economy (important to New Zealand through a host of channels) also appears to be easing, centred in one of the most cyclically-variable parts of the economy, construction. It was surprising to see no richness or depth to any of the international discussion – and to see the Bank buying into the highly dubious line that any slowing in China is mostly about the “trade war”. Few other observers seem to see it that way.
From a starting point with inflation still below target midpoint after all these years, it would seem much more reasonable to suppose that if there is an OCR adjustment in the next year or so, it is (much) more likely to be a cut than an increase. Time will tell, including about how long the 1.5 per cent lift in the exchange rate will last.
Commendably, the Bank is now talking openly about many other economies have limited capacity to respond to a future serious downturn. That is welcome acknowledgement, but it would count for more if the Bank were taking seriously the real (if slightly less binding) constraints New Zealand will also face in the next future serious downturn.
A couple of other things in the document caught my eye. One was this chart
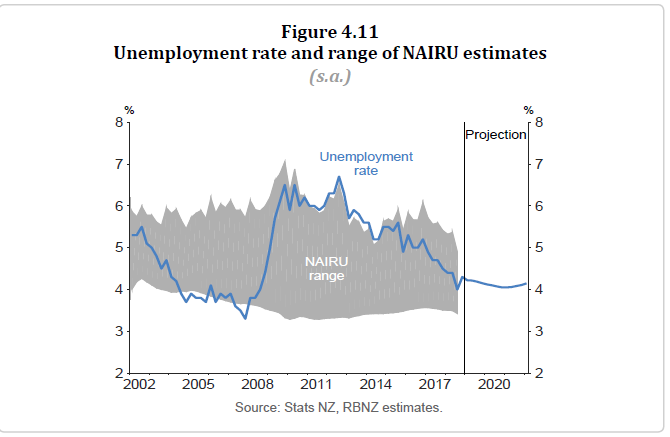
The Bank seems to be trying to tell us that it really has no idea whether the unemployment was above or below the NAIRU at any time in the last 17 years. I don’t suppose in practice they operate that way, but when they present a chart like this it is a bit hard to take seriously the other bits of their economic analysis.
The other specific was some rather upbeat comments on productivity performance in recent years, which has led the Bank to the view that they now to expect no acceleration in productivity growth in the years ahead. The Governor always seems to err on the (politically convenient) upbeat side. I’m not sure quite how the Bank derives their productivity measure – I’m guessing as some sort of per person employed measure – but as a reminder to readers here is the chart of real GDP per hour worked, the standard measure of labour productivity. To deal, to some extent, with the noise in the individual series, I use both measures of quarterly GDP and both (HLFS and QES) measures of hours.

There has been no labour productivity growth for the last three or four years, and little for the last six or seven. I wouldn’t be surprised if the Bank is right to expect no acceleration (on current policies), but if we keep on with near-zero labour productivity growth it is a rather bleak prospect for New Zealanders.
A great deal of the press conference was taken up with questions – generally not very sympathetic – about the Governor’s proposals to increase substantially capital requirements for banks. In the course of the press conference he and Geoff Bascand made some reasonable points – including about the merits of putting the big 4 banks and the smaller banks on a more equal footing in calculating requirements – and at least fronted up on the other questions. It is just a shame this was being done reactively now, rather than pro-actively when the proposals were first released in December.
I remain rather sceptical of the Bank’s case – in which everything is a win-win, in which the economy is safer, more prosperous, and even with lower interest rates. If you doubt that I’m characterising their bold claims correctly, this is the stylised diagram that leads the consultative document.
 It is a free lunch they are claiming to offer. I suspect few will be convinced.
In the course of the press conference, the Governor asserted that the Bank’s proposals will, if implemented, mean that future capital ratio requirements would be “well within the range of norms” seen in other countries. I found that a surprising claim, and there is nothing – not a word – in the consultative document to back it up. If true, it would be material in thinking about the appropriateness of the Bank’s proposals. But where is the evidence (granting that this is something that can’t be answered in a ten second Google search)? I’ve lodged an Official Information Act request for the analysis the Governor is using to support his claim. It would, surely, be in his interests to have such analysis out there.
Also at the press conference, there was the hardy perennial claim that inflation expectations are “well-anchored” at 2 per cent, and everyone believes that monetary policy is just fine. As my hardy perennial response, here are inflation breakevens from the government bond (indexed and conventional) market. The last observation is today’s data.

People with money at stake don’t seem to believe you Governor. Last time things got this low a series of OCR cuts only helped, at least partially, rectify the position.
And, finally, who does the Bank suppose gets any value at all from the cartoon version of the statement? For example

Is the Monetary Policy Statement now a set text in intermediate school? If the kids are especially naughty do they have to read it twice? Even your average MP, sitting on the Finance and Expenditure Committee and supposedly holding the Bank to account, has to be able to cope with a little more than that. I’m not expecting much of the new statutory MPC, but perhaps they could prevail on the Governor to drop the cartoons and simply write in reasonably accessible English?
Later this morning we get the Remit (PTA replacement) and Charter for the new Monetary Policy Committee. I’m sure I’ll have some thoughts about them tomorrow.

Michael
A question for you on the productivity flat line. Is it reflective of levels of investment? How does the productive capital stock per worker look over the last decade?
With all the money going into housing and social/transport infrastructure, I can imagine there isn’t much left to go into plant and equipment. Also, it doesn’t really feel as if productive businesses (other than in the infrastructure sectors) are exactly swamped by growth. That’s probably not unique globally, if your look at the S&P500 sectors which have shown the best performance over the last few years the winners have been tech/media of a type that NZ doesn’t have.
Tim
LikeLike
It is a bit hard to tell from a very quick look at the data, altho (superficially) there seems to have been a bit more capital stock accumulation (per hour worked, or per unit of GDP) than I’d expected. I might try to pull the numbers together in a post tomorrow.
It is certainly true that the tradables sector in aggregate have been going backwards in per capita terms.
Bear in mind that many of those media/tech firms don’t seem to need much investment (at least of the sort captured in the national accounts).
LikeLike
“”when the main issues in the housing market are land prices and, to a lesser extent, construction costs””. Surely the main issue is the money needed to buy which involves interest rates and the deposit from the bank of Mum and Dad which is more easily accessed with modern small families (that’s what I will tell my six kids). When I bought my first property (on an impulse since I didn’t get on well with my flatmate) the problem was UK building societies would only loan to those who had been saving with them and even then there was a quota system so having found somewhere to buy you could wait one or two months for the mortgage. Now it is easy to borrow a deposit from family (who will often be using their own house as security for a mortgage) and low interest rates and enthusiastic banks make it too easy to borrow excessively.
Len Bown once told me the problem was construction costs meaning materials were more expensive than Australia which just shows how politicians can lose all sense of proportion. If by construction costs you mean the entire cost of putting up a new house then you have a good point because the delays and costs involved in consenting are off putting to anyone other than major builders.
LikeLike
Prior to 1984 the finance Environment in NZ was the same as yours in the UK – you had to go to either a building-society or your life insurance company for Finance and your solicitor for a 2nd mortgage – of which you had to be a customer – and both organisations could/would only lend out what funds that had in their bank account.
The world changed when the Banks started taking over the Life Insurance companies and Building Societies
Whoever allowed that to happen should be taken out to sea, put in a chaff-bag and thrown overboard – From memory cant remember if the was a take-over commission or Commerce-Commission looking after you and me – it was the wild-west in those days
LikeLike
The Reserve Bank championed the entry of mainstream banks into the housing finance market (they used to be banned). I happen to still think we were right to do so, and that once we’d done so there was no particular niche for specialist building societies, let alone solicitor’s nominee mortgages.
Since I was very junior at the time, I’ll defer to my then bosses (and, more so, our political masters) as candidates for drowning…….
(As a reminder there is on the statute books that dreadful piece of legislation, the Harmful Digital Communications Act. I suspect the drafters may not look kindly on suggestions of the sort you make…….)
LikeLike
That is the financing side, but they have pretty ready access to finance in fast-growing big cities like Atlanta or Nashville. In Nashville, median house prices are 3.8 times median income, and in Atlanta 3.2 times. Supply conditions really matter.
LikeLike
What you should also mention is that in the USA the basic minimum wage is $7.25 per hour – been that since 2009 – will be a lot of people on the Minimum Wage
LikeLike
$7.25 per hour is a US Federal Minimum wage. US State Minimum wage can be higher up to $11.50 in one state.
LikeLike
Good one
Atlanta is the capital of, and the most populous city in, the U.S. state of Georgia. The Georgia state minimum wage is $5.15. Employees covered under the federal Fair Labour Standards Act are subject to the federal minimum wage of $7.25, but those not covered under the FLSA may be paid the state minimum wage of $5.15
LikeLike
Georgia’s population is only 11 million. California with a state minimum wage of $11.00 has 40 million people.
LikeLike
It was a remarkable document. Virtually no acknowledgement of the string of poor data coming out from across the economy. Most notable to me, the PMI for Services is a good leading indicator of real GDP and it’s already pointing well below the rate cut scenario (as is the ANZ Business Outlook ‘own activity’ index).
I was most surprised by the comment about annual inflation being 1.9% despite the slump in petrol prices. While technically not a ‘lie’ it was a significant untruth. Most people expected petrol prices in the CPI to be much weaker in q4 – as they are tracked off the weekly MBIE fuel price statistics) and the fact they didn’t fall as much in Q4 just means we will see a much weaker Q1.
To argue that downside risks have not increased since the last MPS is clearly wrong and financial markets, after bouncing, are quickly sagging back…
LikeLike
Finally an economics commentator that questions the shaky logic of monetary policy to stimulate or cool any actual economic processes. Also, congrats on calling out the NAIRU for what it is, a scheme to keep an unemployed buffer stock of people for the morally dubious purpose of keeping inflation low. I certainly agree that monetary policy won’t alleviate the next shock (because it can’t alleviate or stimulate anything) but don’t agree that this means nothing can be done.
After the great depression, the unemployed were mobilised into full production for WW2, inflation avoided by draining liquidity via War Bonds and rationing and all this while having our currency pegged to the GBP and having a mountain of debt denominated in GBP (both conditions which don’t exist now). Given a shock, the public sector can afford to pay for anything that is for sale in NZ$, including all employment without the constraints that saw us help beat fascism. Any shock today is easily dealt with by comparison. The real question is, with our tragic productivity, why wait for a shock?
LikeLike
Monetary Policy as historically practiced by an overly trigger happy RBNZ actually creates and compounds the shocks
LikeLike
The Minister of Finance announced his debt conversion plan to Parliament on 28 February 1933. in
introducing the New Zealand Debt Conversion Bill. A further legislation was introduced soon after providing for a 331/3 percent tax on any interest paid on domestic government securities that were not converted under the New Zealand Debt Conversion Act. This provision provided the coercive force in the restructuring, as any holder who did not voluntarily convert would, by Act of Parliament, be made worse off than if he had chosen to convert.
Click to access 2012mar75-1reddell.pdf
A similar legislation was enacted for local government debt.
Overseas lenders were excluded. Looks like NZ has a masochistic streak of self hurt. Punish and rob the locals seems to be the NZ way.
LikeLike
Good (interesting) article. I recommend it…..
LikeLike
Would building more four lane highways between major centres add to the capital stock? And better lightrail infrastructure in Auckland, Wellington and Christchurch? And would this likely boost GDP per person? If so, why not borrow at record low interest rates and invest in future prosperity? I go through Singapore quite frequently, and Switzerland and am amazed at how both countries infrastructure is far superior to ours (all with 5-8m populations)
LikeLike
Those suggestions would add to the capital stock. My own view would be that they would do so in much the same way the Think Big projects did, just destroying value in most cases.
I guess the two big differences between us and Switzerland and Singapore is that (a) they are much richer than we are, and (b) the countries are much more physically compact. We could put in all the fancy roads we like, but it would make little difference to the wealth-generating opportunities available in this remote location (the other important difference).
LikeLike
I agree with your implication that the government is probably not the best of investors to grow an economy. But in comparing with Switzerland, they have a far higher Debt/GDP ratio than us and have done so for many years – about 40-50% vs our aspiration of 20%. https://countryeconomy.com/countries/compare/switzerland/new-zealand?sector=GDP+per+capita+%28Dollars%29&sc=XE34#tbl
I wonder what use they have put their debt to versus how we “choose” to invest ours? Clearly they have become richer than us since 1964 when GDP per capita was roughly equivalent. One observation I have is that they are used to living more compactly/densely which would presumably help keep the per person cost of infrastructure investment down.
LikeLike
Actually Switzerland and NZ have similar net and gross public debts (roughly zero net, all inclusiive) and roughly 40% gross). The number you have in mind for NZ is the net debt target for NZ, which excludes one major class of financial assets (NZSF).
LikeLike
Both Switzerland and Singapore are known Regional Banking/Financial centres(other name is money laundering hubs) with trillions of dollars transacted regularly. Transaction fees keep these financial centres wealthy. There was a period where Sir John Key must have had some visions of NZ playing a Switzerland of the Pacific role as he did coin that name. Remote and isolated locations would not be a factor.
LikeLike
Steve, unfortunately the government is very much involved in investing billions of dollars in Think Big Industry projects. It just chose the Primary industries as its GDP growth engine instead of any other industries. Maori Iwi, directly the recipient of taxpayer funded dollars through Treaty settlements is now a $60 billion Primary Industry juggernaught. In 2017 Chapmann Tripp study shows that Maori owns
40% Forestry
30% Sheep
30% Beef
10% Dairy
50% Fishing
10% Kiwifruit
Click to access 2017%20Chapman%20Tripp%20Te%20Ao%20Maori%20-%20trends%20and%20insights%20E-VERSION.pdf
Of course to enable this to occur, the government fails to invest anywhere else or in any other industries to a viable degree. Can’t even afford Kiwibuild or decent transportation and cant even afford to pay staff decent wage increases.
LikeLike
GGS: from a quick google search: “”The total value of all finalised settlements is $2.2 billion.”” dated Aug 2018. So it is now worth $60 billion – that sounds like great investment by our govt and there was I thinking all that was happening was paying due compensation for breaking the law.
Clearly I was dumb putting my small savings into Kiwisaver and property when I ought to have persuaded various Maori Iwi to invest it for me.
LikeLike
Maori have owned much Maori Land for well over 50 years, trouble was, title was spread over many tribal members. Difficulty was achieving consensus on doing anything. That has changed.
LikeLike
Misinformation
Treaty Settlements are not $60 billion
LikeLike
Bob, if your kiwisaver fund was gifted the $2.2 billion cash plus all that income producing farm land for lamb,cows etc and free forestry land for you to log and sell and free 50% of all the fishing quota rights. I am pretty sure your kiwisaver would be worth $60 billion as well.
LikeLike
Whitecloud, I never said the $60 billion was the sum of the treaty settlements but when you are gifted income producing assets like farm land and forestry land, together with $2.2 billion in cash, then the government has lost that income from those assets. Plain and simple a wholesale transfer of New Zealanders wealth to a minority group. That $60billion could have stayed in crown ownership so that the income could have been used to the benefit of all New Zealanders.
LikeLike
GGS says – “Maori Iwi, directly the recipient of taxpayer funded dollars through Treaty settlements is now a $60 billion Primary Industry juggernaught”
You claim the entire $60 billion is taxpayer funded – whether by treaty or not
That is misinformation
LikeLike
Treaty settlements consist also of income producing farm land, forestry land and fishing quoto plus cash which have directly led to a substantial growth over the decades. So not at all misleading.
LikeLike
FYI
The NZ Land Act was legislated in 1848
The Native Lands Act was legislated in 1858
The Maori Land Court was established in 1865 as the Native Land Court of NZ under the Native Lands Act of 1858
Most Maori-owned land was sold during the economic recession of the 1890’s. 2.7 million acres was sold to the government and 400,000 acres to private individuals
By 1939, almost 100 years after the treaty was signed, Maori retained 1% of the South Island and 9% of the North Island
Maori land still owned today comprises some of that 9%
How much is 9% of the entire North Island worth in todays Dollars
The point is most of the land under question was owned prior to the current treaty settlements which amount to $10 billion
https://en.wikipedia.org/wiki/M%C4%81ori_Land_Court
LikeLike
Whitecloud, you can’t keep making NZ children pay for the sins of the great great grand fathers and of the great British Empire otherwise it will always be Maori against the rest of NZ. It is about time to either call everyone Aoteroans or call everyone New Zealanders. You can’t keep harping about Maori as a separate Sovereign nation with separate treatment otherwise we keep perpetuating these racist Maori policies. NZFirst was formed to start to disband some of these racist government Maori policies. But unfortunately Winston Peters is suffering from dementia.
LikeLike
A comment on the stylized stability curve – the RBNZ tradeoff between growth and stability.
Consider the proposition that the current (red-dot) position may in fact lie between the blue and green dots. So a move from current to the growth maximisation would imply less stability, and a move to more stability will come at the cost of lower growth. To me, this is more likely than the relativities shown by the RBNZ.
LikeLike
getgreatstuff – all good points and no argument here. Michael, the NZSF is a good point to raise. A quick check shows $37.4bn in assets with $5.8bn invested in NZ. Perhaps a pity there isn’t more confidence to invest it the other way around.
LikeLike
Investing $30+ billion offshore, the NZSF promoting job creation in those countries and NOT in NZ
LikeLike
[…] few days ago one of my posts included the chart showing that there has been very little labour productivity growth in New […]
LikeLike
[…] In the wake of the Reserve Bank’s Monetary Policy Statement in February I wrote […]
LikeLike