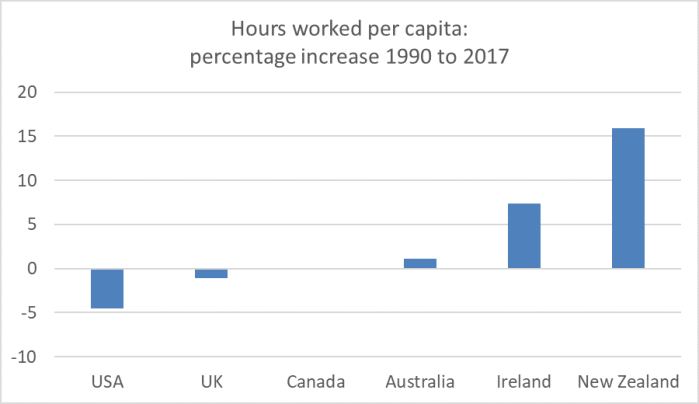
The other day, for some reason, I was looking back at the records of this blog, and got curious about which posts had had the most specific views. It turned out that for some reason (I think it got linked to overseas) this early post – about how New Zealand’s economy had done relative to other advanced countries since 2007 – was the “winner”. Rereading the post, I lit upon this chart

As I noted then
Hours worked are an input (which comes at a cost) not an output, so higher hours worked aren’t automatically a good thing. There are good dimensions to it, if (for example) people are coming off long-term welfare back into the workforce, or older people are keen and able to stay in the workforce. Hours worked per capita also gets affected by different demographic patterns – they will be lower in countries with lots of under-15s or over 70s. But, equally, part of the story of New Zealand in the last 25 years is that we have managed to limit the deterioration in our GDP per capita, relative to that in other countries, by working more. Productivity would be better.
Over the full period since 1990, here is the change in hours worked per capita for New Zealand and the other Anglo countries, countries with reasonably similar demographics to our own.
1990 was the year just prior to a recession in many countries, including New Zealand, and is a not uncommon jumping-off date for looking at the experience of New Zealand since the reform era.
Since the post was almost four years old, I was curious whether anything much had changed. Here is the same chart, using data from the Total Economy Database maintained by the Conference Board.
Something of a recovery in Ireland, but otherwise not much. The difference between New Zealand and the other countries in the chart isn’t mainly a cyclical story, but even in the last decade a larger proportion of New Zealand’s per capita GDP growth has come from working more hours (per capita).
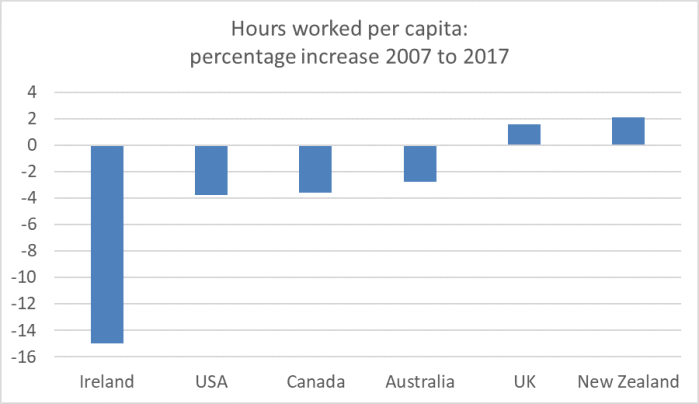
(Interestingly, the UK labour productivity growth record over that decade has been even worse than that of New Zealand.)
I had a quick look at a wider group of advanced economies (OECD + EU + Singapore and Taiwan). For the full period since 1990 there isn’t complete data for all countries (gaps mostly the former Communist countries of central and eastern Europe), but of the 32 countries for which there is data, hours worked per capita dropped by 1 per cent for the median country (up 16 per cent in New Zealand). For the more recent period, where there is full data, the median country spent 2 per cent fewer hours per capita working, while in New Zealand median hours per capita increased by 2 per cent.
(For those interested, there is a group of countries (Singapore, Hungary, Israel, Chile, Mexico, Poland) where hours per capita have increased materially more than in New Zealand over the last decade.)
I am not trying to draw any particular policy conclusions from these numbers, just to highlight them. And it is not as if New Zealanders had been leisured people at the start of the period and were only now getting back to advanced country norms. In fact, by 2017 we had among the highest hours worked per capita of any of the 40+ countries in my sample (Singapore is off-the-charts high, and South Korea comes second).
As a reminder, hours worked are an input not an output. High (or increasing) hours worked is generally not some achievement to be celebrated, although there can be some caveats to that.
If the unemployment rate had been particularly high at the start of the period, one might genuinely welcome it dropping. Involuntary unemployment is, almost by defintion, a bad thing. But when my comparisons started (in 1990) New Zealand’s unemployment rate was about the middle of the pack for the Anglo countries in the charts (by 2007 we had the lowest unemployment rate of any of them).
If you are uneasy that the welfare system accommodates too many people not working who should be providing for themselves, then successful welfare reforms might increase average hours worked per capita and that might then be regarded as a good thing – whether fiscally, socially or whatever. The proportion of working age adults on welfare benefits (ie including the unemployed) did drop quite bit in the 1990s and early 2000s. But it was 10 per cent in 2007 and it was still 10 per cent in 2018.
Tax system provisions (or the interaction with pension rules) can also deter people from working when they might otherwise choose to. New Zealand has a public pension system that specifically does not deter people from staying in the workforce after age 65 if they so prefer, and between 1990 and 2007 we increased the NZS eligibility age by a whole five years. Personally, I think that was a desirable change, but the fact remains that high and rising hours worked per capita has not been a complement to some stellar productivity performance and improving opportunities.
In aggregate, more New Zealanders have been working more hours to – in effect – offset some of the relative income loss that our disappointing productivity performance would otherwise have led to. As a country, our tenuous grip on upper-income status (really not much more than upper middle-income these days) is sustained only by working ever harder. That might be, in some sense, an appropriate second-best (for the individuals making those choices, reluctantly or otherwise). It is not obviously any sort of first-best outcome.
