There was an article on Stuff the other day from Kirk Hope, head of Business New Zealand, suggesting (in the headline no less) that “the idea [New Zealand] is a ‘low-wage economy’ is a myth”. I didn’t even bother opening the article, so little credence have I come to give to almost anything published under Hope’s name (when there is merit is his argument, the case is almost invariably over-egged or reliant on questionable numbers). But a few people asked about it, including a resident young economics student, so I finally decided to take a look.
Hope attempts to build his argument on OECD wages data. I guess it is a reasonable place to try to start, but he doesn’t really appear to understand the data, or their limitations, including that (as the notes to the OECD tables explicitly state) the New Zealand numbers are calculated differently than those of most other countries in the tables.
The reported data are estimated full-time equivalent average annual wages, calculated thus:
This dataset contains data on average annual wages per full-time and full-year equivalent employee in the total economy. Average annual wages per full-time equivalent dependent employee are obtained by dividing the national-accounts-based total wage bill by the average number of employees in the total economy, which is then multiplied by the ratio of average usual weekly hours per full-time employee to average usually weekly hours for all employees.
That seems fine as far as it goes, subject to the limitation that in a country where people work longer hours then, all else equal, average annual wages will be higher. Personally, I’d have preferred a comparison of average hourly wage rates (which must be possible to calculate from the source data mentioned here) but the OECD don’t report that series (and I don’t really expect Hope or his staff to have derived it themselves). Although New Zealand has, by OECD standards, high hours worked per capita, we don’t have unusually high hours worked per employee (the reconciliation being that our participation rate is higher than average) so this particular point probably doesn’t materially affect cross-country comparisons.
The OECD reports the estimated average annual wages data in various forms. National currency data obviously isn’t any use for cross-country comparisons, so the focus here (and in Hope’s article) is on the data converted into USD, for which there are two series. The first is simply converted at market exchange rates, while the second is converted at estimated purchasing power parity (PPP) exchange rates. Use of PPP exchange rates – with all their inevitable imprecisions – is the standard approach to doing cross-country comparisons.
Decades ago people realised that simply doing conversions at market exchange rates could be quite misleading. One reason is that market exchange rate fluctuate quite a lot, and when a country’s exchange rate is high, any value expressed in the currency of that country when converted into (say) USD will also appear high. Take wages for example: a 20 per cent increase in the exchange rate will result in a 20 per cent increase in the USD value of New Zealand wages, but New Zealanders won’t be anything like that amount better off. The same goes for, say, GDP comparisons. That is why analysts typically focus on comparisons done using PPP exchange rates.
But not Mr Hope. Using the simple market exchange rate comparisons, he argues
OECD analysis however shows that NZ is not a low-wage economy. We sit in 16th place out of 35 countries in terms of average wages.
(Actually, I count 14th. And recall that it isn’t many decades since we were in the top 2 or 3 of these sort of league tables.)
But he does then turn to the PPP measures, without really appearing to understand PPP measures.
But the OECD analysis also shows that among those countries our relative Purchasing Power Parity (PPP), a measure of how much of a given item can be purchased by each country’s average wage, is lower.
New Zealand is included among a group of countries – Australia, Denmark, Iceland, Norway, Sweden, Switzerland and the UK – where wages don’t buy as much as they could.
That’s right: Australia – where the grass has always been deemed to be greener, and Switzerland – which has long been lauded for its quality of life.
There are several possible explanations for wages in this group being higher than their PPP.
The Nordic countries have high tax rates, which support their social infrastructure but dilute their spending power.
We have lower tax rates – but the costs of housing, as an obvious example, are a lot higher in PPP terms than in other countries.
In PPP terms, the estimated average annual wages of New Zealand workers, on these OECD numbers, was 19th out of 35 countries. The OECD has expanded its membership a lot in recent decades – to bring in various emerging economies, especially in eastern Europe (the former communist ones). But of the western European and North American OECD economies (the bit of the OECD we used to mainly compare ourselves against), only Spain, Italy, and (perpetual laggard) Portugal score lower than New Zealand. On this measure.
But to revert to Hope’s analysis, he appears to think there is something wrong or anomalous about wages in PPP terms being lower than those in market exchange rate terms. But that simply isn’t so. In fact, it is what one expects for very high income and very productive countries, even when market exchange rates aren’t out of line. In highly productive economies, the costs of non-tradables tend to be high, and in very poor countries those costs tend to be low (barbers in Suva earn a lot less than those in Zurich, but do much the same job). Poor countries tend to have PPP measures of GDP or wages above those calculated at market exchange rates, and rich countries tend to have the reverse. It isn’t a commentary on policy, just a reflection of the underlying economics.
Tax rates and structures of social spending also have nothing to do with these sorts of comparisons. They might be relevant to comparisons across countries of disposable incomes, or even of consumption, but that isn’t what Hope is setting out to compare.
But he is right – inadvertently – to highlight the anomaly that in New Zealand, PPP measures are below those calculated on market exchange rates. That seems to be a reflection of two things: first, a persistently overvalued real exchange rate (a long-running theme of this blog), and second, the sense that New Zealand is a pretty high cost economy, perhaps (as some have argued) because of the limited amount of competition in many services sectors.
But there is a more serious problem with Hope’s comparisons, one that presumably he didn’t notice when he had the numbers done. I spotted this note on the OECD table.
Recommended uses and limitationsReal compensation per employee (instead of real wages) are considered for Chile, Iceland, Mexico and New Zealand.
Wages and compensation can be two quite different things. If so, the comparisons across most OECD countries won’t be a problem, but any that involve comparing Chile, Iceland, Mexico or New Zealand with any of the other OECD countries could be quite severely impaired. In many respects, using total compensation of employees seems a better basis for comparisons that whatever is labelled as “wages” – since, for example, tax structures and other legislative mandates affect the prevalence of fringe benefits – but it isn’t very meaningful to compare wages in one country with total compensation in another.
Does the difference matter? Well, I went to the OECD database and downloaded the data for total compensation of employees and total wages and salaries. In the median OECD country for which there is data for both series, compensation is about 22 per cent higher than wages and salaries. I’m not 100 per cent sure how the respective series are calculated, but those numbers didn’t really surprise me. Almost inevitably, total compensation has to be equal to or greater than wages. (There is an anomaly however in respect of the New Zealand numbers. Of those countries where compensation is used, New Zealand is the only one for which the OECD also reports wages and salaries. The data say that wages and salaries are higher than compensation – an apparently nonsensical results, which is presumably why the OECD chose to use the compensation numbers.)
So what do the numbers look like if we actually do an apples for apples comparison, using total compensation of employees data for each country. Here I’ve approximated this by scaling up the numbers for the countries where the OECD used wages data by the ratio of total compensation to total wages in each country (rather than doing the source calculations directly).

On this measure, New Zealand comes 24th in the OECD, with the usual bunch behind us – perpetual failures like Portugal and Mexico on the one hand, and the rapidly emerging former communist countries on the other. On this estimate (imprecise) Slovenia is now very slightly above New Zealand. By advanced country standards, we are now a low wage (low total employee compensation) country.
But it is about what one would expect given New Zealand low ranking productivity performance. Here is a chart showing the relationship between the derived annual compensation per (FTE) employee (as per the previous chart) and OECD data on real GDP per hour worked for 2016 (the most recent year for which there is complete data). Both are expressed in USD by PPP terms.
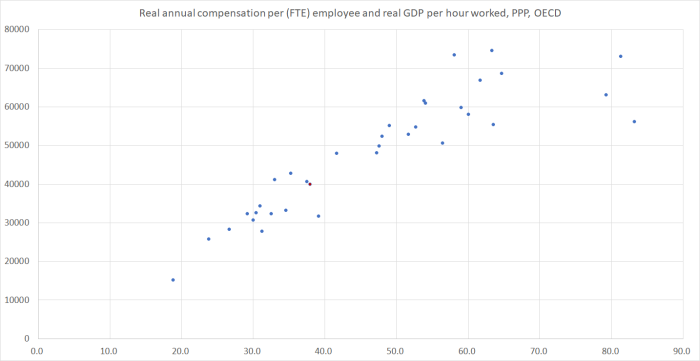
Frankly, it is a bit closer relationship than I expected (especially given that one variable is an annual measure and one an hourly measure). There are a few outliers to the right of the chart: Ireland (where the corporate tax rules resulted in an inflated real GDP), Luxembourg, and Norway (where the decision by the state to directly save much of the proceeds from the oil wealth probably means wages are lower than they otherwise would be). For those with sharp eyesight, I’ve marked the New Zealand observation in red: we don’t appear to be an outlier on this measure at all. Employee compensation appears to be about what one would expect given our dire long-term productivity performance.
And that appears to be the point on which – unusually – Kirk Hope and I are at one. He ends his article this way
We need to first do the hard yards on improving productivity, and then push for sustainable growth in wages.
If we don’t fix the decades-long productivity failure, we can’t expect to systematically be earning more. Sadly, there is no sign that either the government or the National Party has any serious intention of fixing that failure, or any ideas as to how it might be done.
Incidentally, this sort of analysis – suggesting that employee compensation in New Zealand is about where one might expect given overall economywide productivity – also runs directly counter to the curious argument advanced in Matthew Hooton’s Herald column the other day, in which he argued that wages were being materially held down by the presence of Working for Families. In addition, of course, were Hooton’s argument true then (all else equal) we’d should expect to see childless people and those without dependent children dropping out of the labour force (discouraged by the dismal returns to work available to those not getting the WFF top-up). And yet, for example, labour force participation rates of the elderly in New Zealand – very few of whom will be receiving WFF – are among the highest in the OECD and have been rising.
And, of course, none of this is a comment on the merits, or otherwise, of any particular wage claim.
