On the face of it, the CPI numbers released earlier in the week seemed quite noteworthy. The Reserve Bank’s preferred sectoral core measure of CPI inflation is still clearly below the 2 per cent the Bank has been told to focus on, and was last at 2 per cent in the year to December 2009, almost a decade ago. But the sectoral core measure has increased again, now up to 1.7 per cent, having averaged about 1.4 per cent (without a lot of short-term noise) for the previous five years. If the trends suggested by this series continue, sectoral core inflation could be back to 2 per cent some time next year.

That would, all else equal, represent good news not bad (after all, three successive governments now have taken the view that a target midpoint of 2 per cent inflation is best for New Zealand).
But even on this series alone there is still some reason for caution. The sectoral factor model filters the data, and the nature of the filter means the endpoint estimates (in particular) are prone to revision, and as the paper I just linked to illustrates there are margins of error around any of these estimates. I’m reluctant to back away from the sectoral factor model numbers – it has generally been quite a good guide in the years since it was introduced, and tells plausible stories about history. But, equally, it doesn’t make sense to focus only on this one series.
For example, the CPI ex-petrol is a very simple core measure. Petrol prices are quite volatile.
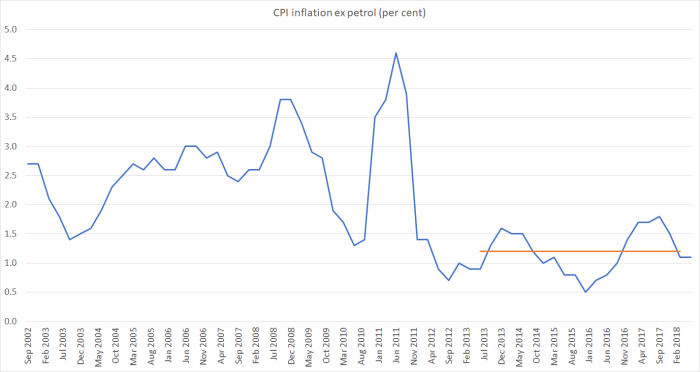
And yet the latest observation in this series is still a touch below the average inflation rate for the previous five years (and at 1.2 per cent well below the target midpoint). And that is so even though the exchange rate has been unusually high in the last 12-18 months (headline CPI is sensitive to changes in the exchange rate).
There isn’t much sign of rising core inflation being an issue abroad either. Here is the OECD data on CPI inflation ex food and energy, for the G7 grouping as a whole, and the median of the countries/areas with their own currencies (thus the euro area, like the US, is just one observation).

Both series bounce around a bit, but there isn’t much sign of any sort of breakout to a consistently higher rate of inflation. Even among the G7, the latest observations suggest that if US core inflation is edging up a bit, that in the UK and the euro-area is falling back a bit (Japan’s June numbers aren’t available yet).
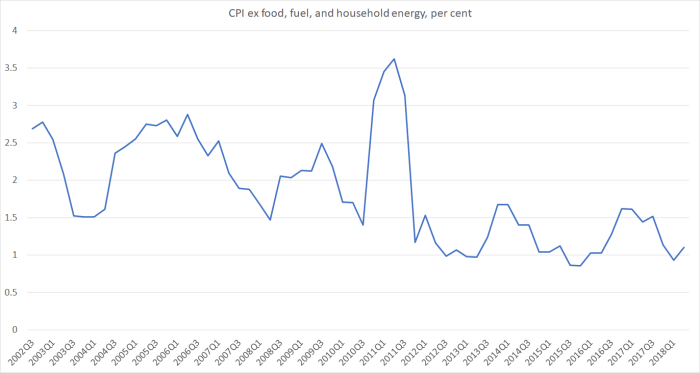
New Zealand might be different of course. It isn’t obvious why we would be – eg our unemployment rate hasn’t fallen away further or faster than those in most other OECD countries – but we might. Here is the NZ version of the same series: CPI inflation ex food, vehicle fuels, and household energy.
Indirect taxes and government charges also complicate the interpretation of the inflation numbers. Weirdly, SNZ still does not publish a straightforward series excluding these effects, to give us a clean read on market prices. It is not as if these are trivial issues either – there was the GST increase a few years ago, there are large increases in tobacco taxes every year (which have had the effect of materially increasing the tobacco weight in the CPI), and there are changes in things like ACC levies and (this year) in government subsidies for tertiary fees.
Here are some individual exclusion measures.

And here is a series SNZ does publish: non-tradables inflation excluding both central and local government charges and tobacco.
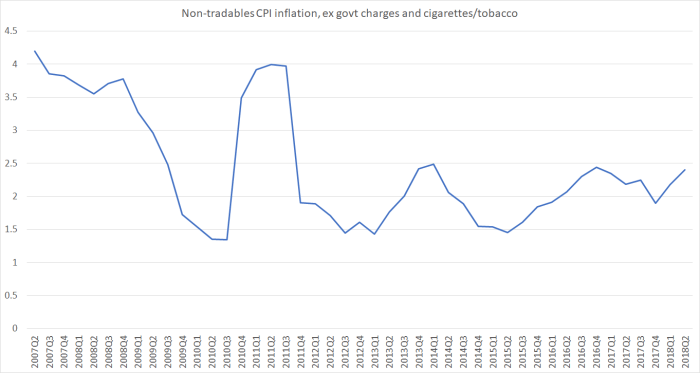
That might suggest a moderately encouraging story, of core non-tradables picking up. But even if so, it would be the third pick-up in the past five or six years, and neither of the previous ones amounted to much. Perhaps this time will be different?
One reason to think it might be a little different is developments in housing inflation: construction costs and rents make up quite a substantial proportion of non-tradables.

Rents are a much larger component of the CPI (9.2 per cent) than construction costs of new houses (5.5 per cent) but most of the cyclical fluctuations are in the construction cost component. Construction cost inflation has been dropping away quite markedly since the start of last year (and for all the talk of renewed waves of housebuilding – which I rather doubt will happen) there isn’t any obvious reason to think that phase of the cycle will reverse soon. Some of the earlier increases in core non-tradables inflation will have reflected increasingly high inflation in construction costs, but since construction costs have been slowing for the last 18 months, the latest pick-up can’t be simply written off as a construction story. But, whatever the story, core non-tradables inflation of only around 2.4 per cent is simply not going to be high enough to be consistent with core CPI inflation getting back to 2 per cent. We’d need to see further increases in core non-tradables inflation from here, and with the rate of growth of demand having weakened it isn’t yet obvious that that is the most likely outcome.
And what do the bond markets make of the situation? Recall that there are two indexed bond maturities either side of the 10 year nominal bond.
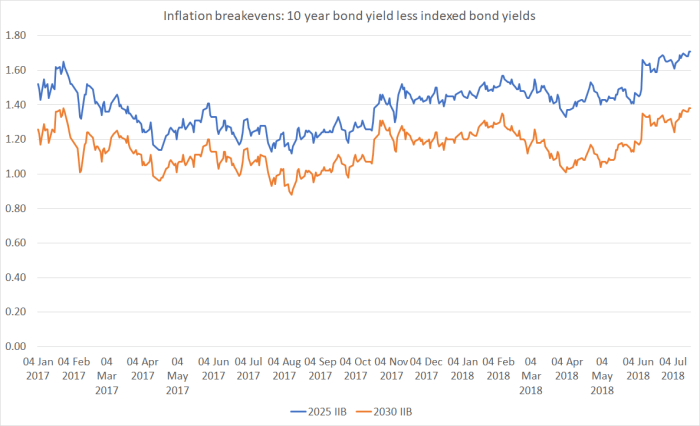
There has been some drift high in the inflation breakevens, or implied inflation expectations, over the last 12 months or so. But however one looks at things, it is hard to see the market pricing average inflation for the next decade much higher than about 1.6 per cent. That is still a long way from the target midpoint of 2 per cent.
So where does all that leave me? At very least, there is no sign that core inflation is falling and perhaps some reason to be encouraged, and to think it is picking up. But however one looks at the numbers, current core inflation isn’t even close to 2 per cent, and by this stage of a long-running cycle (especially one characterised by weak productivity growth) one might have hoped – even expected – that core inflation might be running a bit above any target midpoint. Notwithstanding the sectoral core measure, it seems too early for too much encouragement – perhaps things are finally on course for a return to 2 per cent, but there are conflicting signs, and not too many compelling reasons to yet think that this time will be different.
What of the outlook? With ebbing population pressures, weak business confidence, no fixes for the over-regulated and dysfunctional urban land markets, and various policy proposals that not only engender uncertainty but could act as considerable drag on actual and potential growth (eg net zero emissions targets), it isn’t obvious why core inflation is likely to rise from here. Headline measures will, as always, be tossed around by oil prices developments (and petrol taxes), and a weakening exchange rate will push prices up a little. Some might argue that public sector wage pressures, and higher minimum wage rates, will themselves contribute to higher domestic inflation. Perhaps so, although I remain a bit sceptical that they will amount to much (even if there are some material relative price changes). And, although no one knows when, the next recession is coming – here and abroad. From an inflation perspective, including positioning ourselves for the next downturn, we’d have been better off if the OCR had been a bit lower over the last couple of years
