Pottering in the IMF WEO database yesterday, I found myself looking at savings and investment trends. Here is chart for advanced countries as a group, with the data expressed as a percentage of GDP.
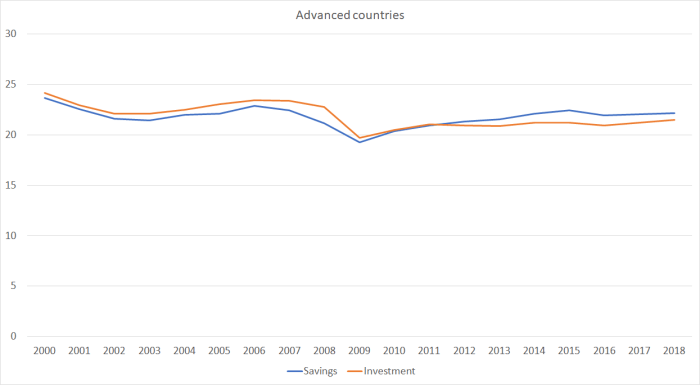
In some ways, it is quite a remarkable chart – remarkable for what isn’t there. Over the entire period I’ve shown – 2000 to (estimates for) 2018 – the gap between the aggregate savings rate and the aggregate investment rate has only twice exceeded 1 per cent of GDP. The measures for the world as a whole – where savings and investment have to equal each other, if correctly measured – isn’t much less variable. It is almost as if the advanced world countries just trade with and borrow from or lend to each other. For what it’s worth, both investment and savings rates – the former specially – are now lower than they were in 2007. That probably isn’t too surprising, given demographic trends and weak productivity growth.
And, of course, the aggregate chart covers a huge amount of variation in individual country experiences. 2007 was the peak of the last boom. Here is a chart, by country, of the change in the gap between savings and investment rates from 2007 to 2018.
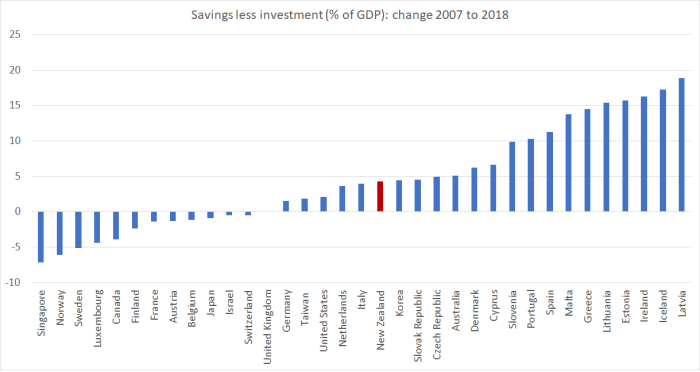
Broadly speaking, current account deficits and surpluses have narrowed in advanced countries (eg Singapore’s surplus has shrunk a lot, and Latvia’s deficits have shrunk). But, as the first chart shows, almost all that adjustment looks to have occurred within the advanced country grouping. As it happens, New Zealand is the median country on this chart.
Of course, it isn’t so different in the rest of the world taken together – the IMF’s class of emerging markets and developing countries. Here is the aggregate savings and investment chart for that large group of countries.
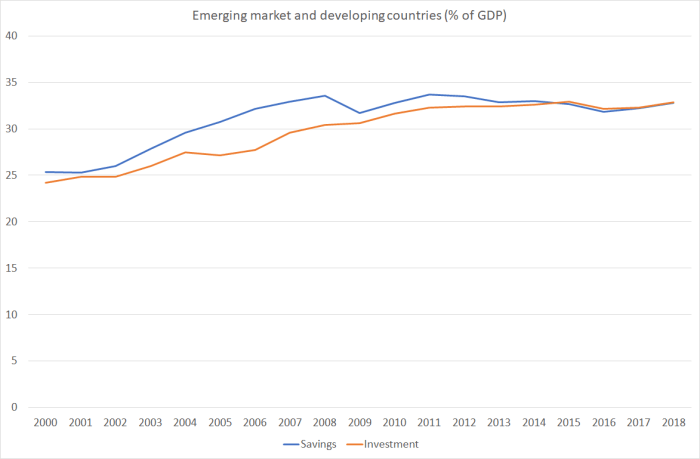
There was a big increase in both savings and investment shares in the 2000s, and if anything the aggregate investment share – already far higher than in the advanced world – still appears to have been trending upwards more recently. (The picture isn’t much different if one simply looks at Asia – often the focus of discussions about big imbalances.)
In the emerging/deveoping country group, there has been a bit more variability in the gap between savings and investment rates – or at least there was in the peak boom years prior to 2008 – but both at the start of the period and at the end, just like advanced countries as a group, emerging and developing countries as a group are basically financing all their own investment. Again, there is huge variability in individual countries’ experiences – China comes to mind, but so too do places like Argentina and Turkey. But in aggregate – and despite all the talk – the advanced world finances itself and the emerging/developing world does the same.
I’m sure there are learned articles around on this issue (which I don’t have time today to try to track down) but it isn’t at all what (very) simple theory would have predicted. There isn’t any simple obvious reason why savings and investment patterns should have tracked so closely within these aggregate groupings of countries, and yet not between individual countries. It wasn’t, for example, how things were between the advanced and emerging economies in the late 19th century. But it has been for the last couple of decades, and IMF projections don’t suggest they expect any change in the next five years.
I might try to dig out some articles addressing the issue, give it some more thought, and perhaps write another post down the track trying to better understand this pattern.

Maybe the colonial current account pattern is still going on, but reflects modern power relations. Germany (in the coloniser role) runs a surplus with Southern Europe (playing the colony). China runs a big surplus with the developing world (think Pakistan or Sri Lanka). The exception is the US which must run a deficit because of the USD’s reserve currency status. This allows Japan and Taiwan to run a surplus.
LikeLike
When you invest in a investment fund whether its through kiwisaver or other investment funds, you tend to select a balanced investment option which usually equates to 10% in cash savings and 40% in Fixed deposit income which is usually fixed deposit savings accounts. Hopefully the RBNZ has not double counted the portion of kiwisaver investment or other investment funds that goes into savings.
LikeLike
…hmm; how about: capital markets and banking systems within the two groups have become increasingly sycnorised over the past two decades??
LikeLike
Feldstein-Horioka puzzle. 1980.
LikeLike
Yes, but FH was really about individual countries, where there is a fair degree of diversity and largish s/I balances, whereas this is mostly about these two huge groupings: advanced countries and the rest.
LikeLike
I find this one of the more interesting subjects and would be interested in any enlightening conclusions drawn. From my own reading the following statements are true,
1) Saving always equals Investment, it’s an accounting identity.
1a) The difference between S and I in GDP accounts is entirely due to S measuring private sector rather than total saving in the economy (e.g Government and external sector saving is excluded).
2) The commonly held idea that saving and investment are aligned by interest rate adjustments (in a supposed market for loan able funds) is and always was a work of fiction.
This is mostly explained by the link,
Click to access v_2008_10_31_moore_2.pdf
LikeLike