Over on Kiwiblog I noticed a chart showing that average real GDP growth in New Zealand over the three years 2014, 2015 and 2016 had been faster (quite a bit faster) than any of the selected small group of other countries shown. In fairness, the chart shows some of the larger OECD economies – all of whom are richer than us already.
But, of course, it makes no allowance for the fact that our population growth rate has been far higher than those of almost all other OECD countries. Per capita income is what counts – for almost any serious purpose. Here is how we have done over those three years (I’ve taken total growth from the level in 2013 to the level in 2016, thus capturing the three years the Kiwiblog chart does).

You can discount the Irish number (which goes off the chart – they’ve had a strong recovery, but some tax-driven factors have also distorted their national accounts numbers). We and the Netherlands have been the median countries. Nothing spectacular. Nothing disastrous either. Just middling. And so making no progess at all in closing the gaps to the rest of the OECD.
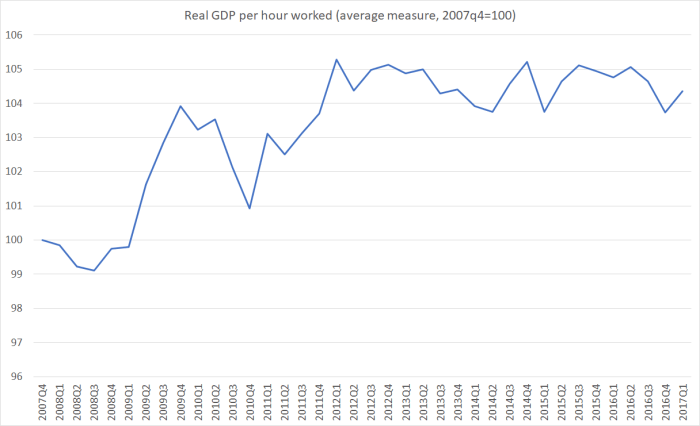
And then, of course, how one grows matters. One can work longer hours, or one can capture the benefits of productivity gains (doing things smarter, doing things with more capital). Regular readers here know the New Zealand story. We’ve had no productivity growth at all – not just for three years, but for five years. Let it sink in…….none at all for five years.
Even the Minister of Finance seemed prepared to concede the other day that, just possibly, it might be a bit of an issue.
UPDATE: Take this chart with a pinch of salt. The OECD doesn’t have productivity numbers for all its member countries for 2016 yet, and revisions are always possible. And three years is, any case, only just getting long enough to look through some of the noise in the data. But for what it is worth here is labour productivity growth for the same period as the GDP per capita chart above, for the countries for whom the OECD reports the data.

We don’t score well – absolutely (previous chart of NZ data only) or relative to our advanced country peers.

When kiwi presence with the overwhelming numbers of people and NZ flags in Bermuda for the Americas Cup even though it is 31 hours flight, I am not at all surprised by our poor productivity performance. For Americans it would be less than a hour away and they could not even garner enough support for the Americas Cup event.
LikeLike
Since migrating to NZ and my 30 years in the NZ workforce, the dominant activity is actually planning the next holiday. Whether it’s a trip up to the islands or need to get out to the holiday Bach or the next fishing trip on the boat parked in the garage.
LikeLike