I’ve shown previously various iterations of this chart, real GDP per hour worked for New Zealand and Australia.
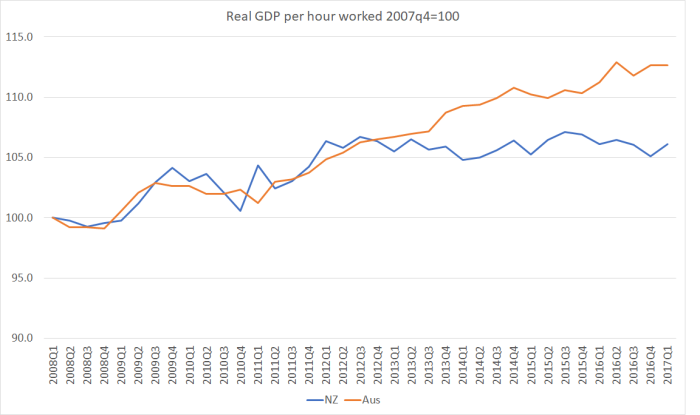
It isn’t exactly an encouraging picture for New Zealand. Then again, it is also a bit surprising. For all of New Zealand’s underperformance over the decades, we haven’t usually diverged that badly from Australia over such a short period (the last four years or so).
That chart is for the whole of each economy, and just uses a crude measure of total hours worked. The ABS and SNZ also produce annual data – with quite a lag – in which they look only at the more readily measureable market sector of the economy (from memory around 85 per cent of the economy) and also attempt to adjust for changing labour quality over time (eg improvements in education and thus, in principle, human capital).
Here is that chart for labour productivity, indexed to 1000 in 1997/98, the first year for which the data are available for both countries.
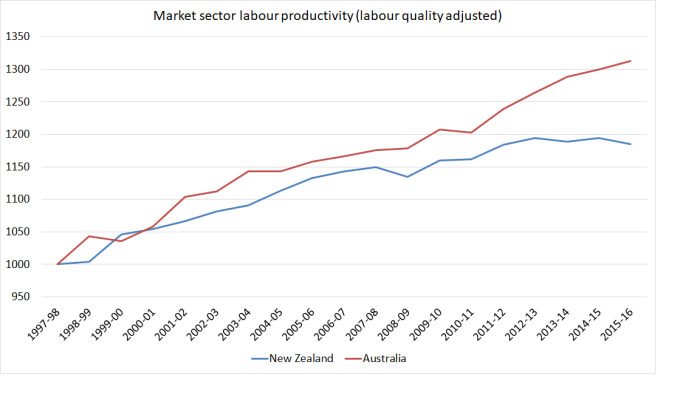
The picture is much the same – a new large gap has opened, in Australia’s favour, in the last few years.
Presumably part of those measured productivity gains in Australia reflects the massive private sector investment boom in the minerals and energy sectors that peaked back in 2011/12.
But out of curiosity I wondered how Australia had done recently relative to other advanced economies. Using annual data from the OECD, percentage total growth in real GDP per hour worked over the five years 2011 to 2016 had been as follows:
Australia 5.3%
OECD Total 6.3% (and OECD median country, 5.7%)
G7 5.5%
EU 4.3%
Even the euro-area as a whole (2.5 per cent) just beat out New Zealand (2.3 per cent). In that light, Australia’s relatively strong productivity performance didn’t look so anomalous at all.
Over that five year period, these are the OECD countries that managed more than 10 per cent productivity growth: Estonia, Hungary, Korea, Latvia, Poland, Slovakia, and Turkey. In fact every single one of the emerging OECD countries (the former eastern bloc countries and Korea) – all with lower initial levels of productivity than New Zealand – managed stronger productivity growth than New Zealand did. All but Slovenia had faster productivity growth than Australia. That is what convergence – supposedly the goal for New Zealand – is supposed to look like.
Of course, several of these emerging countries had had a much worse experience – even on productivity, which often isn’t very cyclical – than New Zealand over the crisis/recession period around 2008/09. But even if one looks at, say, the last decade as a whole, they are mostly catching up (often quite rapidly) and we are not. In fact, relative to Australia – typical closest comparator, and the place where so much of the New Zealand diaspora dwells – we are getting further behind.
I ran a chart a few weeks ago about how low investment has been in New Zealand. As I noted of business investment it “is now smaller as a share of GDP than in every single quarter from 1992 to 2008. And this even though our population growth rate has accelerated strongly, to the fastest rate experienced since the early 1970s.”
Of course, an important story out of Australia is how business investment has fallen back since the peak of the mining investment boom. Here is the business investment proxy (total investment less general government investment less residential investment) for the two countries.
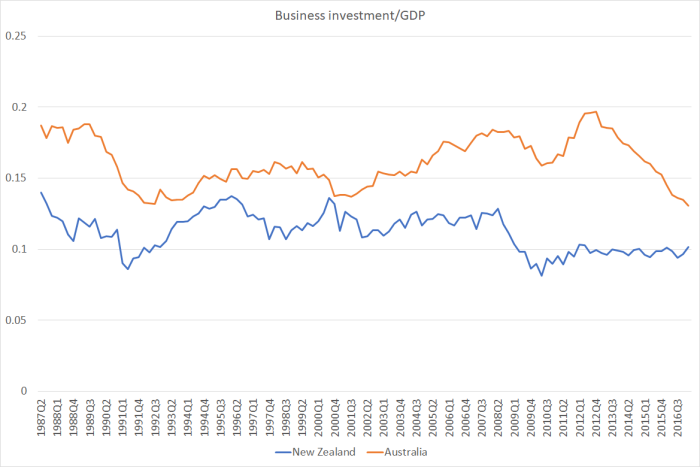
Business investment in Australia, as a share of GDP, has fallen very dramatically over the last few years. But it was a very big boom – we had nothing of the sort in New Zealand. And even at current levels, Australia’s busines investment still materially exceeds the share of GDP devoted to business investment in New Zealand. In fact, the gap between the two lines isn’t that dissimilar to the typical gaps that prevailed before the mining investment boom got underway in the mid 2000s.
Then again, over the last 25 years Australia’s population growth has averaged a little faster than New Zealand’s. All else equal, faster population would generally require a larger share of current GDP to be devoted to business investment just to maintain the average quantity of capital per worker.
But here is the chart of the two countries’ population growth rates
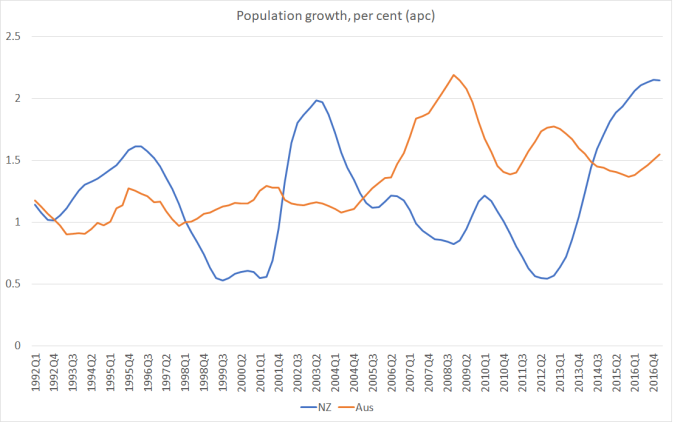
Australia’s current population growth rate (1.5 per cent) isn’t much above the 25 year average (1.3 per cent). In New Zealand, the average population growth rate over the last 25 years has been 1.2 per cent, but in the last 12 months the population has increased by 2.1 per cent. We have lots (and lots) more people, but firms presumably have not been finding it profitable to increase investment (on average across the whole economy), in ways that might suggest some possibility of the sort of productivity growth that might finally allow New Zealand to join the club of fast-growing countries, catching up to the wealthier countries in the OECD.
Not that our politicians give any sense of being worried. An ill-governed place like Turkey – not richer or more productive than New Zealand in our entire modern history – might shortly go past us. Countries that labour under communist regimes thirty years ago might go past us. But none of our leaders seems to care. None of our parties has a platform that suggests they care, let alone offering a programme that might make a real difference.
