A few days ago I ran a post on the cross-country relationships between population growth on the one hand, and residential, government, and business investment on the other. Using OECD data, averaged for each country over a couple of decades, it was apparent that (a) as one would expect, residential investment makes up a larger share of GDP in countries with faster population growth (people want a roof over their head, but (b) business investment as a share of GDP was smaller the faster the population growth a country had experienced. New Zealand’s experience was quite consistent with these relationships. That should prompt some introspection on the part of those – bureaucrats, politicians, and other lobby groups – who champion our large-scale non-citizen immigration programme, the largest such active migration programme (at least for economic reasons) in per capita terms anywhere in the world.
But today, I justed wanted to look at New Zealand’s own data on investment, and particularly the experience in the current cycle. My starting point is this chart, using the components of gross fixed capital formation (“fixed investment” in the national accounts), as a share of GDP, going back to the 1987 when the official quarterly national accounts begin.
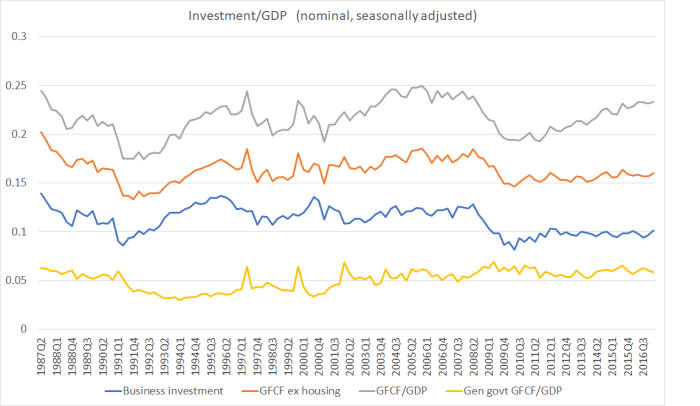
As I noted the other day, “business investment” isn’t an official SNZ category – it would be great if they actually started publishing one – but instead follows the OECD practice of subtracting general government investment (schools, roads etc) and residential investment from total investment. It isn’t fully accurate, to the extent that some residential investment is done directly for the government (so there is some double-counting) but (a) the effect should be small, and (b) it is a consistent treatment through time.
And in case anyone is wondering what the spikes in 1997 and 1999 are, they are navy frigates.
Three things struck me from this chart.
- First, total investment as a share of GDP (the grey line) has been rising quite strongly from the trough in 2009 and 2010, but
- Second, total investment ex residential investment (the orange line) has barely recovered at all, and
- Third, business investment (as proxied by the blue line) has not only barely recovered, but is now smaller as a share of GDP than in every single quarter from 1992 to 2008. And this even though our population growth rate has accelerated strongly, to the fastest rate experienced since the early 1970s
The difference between the orange and grey line is residential investment. It has picked up a lot as a share of GDP, but then it would have been extremely worrying if that were not the case. After all, we had a series of destructive earthquakes in Canterbury, and huge volume of resources had to be devoted to simply restoring the existing housing stock. And we’ve had a big acceleration in population growth. Residential investment as a share of GDP is now higher than at any time in thirty years, although house and land price developments suggest that residential land is still being held artificially scarce.
Businesses invest when they see opportunities and can raise the finance (internally or externally to take advantage of the opportunities). There will always be some financing constraints – firms that don’t have the retained earnings or can’t persuade someone else to provide additional debt or equity – but it is a little hard to believe that, as this stage of the cycle, those financing constraints are much different than usual. It suggests that firms just don’t see the investment opportunities in New Zealand to anything like the extent they once did, even though the population is growing as fast as it ever has in modern times. It is at least suggestive that the persistently high real exchange rate might be an important part of the explanation.
New Zealand’s quarterly national accounts data go back only to 1987, but the annual national accounts data go back to the year to March 1972. Here is business investment as a share of GDP right up to the year to March 2017.

Not much above recessionary levels (1991 or 2009), and showing no sign whatever of picking up. And that is even though the population (and employment) are now much higher than would have been foreseen just a few years ago. Investment goods do appear to have got (relatively) cheaper over time, but that seems unlikely to adequately explain how firms saw investment opportunities of around 12 per cent of GDP in the two growth phases, but only around 10 per cent now (especially as we know we’ve now had no productivity growth for five years).
Statistics New Zealand also produces annual estimates of the capital stock. The latest observation is for the end of March 2016, but the earlier charts suggest there is little reason to think the story for the most recent year will be any more encouraging when the March 2017 data are released later this year. This chart shows the annual growth rate is the estimated per capita real net capital stock (excluding residential dwellings).
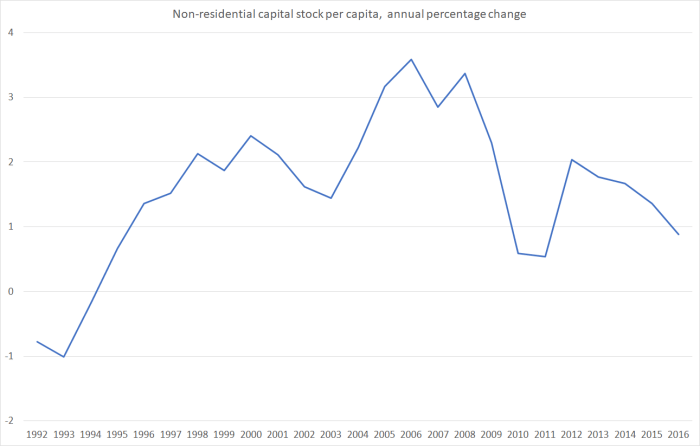
This indicator uses all the non-residential capital stock (ie including that belonging to the government sector). As government investment has held up more strongly than business investment (see the first chart above) and as employment has been rising faster than population, the picture for business investment per employee would probably look even more disconcerting.
And, of course, all the official capital stock numbers use reproducible capital only. In New Zealand, in particular, land is a major input to significant parts of business production. The quantity of land is fixed (improvements to the land are included in the investment numbers above), and that fixed quantity is spread over ever more people.
Given our very serious housing situation, with house price to income ratios among the highest anywhere in the advanced world, it should be a bit troubling when really the least poor bit in the investment data is residential investment. But lest I inadvertently comes across sounding upbeat on that score, here is annual growth in the SNZ real residential capital stock per capita.
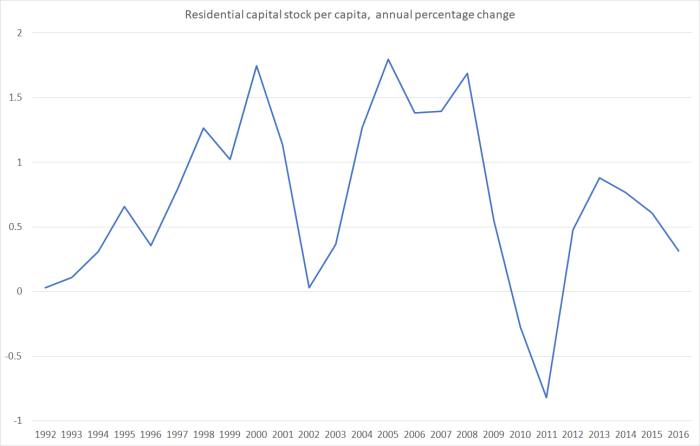
But perhaps this too is some sort of “sign of sucess” or “quality problem”? Most people, I suspect, would settle for signs that if we are going to have rapid policy-driven population growth, that businesses would then find it remunerative to invest much more heavily, whether in building houses or producing other stuff to sell here or abroad.
