A Budget from a government that seems to have no real sense of how strong sustained growth in productivity and living standards arises was perhaps never likely to produce anything of great interest. The cheerleading for the, demonstrably failing, “ever bigger New Zealand” approach – failing, that is, to generate any sign of better productivity growth, perhaps especially in Auckland – and the questionable rhetoric about a more diversified New Zealand economy, was accompanied by yet more claims that somehow New Zealand’s economic performance is better than those of almost all our advanced country peers. Meanwhile, oppressive taxes are raised on some of the poorest people in the country, to fund pouring more money into things like KiwiRail, regional research institutes, apprenticeships, and high-performance sport.
I heard some comments on Radio New Zealand this morning about “ideological” approaches to spending, and in particular about the share of GDP devoted to core Crown operating spending. Since politics is about conflicting values and ideologies, I wasn’t sure what the problem was. But in any case, the tables in the BEFU (Budget Economic and Fiscal Update) suggest that the government plans that its operating spending in the coming year will be 29.9 per cent of GDP. As it happens, that is also the average share for the three June years 2015 to 2017. The average share in the last three years of the previous government was 30.2 per cent.
In the last three years of the previous government, taxes were probably too high. The core Crown residual cash surplus – which some of smarter people at Treasury encouraged me to focus on when I worked there – averaged 1.5 per cent of GDP over those years, 2006 to 2008. By contrast, even on yesterday’s numbers there is no sign of a residual cash surplus until the June 2019 year, and over the three years to June 2017, the average residual cash deficit is expected to be 1.1 per cent of GDP.
Through some combination of fiscal drag and continuing savage tax increases on tobacco, and perhaps some cyclical effects as well, tax as a share of GDP which had fallen as low as 25 per cent in the year to June 2011 is now just under 28 per cent.
International comparisons of spending and tax levels are largely impossible just using Budget numbers. Countries calculate things differently, and I recall a painful few days once when I was inside Treasury trying to get from the OECD how they translated our numbers into their numbers.
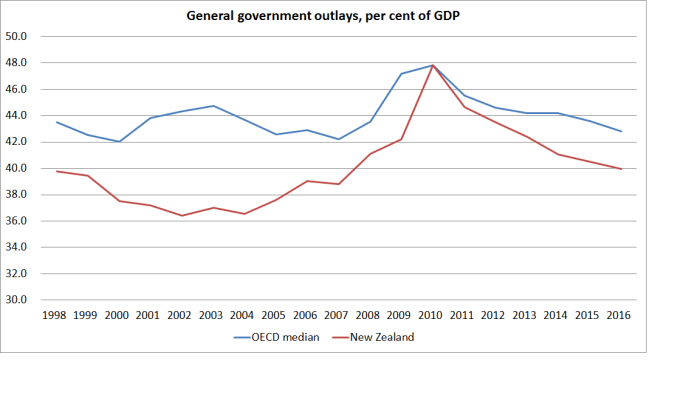
But here are the latest OECD numbers, which use “total outlays” (not just operating spending) and are not done on an accruals basis. I’ve shown spending as a share of GDP for the median OECD country and for New Zealand. There is nothing very unusual about the path in New Zealand. In levels terms, spending as a share of GDP is a bit below the OECD median, but it is also a bit above the median for the other Anglo countries (only the UK is higher).
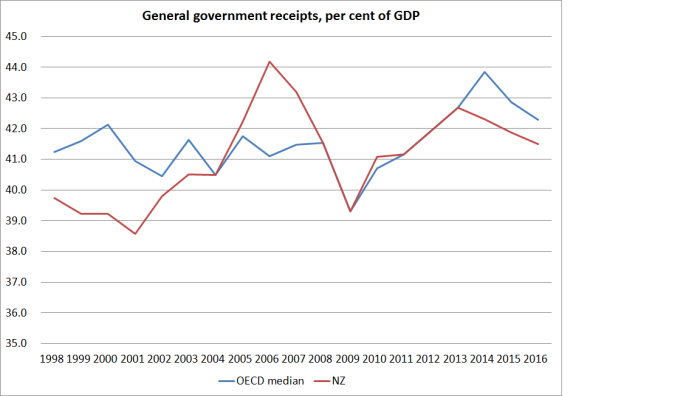
And here is the same chart for revenue. Again, nothing stands out about New Zealand’s path.
Of course, a notable difference is in the deficit/debt position. We were better-positioned than most going into the recession, and eight years on we are also better-positioned than most. In one sense that is a legacy of successive governments going back 30 years, but then legacies are only preserved if each successive government makes sensible decisions.
That is fiscal policy. But in many ways it was the Treasury economic forecasts that accompanied, and underpinned, the fiscal numbers that got me most interested. Several other economists have noted that they seem to err on the optimistic side. That is my fear too.
But I was also interested in the starting point. According to Treasury, we currently have a negative output gap of 0.9 per cent of GDP. That is a little larger than the estimated gap a year ago, and the gap is expected to just as large in a year’s time as it is now. And that on the back of negative output gaps every year since the 2008/09 recession.
There is a lot of imprecision in these estimates. But the idea that there is still excess capacity in the economy – 7 years on from the recession – seems quite plausible. After all, the unemployment rate is 5.7 per cent, and Treasury (quite plausibly) thinks a “natural” rate of unemployment (given the structural features of the labour market, the welfare system etc) is around 4.5 per cent. That used to be the Reserve Bank’s long-term NAIRU estimate too. And as we know, inflation has been very low, persistently undershooting the midpoint of the inflation target (after persistently overshooting the target for most of the previous two decades). If Treasury is right, it is a pretty sorry commentary on the conduct of short-term macro policy in New Zealand. And that, not to put too fine a point on it, has been Graeme Wheeler’s responsibility for the past four years. I continue to be a bit surprised that the Opposition doesn’t point these things out. People have been unnecessarily unemployed because of the choices/judgements of the Governor.
But in terms of the Budget, it is probably the projections from here that matter more. Treasury expects real GDP growth rates to average 2.9 per cent over the next four years. But it isn’t really clear how or why.
It doesn’t seem to be from the effects of macro policy. The fiscal impulse over the forecast period is estimated to be slightly contractionary. And they seem to have allowed only one more cut in the OCR, but they recognize that inflation expectations have been falling, so real interest rates are going to be no lower than they were a couple of years ago before the ill-fated tightening cycle. The exchange rate has come down quite a bit, and perhaps they are assuming some quite powerful lagged effects from that fall. They assume some recovery in the terms of trade, but nothing as dramatic as the increase in dairy prices a few years ago. And, on the other hand, the level of repair and rebuild activity in Christchurch – a major impulse to demand for several years – will be fading.
And then there is immigration. As everyone recognises, the unexpectedly large net immigration flows over the last few years have been a significant boost to total economic activity. Treasury assumes – fairly conventionally – a sharp fall in met migration inflows, from 71000 in the June 2016 year, to only 19000 in the June 2018 year. But there is no assumed change in immigration policy, and so the assumed change in net arrivals must all be endogenous to relative economic performance and opportunities. And yet, they aren’t forecasting much of a pick-up in Australia. To me, something doesn’t quite add up. How are we going to get a sustained growth acceleration here – producing per capita real GDP growth almost as fast as in the period from 1991 to 2007/08 (ie after the reforms and through the massive credit expansion) – with a pretty sluggish world economy, and all with a substantial negative impulse coming from a sharp cut in the population growth rate?
There is so much uncertainty about medium-term forecasts, that any of these numbers could turn out right. But they don’t look like the most plausible story to me – and seem too reliant on just assuming that things finally come right. If so, they don’t represent the most plausible basis for thinking about future fiscal policy options. Frankly, I’d be a bit surprised if we ended up with incipient surpluses in the next few years any larger than the modest positive balances the government has right now. I remain very skeptical of the case for keeping the New Zealand Superannuation Fund in existence, let alone putting more money into it at this late date. But if my doubts about the macro outlook prove well-founded, then the date for resuming contributions – already almost a decade on from the NZS eligibility age for the first baby-boomers – will fortuitously be pushed further into the future.
Among the spin yesterday was the continuing claim from ministers and the Prime Minister that New Zealand’s economic performance is better – and will be better, on these Budget economic numbers – than that of most of our advanced country peers. As I’ve pointed out numerous times before, our growth rate for total real GDP isn’t bad by international standards (while remaining weak by historical standards), but that almost entirely reflects the very rapid population growth. Per capita growth has been very weak by international standards in the last 12 months or so.
How about the outlook? I downloaded the latest IMF WEO forecasts for advanced countries. Here is a chart showing forecast growth in real GDP per capita for the next four years (calendar 2019 over calender 2015). For New Zealand, I’ve used the Treasury BEFU forecasts for the four years to June 2020 – ie four years from now – although as it happens the IMF forecasts for New Zealand aren’t much different.
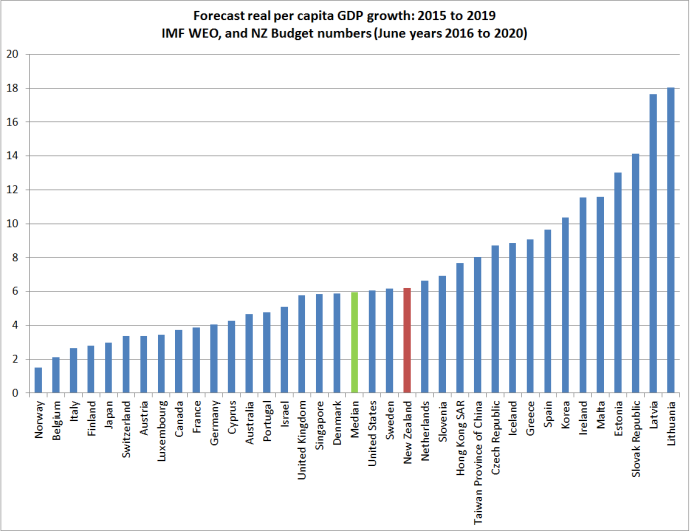
On these numbers, New Zealand is doing not too badly. Our forecast growth rates are very close to those of the median country, very similar to the US and UK (among G7 countries) and Sweden and Denmark (among countries nearer our size). Which is fine in its way but (a) as I’ve noted, the New Zealand forecasts look rather optimistic, and (b) given our starting point, so much poorer than most of these countries, a successful economic strategy would have involved rather faster growth rates.
Slovakia, for example, might be an achievement to aspire to. On these IMF numbers, between 2007 and 2021 Slovakia will have recorded almost 43 per cent growth in real per capita GDP, while we’ll have managed 15 per cent. After decades of Communist rule, Slovakia started a long way behind New Zealand. It has already matched our real GDP per hour worked, and looks likely to be moving past us.
We don’t have very much positive to write home about.

Perspicacious as usual, Michael. Why is there such a big difference between the operating outlays at around 30% of GDP, and total outlays which are often c. 10% higher?
LikeLike
Two big factors: first is that the OECD numbers are general govt (so include local govt). It is the only meaningful way of doing international comparisons, given the different arrnagements each country has in allocating functions among central, state/regional, and local govt. In fact, in NZ the local govt share has been quite stable (about 3% of GDP) for a long time.
The second is that the OECD includes capex.
LikeLike
What is the problem with the Super Fund?
LikeLike
NZ Super is never going to be able to survive because there are 1 million New Zealanders that live overseas that would more than likely choose to retire to NZ if they have no savings. From some countries they may be able to transfer their super but there are a lot of countries that do not have super to transfer which means that there would be a huge numbers of kiwis that have not paid NZ tax and that has citizenship rights to NZ super.
LikeLike
Yes, that is another parameter that needs modification. I wrote about it last year. Even amending the requirement to living in NZ for 15 years after 50 in order to get NZS would probably largely solve that dimension of the problem.
LikeLiked by 1 person
Very briefly (I’ve long meant to write a proper post on the topic and this won’t be it)
– if there was a case for it, it was 15 years ago, before we got the rapid increase in the number of over 65s
– it is designed around an NZS policy which few people even think should be sustained. Raise the age to 67 or 68 and life expectancy index it and the expected future costs are materially lower
– to the extent the govt runs surpluses they should just be devoted to repaying debt. If we ever get rid of all the gross debt, then perhaps consider an asset fund
– the NZSF investment approach will tend to deliver high returns when govt finances are in a good shape, and big losses when the govt finances are under stress
– leveraged investment isn’t a natural business of govt (and having such a fund raises all sorts of issues about what sorts of exposures different citizens are comfortable with – eg fossil fuels companies, weapons companies, abortion providers, or whatever.
– the Fund risks being a money-pot used for poor quality projects if the govt ever gets into real difficulty (plenty of people were running such ideas in 2008/09.
In short, run moderate surpluses and reduce entitlements in line with life expectancy, and the “problem” largely goes away.
LikeLike
Michael why is it that NZS will do well when the govt finances are in good shape and not when they aren’t ?
LikeLike
Because of the strong correlation between (a) cyclical economic performance and equity returns, and (b) the strong correlation of econ cycles across countries (esp in times of stress). You can see one example of the point in the MTM losses the NZSF took in 08/09. It was still small then, but if the Fund got much larger and we saw a similar equity market shakeout in a future recession, there would be quite a risk that it would induce pro-cyclical domestic fiscal reactions (ie cutting spending to partly offset the wealth losses on the investment fund). On the up side of the cycle, really high asset returns in good times risk making politicians feel Crown finances are healthier than they really are.
I don’t think this is a first order point, but I don’t think the Crown has a natural role as a large scale equity investor, esp as thru the income tax system it already, in effect, has a large equity stake in the whole economy.
LikeLiked by 1 person
Or put another way, the NZSF will succeed in states of the world (growth turns out to be high) where PAYG would also have worked well, and vice versa. A good example of the Modigliani-Miller theorem at work.
LikeLike
I guess you were pleased to see another $190M going to KiwiRail? What would you do with KR if you ran the country?
LikeLike
If that rail actually stopped in Huntly you could have a lot more people living in Huntly. There are tracks running through Huntly but no station as they took it out and demolished it 15 to 20 years ago.
LikeLike
I don’t know specifically. There are some arguments about ensuring the right balance of charging (eg road user charges vs rail), but from what I’ve read/seen I’d be surprised if most of the lines were viable. In many cases, they probably never were, all the way back to Vogel.
So that is a bias towards closure, but the details need more careful analysis than I have given, or can give, it.
LikeLike
I think your right about Vogel – they have been subsidised or heavily protected since 1936.
“In 1936, the protection of railways was extended to cover all freight conveyed over distances greater than those specified by the Act. This was by far the most crucial regulation, as it gave rail an effective monopoly on long-distance freight transport. Originally this limit was 30 miles (48 km). In 1962 it was increased to 40 miles (64 km), and in 1977 to 150 kilometres (93 mi).”
Gee 30 miles – that”s like Wellington to Parapaumu.
LikeLike
Yes, altho the effective subsidy goes back much further. My understanding is the mostly railways managed to cover operating costs from operating revenue, but rarely got a proper return on capital (on some lines perhaps, but never across the network across time. When the main trunk North Island line was completed in the early 1900s, it would almost certainly have been more economic to move goods Akld to Wgtn by sea.
I guess that is why NZ and Aus had state-owned railways – in contrast to the US – as it was as much about “nationbuilding” as economics. In some respect, “nationbuilding” even had a security context, since the government only got full effective control over the whole North Island around the same time.
I think the logic of the 30 mile limit was something about using trucks only for local delivery, from railhead to company door.
Note the Muldoon liberalization in 1977. It was small, but not immaterial…..
LikeLike
I have sometimes wondered what the balance of cost/benefit would be if the rail line from Hamilton to Palmerston North was closed and made into a cycle way. A wonderfully even incline for the cyclists, through some of the North Island’s premier landscapes. To be sure, some cost in laying the pathway (on top of the tracks?), but no need to replace those viaducts that are approaching the end of their life, at least carrying trains. Certainly beneficial for those central North Island towns that used to be ‘railway towns’, but could become cyclist ‘stop-over’ towns.
Of course, we already have the Otago Rail Trail and rail carts on the Taumaranui-Whangamomona line. Perhaps next the Napier-Gisborne line, and then the central part of the Main Trunk? The NZ equivalent of the waterways of England and Europe (which once also were used for heavy haulage).
And perhaps an opportunity to turn a large liability (the rail network) into a smaller liability (by tendering concessions for tourist uses), and maybe, who knows, even into an asset? Oh, and the road safety benefit. Cyclists and 18 wheeler rigs on the same highway – where is OSH?!!!
LikeLike
Bruce I am fairly sure you can be tried for treason for suggesting an alternative use for the rail network. But it is an excellent idea. The line through the centre of NZ would be on every cyclist in the world’s bucket list. Those viaducts are spectacular and the Raurimu Spriral is cool. Tauramanui a tourist mecca??? But hold on – what would the 8 people who work for the railways do? There is also a ton of underutilised accommodation around there to service the skifields.
The NIMT has 5 freight trains a day which I think is 120 trucks worth of stuff. Hardly huge.
http://schiff.co.nz/interactive/nzfreight/ is a great way of seeing how little the rail moves on most of the network. Virtually all the tonnage is in a few short routes. Maintenence costs are made even worse by needing to keep alternative routes open – eg the north Wairarapa line which has only one train a week on it. (logs coming away from the Hawkes Bay as Centreport undercuts Napier Port using Wgtn ratepayers money)
LikeLike
That is a really great graphic thanks – esp if you click on the “rail” tab
LikeLike
Yes click on “rail” and all the freight disappears…
LikeLike
What the heck is “Taiwan Province of China”. Does everyone in the world kowtow to the mainland Chinese bullies? Next we all be saying Tibet should be part of China because the Mongols conquered it so therefore it has always been part of the Middle Kingdom….
LikeLike
I don’t, but the IMF does – I just lifted my labels from their table, and forgot to make the change. The Fund is a bit caught tho – China would probably kick up a stink if the data were just labelled “Taiwan” (and no one else on the Board would have much incentive to resist) which might mean the data weren’t published in these accessible places at all.
It is a bit like Macedonia – only allowed into the Fund at all under the name (to pander to Greece, determined to keep exclusive held of the Macedonia heritage – Alexander and all that ) Former Yugoslav Republic of Macedonia (or FYROM).
LikeLike
Fair enough Michael….. sorry its a pet peeve of mine.
LikeLike
Thank goodness we have rail in the BOP. More than enough trucks here and we could do with a lot less.
LikeLike
Rail is expected to make a profit for maintaining the rail tracks, while no trucking or bus company is expected to pay its full share of maintaining the roads. Thus the competition to rail is subsidised.
Rail shifts more people than roads can, so rail transit systemss a good thing for cities, and chepaer than building roads of national signficance.
Also electrified rail is essental for reducing carbon emissions.
Rail has a great future.
LikeLike