A Budget from a government that seems to have no real sense of how strong sustained growth in productivity and living standards arises was perhaps never likely to produce anything of great interest. The cheerleading for the, demonstrably failing, “ever bigger New Zealand” approach – failing, that is, to generate any sign of better productivity growth, perhaps especially in Auckland – and the questionable rhetoric about a more diversified New Zealand economy, was accompanied by yet more claims that somehow New Zealand’s economic performance is better than those of almost all our advanced country peers. Meanwhile, oppressive taxes are raised on some of the poorest people in the country, to fund pouring more money into things like KiwiRail, regional research institutes, apprenticeships, and high-performance sport.
I heard some comments on Radio New Zealand this morning about “ideological” approaches to spending, and in particular about the share of GDP devoted to core Crown operating spending. Since politics is about conflicting values and ideologies, I wasn’t sure what the problem was. But in any case, the tables in the BEFU (Budget Economic and Fiscal Update) suggest that the government plans that its operating spending in the coming year will be 29.9 per cent of GDP. As it happens, that is also the average share for the three June years 2015 to 2017. The average share in the last three years of the previous government was 30.2 per cent.
In the last three years of the previous government, taxes were probably too high. The core Crown residual cash surplus – which some of smarter people at Treasury encouraged me to focus on when I worked there – averaged 1.5 per cent of GDP over those years, 2006 to 2008. By contrast, even on yesterday’s numbers there is no sign of a residual cash surplus until the June 2019 year, and over the three years to June 2017, the average residual cash deficit is expected to be 1.1 per cent of GDP.
Through some combination of fiscal drag and continuing savage tax increases on tobacco, and perhaps some cyclical effects as well, tax as a share of GDP which had fallen as low as 25 per cent in the year to June 2011 is now just under 28 per cent.
International comparisons of spending and tax levels are largely impossible just using Budget numbers. Countries calculate things differently, and I recall a painful few days once when I was inside Treasury trying to get from the OECD how they translated our numbers into their numbers.
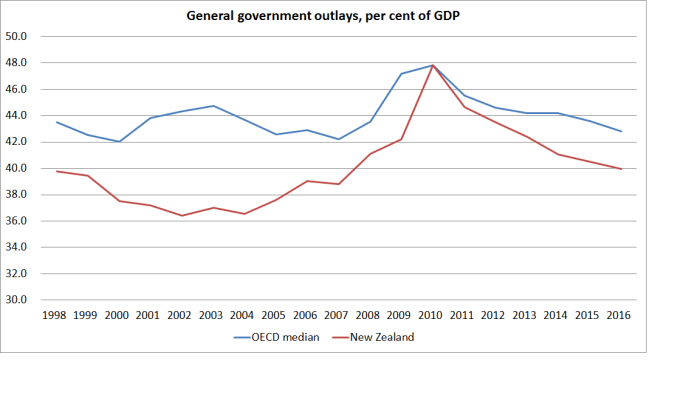
But here are the latest OECD numbers, which use “total outlays” (not just operating spending) and are not done on an accruals basis. I’ve shown spending as a share of GDP for the median OECD country and for New Zealand. There is nothing very unusual about the path in New Zealand. In levels terms, spending as a share of GDP is a bit below the OECD median, but it is also a bit above the median for the other Anglo countries (only the UK is higher).
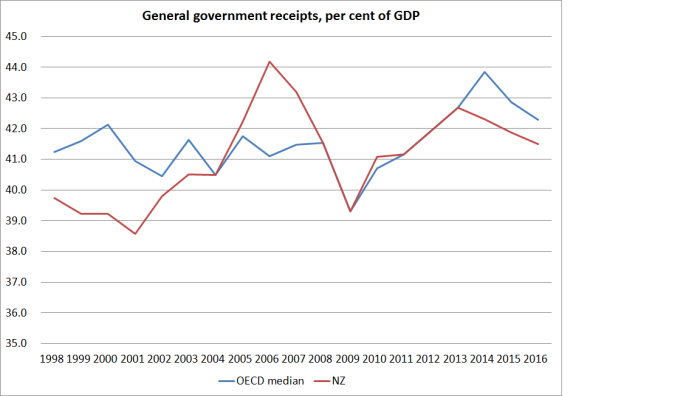
And here is the same chart for revenue. Again, nothing stands out about New Zealand’s path.
Of course, a notable difference is in the deficit/debt position. We were better-positioned than most going into the recession, and eight years on we are also better-positioned than most. In one sense that is a legacy of successive governments going back 30 years, but then legacies are only preserved if each successive government makes sensible decisions.
That is fiscal policy. But in many ways it was the Treasury economic forecasts that accompanied, and underpinned, the fiscal numbers that got me most interested. Several other economists have noted that they seem to err on the optimistic side. That is my fear too.
But I was also interested in the starting point. According to Treasury, we currently have a negative output gap of 0.9 per cent of GDP. That is a little larger than the estimated gap a year ago, and the gap is expected to just as large in a year’s time as it is now. And that on the back of negative output gaps every year since the 2008/09 recession.
There is a lot of imprecision in these estimates. But the idea that there is still excess capacity in the economy – 7 years on from the recession – seems quite plausible. After all, the unemployment rate is 5.7 per cent, and Treasury (quite plausibly) thinks a “natural” rate of unemployment (given the structural features of the labour market, the welfare system etc) is around 4.5 per cent. That used to be the Reserve Bank’s long-term NAIRU estimate too. And as we know, inflation has been very low, persistently undershooting the midpoint of the inflation target (after persistently overshooting the target for most of the previous two decades). If Treasury is right, it is a pretty sorry commentary on the conduct of short-term macro policy in New Zealand. And that, not to put too fine a point on it, has been Graeme Wheeler’s responsibility for the past four years. I continue to be a bit surprised that the Opposition doesn’t point these things out. People have been unnecessarily unemployed because of the choices/judgements of the Governor.
But in terms of the Budget, it is probably the projections from here that matter more. Treasury expects real GDP growth rates to average 2.9 per cent over the next four years. But it isn’t really clear how or why.
It doesn’t seem to be from the effects of macro policy. The fiscal impulse over the forecast period is estimated to be slightly contractionary. And they seem to have allowed only one more cut in the OCR, but they recognize that inflation expectations have been falling, so real interest rates are going to be no lower than they were a couple of years ago before the ill-fated tightening cycle. The exchange rate has come down quite a bit, and perhaps they are assuming some quite powerful lagged effects from that fall. They assume some recovery in the terms of trade, but nothing as dramatic as the increase in dairy prices a few years ago. And, on the other hand, the level of repair and rebuild activity in Christchurch – a major impulse to demand for several years – will be fading.
And then there is immigration. As everyone recognises, the unexpectedly large net immigration flows over the last few years have been a significant boost to total economic activity. Treasury assumes – fairly conventionally – a sharp fall in met migration inflows, from 71000 in the June 2016 year, to only 19000 in the June 2018 year. But there is no assumed change in immigration policy, and so the assumed change in net arrivals must all be endogenous to relative economic performance and opportunities. And yet, they aren’t forecasting much of a pick-up in Australia. To me, something doesn’t quite add up. How are we going to get a sustained growth acceleration here – producing per capita real GDP growth almost as fast as in the period from 1991 to 2007/08 (ie after the reforms and through the massive credit expansion) – with a pretty sluggish world economy, and all with a substantial negative impulse coming from a sharp cut in the population growth rate?
There is so much uncertainty about medium-term forecasts, that any of these numbers could turn out right. But they don’t look like the most plausible story to me – and seem too reliant on just assuming that things finally come right. If so, they don’t represent the most plausible basis for thinking about future fiscal policy options. Frankly, I’d be a bit surprised if we ended up with incipient surpluses in the next few years any larger than the modest positive balances the government has right now. I remain very skeptical of the case for keeping the New Zealand Superannuation Fund in existence, let alone putting more money into it at this late date. But if my doubts about the macro outlook prove well-founded, then the date for resuming contributions – already almost a decade on from the NZS eligibility age for the first baby-boomers – will fortuitously be pushed further into the future.
Among the spin yesterday was the continuing claim from ministers and the Prime Minister that New Zealand’s economic performance is better – and will be better, on these Budget economic numbers – than that of most of our advanced country peers. As I’ve pointed out numerous times before, our growth rate for total real GDP isn’t bad by international standards (while remaining weak by historical standards), but that almost entirely reflects the very rapid population growth. Per capita growth has been very weak by international standards in the last 12 months or so.
How about the outlook? I downloaded the latest IMF WEO forecasts for advanced countries. Here is a chart showing forecast growth in real GDP per capita for the next four years (calendar 2019 over calender 2015). For New Zealand, I’ve used the Treasury BEFU forecasts for the four years to June 2020 – ie four years from now – although as it happens the IMF forecasts for New Zealand aren’t much different.
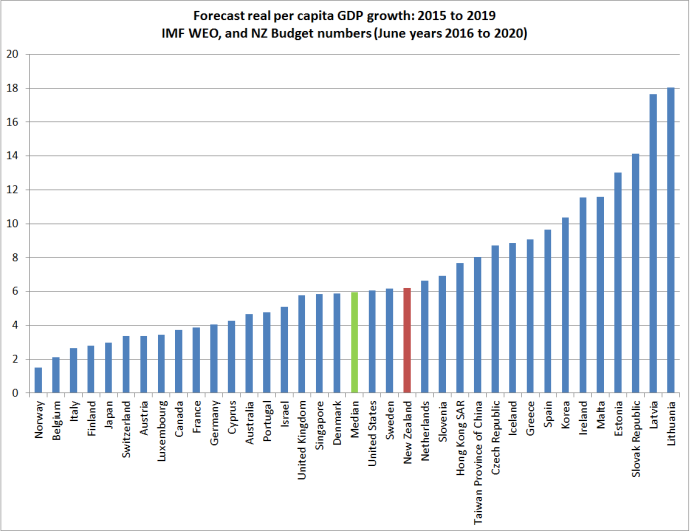
On these numbers, New Zealand is doing not too badly. Our forecast growth rates are very close to those of the median country, very similar to the US and UK (among G7 countries) and Sweden and Denmark (among countries nearer our size). Which is fine in its way but (a) as I’ve noted, the New Zealand forecasts look rather optimistic, and (b) given our starting point, so much poorer than most of these countries, a successful economic strategy would have involved rather faster growth rates.
Slovakia, for example, might be an achievement to aspire to. On these IMF numbers, between 2007 and 2021 Slovakia will have recorded almost 43 per cent growth in real per capita GDP, while we’ll have managed 15 per cent. After decades of Communist rule, Slovakia started a long way behind New Zealand. It has already matched our real GDP per hour worked, and looks likely to be moving past us.
We don’t have very much positive to write home about.
