My post the other day put the decline in Auckland’s GDP per capita (relative to that of the rest of the country) in some international context using BEA data on the average per capita GDP of various large US cities. As one would have expected, the average per capita in the typical US large city had been rising a little faster than GDP in the US as a whole.
The US data are interesting, but the US is an extremely large country. By contrast, in Europe that are lots of small countries, and (in particular) small countries with a single dominant city. In that respect at least, European experiences might be more interesting to compare Auckland’s experience against.
Eurostat publishes a huge quantity of regional per capita nominal GDP data for the 28 EU member countries. For a few (Malta, Luxembourg, and Cyprus) there wasn’t meaningful data distinguishing the performance of the biggest city from the rest of the country – and in Luxembourg, the data are problematic anyway, since GDP captures economic activity occurring in a country, while many people who work in Luxembourg live in surrounding countries. But that left 25 EU countries, and I went through the data to identify, as accurately as I could, the data for the metropolitan region capturing the largest city in each country. Again, the data are likely to be only indicative – in every metropolitan area, there will be some cases where people work in the area (so their output is in GDP) but live somewhere else (so the person isn’t in the population numbers for that region).
For a few large countries there is no single dominant city. It isn’t an issue in the United Kingdom, France or Poland, where London, Paris and Warsaw respectively dominate, But for Spain, Germany and Italy it is. For illustrative purposes, I used data for Madrid, Hamburg, and Milan respectively.
Eurostat publishes data for 2000 to 2014, but for some cities the data are only available to 2013. For each country, I took the average per capita income of the largest city and calculated that as a ratio of the whole country’s GDP.
This chart shows the behavior over time in the ratio for the median country. I’ve shown two lines: one for the 17 countries with populations less than around 10 million, and one for all 25 countries.
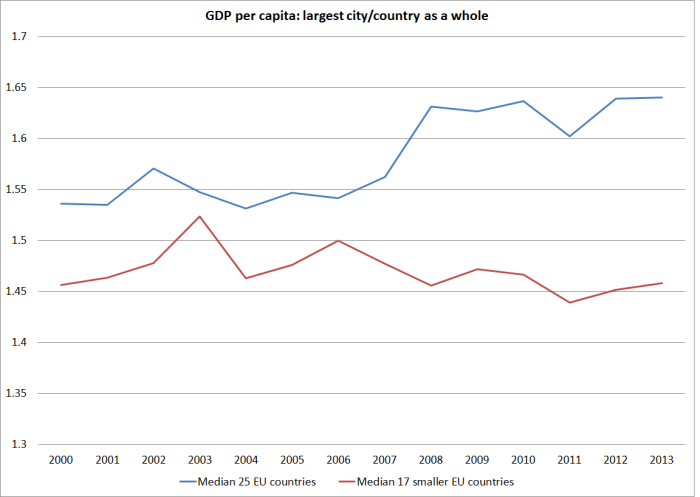
For all 25 countries, the median had increased over this period. For the smaller countries, there been basically no change over the full period. It is quite different from the picture for Auckland.
I’m not sure why the smaller EU countries did less well on this measure than the full EU sample, but the smaller countries included the countries worst hit by the 2008/09 recession and the subsequent euro crisis. There might be some cyclicality in the relative performance of the largest city does (doing really well in boom times, but suffering more than most in downturns – we see a bit of this in Auckland, which feels the demand effects of fluctuations in migration more than most places).
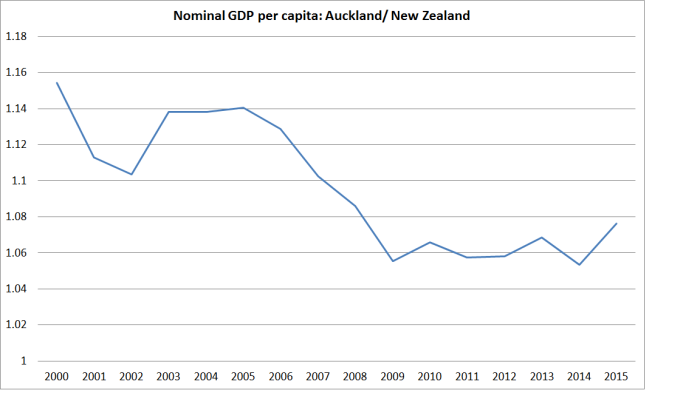
Auckland’s average GDP per capita is higher than that in New Zealand as a whole (and around 12 per cent than that in the rest of New Zealand excluding Auckland), even if that gap has been closing. But how does that levels gap compare?
In this chart, I’ve shown the latest observations for how much higher (%) average per capita GDP is in the big city than for the country as a whole for each of the EU country – grouped by small, medium and large. I’ve also shown the median for the twelve largest US MSAs (as per my post the other day), the Auckland numbers, and the experimental numbers for Toronto (from a Statistics Canada research paper) for 2009.
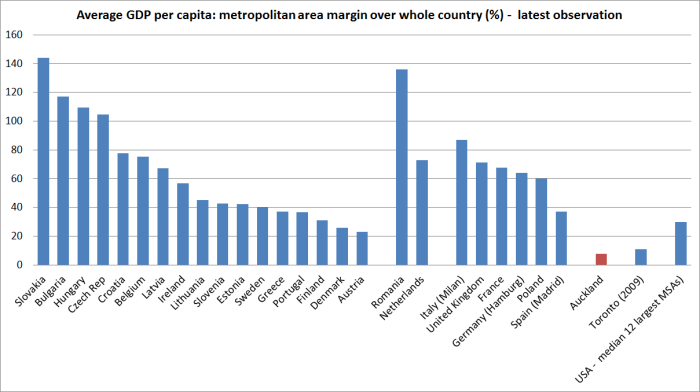
A few things catch the eye. The first is that, at least among the smaller EU countries, it is the ones which have been catching up where the cities are doing best relative to the rest of their respective countries (eg Slovakia, Bulgaria, Hungary, and the Czech Republic). New Zealand was supposed to have been catching up, but hasn’t.
The second thing that catches the eye is just how low the margin between average Auckland incomes and those in the country as a whole is, by comparison with these other countries.
But the third thing that caught my eye, was that the Toronto wasn’t much different. Toronto doesn’t dominate Canada in the way Auckland does New Zealand: Toronto’s population is only about 50 per cent larger than that of Montreal. The Statistics Canada data are only experimental, and they provide estimates for only 2001, 2005 and 2009, but on those estimates both Toronto (in particular) and Montreal had seen a fall in their average per capita GDP relative to that in Canada as a whole.
These days, Canada has higher GDP per capita than New Zealand does (it was the other way round prior to World War Two), but Canada’s productivity growth in recent decades has been about as mediocre as that of New Zealand. Canada has much larger industrial manufacturing sectors than New Zealand does – much of it tied into the US automotive industry – but at heart much of Canada’s prosperity continues to derive from the ability to utilize its vast natural resources. It isn’t an economy whose prosperity seems to be led from its big cities – any more than New Zealand is. That said, Toronto – in such close proximity to the US – seems a much more likely place for successful global companies to base themselves long-term than Auckland.
Canada also operates large scale non-citizen immigration programmes – indeed, the new Canadian government has just announced a material increase in the target rate of immigration (and an reorientation away from economic migration – towards refugee and family). Without knowing more about the Canadian data, I’d be hesitant in drawing too many parallels – and Canada has not faced the same real interest and real exchange rate challenges New Zealand has.
But at least for New Zealand the striking underperformance of our largest city should raise real questions about strategies designed to (or having the effect of) drawing more and more people into Auckland (from abroad – New Zealanders aren’t being attracted), in a country where per capita prosperity seems to rest – and seems likely to continue to rest – on the ability of our people to utilize, ever more smartly, a largely fixed stock of natural resources.
NB: Note that the US figures are measures of real GDP, while for the other countries the data are nominal GDP. For cities other than the US, this will probably have the effect of overstating the margins by which big city per capita GDP exceeds that in the rest of the country, since many prices (including for example housing services prices, but also labour-intensive services) will typically be higher in big cites than in the rest of the country.
