Big countries don’t seem to have got richer faster

Implicit in much of the discussion around an appropriate immigration policy for New Zealand is a sense that our prospects would be better if only New Zealand had more people. Some have come out and actively argued the case – see, for example, this brief note from the NZIER last year.

I’ve long been fairly sceptical of that proposition. A casual glance around the world suggests no very obvious relationship. The United States and Iceland co-exist, and Japan and Singapore. At the other ends of the income spectrum, India and Bhutan, and Brazil and Costa Rica. There are all sorts of arguments advanced around the economics of agglomeration, and that analysis seems to work quite well in describing what happens within countries. But it does much less well in describing economic performance across countries. And as I’ve pointed out to people previously, if the real economic opportunities in big countries were so much superior to those in small countries, large countries would tend to have (more high-yielding projects and) higher real interest rates than small countries. But they don’t.

Angus Maddison put together the most widely-used longer-term estimates of GDP per capita for a wide range of countries. There are plenty of holes that can be poked in those estimates, but they are what we have.   He produced estimates for a large number of countries for 1913, just before the disruption and destruction of World War One, and as he died a few years ago his last numbers were for 2008.

This chart shows per capita real GDP growth from 1913 to 2008 for the sixty or so countries Maddison had estimates for, plotted against the level of the population of each country in 1960 (roughly half way through his period).

popn and growth 1913 to 2008

There is no relationship. And there is also no relationship if:

  • We take out the countries that had exceptionally fast growth over that 95 year period, or
  • If we restrict the sample to  a group of countries that were already fairly advanced in 1913 (Western Europe, and the Anglo offshoot countries).  The United States and Switzerland, for example, had almost identical real per capita GDP growth over that period.

What about more recent periods? The Conference Board has built on Maddison’s work and has estimates for a wider range of variables for more recent decades.  One argument – advanced in a New Zealand context by Phil McCann – is that size has become a much more important issue for advanced countries in the last few decades. If so, perhaps we might have expected to see big countries growing faster than small countries over that period.

Here are two charts that look at that relationship for 33 advanced economies.

The first shows the relationship between the (logged) level of population in 1990 and growth in real per capita GDP growth since 1990.

population and gdp pc since 1990

And the second shows the relationship between the (logged) level of total hours worked in 1990 and growth in real GDP per hour worked since 1990.
hours worked and productivity since 1990
In neither case, is there any sign of a positive relationship.

Charts of this sort are, of course, not conclusive. Lots of other things are going on in each country.  In an ideal world, one would want a much fuller and formal modelling of the determinants of growth. But equally, the absence of a positive relationship between the size of the country and its subsequent growth shouldn’t be surprising, and there have been previous formal research results suggesting a negative relationship.

Of course, perhaps New Zealand is an exception. Perhaps real per capita incomes would really be materially lifted if we had many more people here, even though there has been no such relationship across the wider range of advanced countries in history.  But in a sense we have been trying that strategy for 100 years and there is no sign that it has worked so far.   Very few relatively advanced countries have had weaker real per capita growth than New Zealand in the last 100 years (only places like Argentina and Rumania).

Perhaps the next 25 or 100 years would be different. But I think the onus is now on the advocates of policies to bring about a bigger and more populous New Zealand to demonstrate where and how the gains to New Zealanders from a much larger population are occurring?  Recall that all our population growth now is resulting from government policy choices – the level of non-citizen immigration that the New Zealand government is targeting. If population growth were being driven by the private choices of New Zealanders (higher birth rates, or a permanent reversal of the New Zealand diaspora), I wouldn’t regard it as a particular matter of policy interest. But when our governments are actively targeting a larger population the onus is surely on them to demonstrate the real economic gains to New Zealanders. 25 years on in the current strategy there is no sign of them yet.

One could make a case that New Zealand’s greatest asset is the fertile land and temperate climate.  Refrigeration and much reduced shipping costs in the late 19th century gave those natural resources real economic value.  But there has been no comparable “shock” for the last hundred years, and arguably we are simply spreading those natural resource “rents” over more and more people.  Norway would be unlikely to have the highest real GDP per capita in Europe if they had responded to the discovery of vast oil and gas resources by doubling their population.

Natural resources alone don’t make a country rich (see Iran or Zambia), and natural resources aren’t the only way to get rich (see Singapore or Taiwan) but for a very isolated country they may well, in conjunction with strong institutions and competitive markets, provide the best possible basis for re-establishing top tier living standards for a small population.  So far, adding lots more people doesn’t seem to have helped.

Talking of which, it is now 21 August and there is still no sign of an MBIE response to my 28 May request for copies of advice to ministers on the economic impact of immigration, and on the permanent residence approvals target.

Monetary policy transparency US style

I opened the Wall Street Journal website this morning and noticed a prominent piece of advocacy (and here) , making the case for not increasing the Federal funds rate target yet. Plenty of market and other commentators openly run either side of that argument. But this column was from Narayana Kocherlakota, President of the Minneapolis Fed, and rotating member of (and permanent participant in) the Federal Open Market Committee, which takes monetary policy decisions in the US.

This is no, “on the one hand, on the other hand” treatment, but an article that begins with the rather bold statement

I’m often asked by members of the public about the biggest danger facing the economy. My answer is that monetary policy itself poses the biggest danger.

In his view, raising interest rates in the near-term would “create profound economic risks for the US economy”.

I happen to mostly agree with Kocherlakota’s conclusion –  since core inflation remains very low, and there is little or no sign of a quick return to the target rate –  but that isn’t my point.  I drew attention to the article because of the refreshing contrast  it represents to the way in which monetary policy deliberations and debates occur in New Zealand (and, to a lesser extent, in most other advanced countries).

I’ve highlighted previously that the Reserve Bank of New Zealand is just not that transparent about monetary policy.  Their formal model remains under wraps, written advice to the Governor on OCR decisions is kept secret, and no minutes of the Monetary Policy Committee or the Governing Committee are published.  The Bank was recently forced to release background papers for an OCR decision and Monetary Policy Statement from 10 years ago, but experience suggests they would fight very hard to avoid releasing rather more recent papers.  And that is even though all this material is official information, generated at the cost of your taxes and mine.

But one of the key features of forecast-based discretionary monetary policy (what the Fed, and the Reserve Bank and most other central banks try to practice) is how little any of us knows with any certainty.  Reasonable people can reach quite different views, not just on the outlook but on where the economy and inflation pressures are right now.  Reasonable people can also differ on how the Policy Targets Agreement should be best interpreted and applied.   And views inside central banks are typically no more monolithic –  if perhaps equally prone to herd behaviour –  than views outside.

So what is gained by maintaining the secrecy?  In some areas of public life there might be a real need for temporary secrecy.  Shaping negotiating positions, and identifying bottom lines, in trade negotiations might be an example.  But monetary policy deliberations aren’t like that.  The reputation of the Federal Reserve system doesn’t suffer because Kocherlakota runs a dovish line right now, or James Bullard runs a hawkish line. If anything, the reputation of the system is enhanced, because people can see able people grappling with the range of issues and evidence that need to feed into monetary policy decisions, and can test and evaluate the arguments those people are making.

Of course, it is much easier to adopt such a model in the US system, where FOMC members are independently appointed, and are not dependent on Fed system chair for pay or resources or the like.  It would be much harder to do in the New Zealand system at present, where all those who have a formal say in the system are senior staff, appointed by and accountable to the Governor.  But that only goes to highlight the weakness of our system, and why it would not be appropriate, when Parliament reforms the Reserve Bank Act, to simply give all decision-making powers to a group of senior managers and insiders.  Monetary policy issues like those we –  and the US, and most other countries face –  need robust and searching debate, and especially in a small country much of the expertise is tied up inside government institutions.  We need to create a culture that can encourage debate, and can live with differences of perspective.   I’m not suggesting that all debate should take place in public, but that there is a place for those actively involved in the decisionmaking process to participate openly in debate on these important issues, as happens in the United States or Sweden (and to a lesser extent in the UK)

Even now, if, for example, Deputy Governor Geoff Bascand opposes OCR cuts, we –  and not just the Governor –  should hear his case. Perhaps, with hindsight such an argument might prove right, or perhaps not.   In the nature of these things, no one is ever going to have the answer right all the time, and so in a collective decision-making model, of the sort other countries have, we should be holding participants to account not so much for any particular call, but for the quality and tone of the arguments and judgements each participant brings to the table.   Under the current system, perhaps a start might be made by publishing the written OCR advice the Governor gets prior to each OCR decision, and the minutes of the Governing Committee, when – straight after the MPS –  that information goes to the Bank’s Board.  But that is no more than a start: we need to move towards a system where an independent committee makes monetary policy decisions.  Under such a model, the Governor and staff would still have a crucial role, but their primary role would be advising the decision-makers.

In the next few days I want to come back to the much more severe problems of lack of transparency around the regulatory and supervisory functions of the Reserve Bank.

Some longer-term house price charts

Reflecting further on the risks facing our banking system, I dug out some fairly long-term house price inflation data from the BIS for 19 OECD countries.  I was slightly hesitant about doing so, because there is a risk of feeding the narrative that vanilla lending secured on residential property is likely to be an important independent element in any financial system stress. As the Norges Bank has pointed out, and as the Reserve Bank has affirmed, that just hasn’t been so historically. To the extent that the United States last decade may have appeared an exception, it is important to recall that the heavy role Congress and the Federal government played in driving down lending standards, and the non-vanilla nature of much of the lending.

But for what it is worth, here are a few charts. In all cases, the latest observations are for the December 2014 quarter, which is as up to date as the BIS data are.

Here are real house prices changes since 2007 (most countries had a peak in or around 2007).

house prices since 2007

Real house prices in New Zealand have increased by less than those in Australia and Canada – and yet it is New Zealand banks that have been downgraded to BBB+, a rating not much higher than that held by South Canterbury Finance in 2008. As we’ve seen previously, New Zealand credit growth has done no more than roughly track nominal GDP growth over that period.

The BIS base their data at 1995. There is nothing special about 1995, although in most of these countries it was before any of the strongest house price booms had got underway.

house prices since 1995

Even over the whole 20 years, New Zealand real house prices have increased less than those in Australia and the UK. For the boom period itself (1995 to 2007) New Zealand’s house price inflation was only a touch stronger than that of the median country in this sample.

For most of the countries the BIS has data back to 1970, but for all 19 countries they have data back to 1976. Whether one starts from 1970 or 1976, New Zealand has had less real house price inflation than Australia and the UK, although more than Canada.

house prices since 1976

And what about periods of falling real house prices? There have been 53 episodes across these 19 countries of real house price falls in excess of 5 per cent.   Germany and Belgium have had only one such episode each. Five countries – including New Zealand – have had four such episodes each (including the 15 per cent real fall in and around the 2008/09 recession).

None of this is intended to convey any sort of sense of complacency about house prices in New Zealand (and especially Auckland). They are a scandal, resulting primarily from the acts (of omission and commission) of central and local government), but if anything have increased a little less than we’ve seen in countries with similar planning and land use restrictions (the UK’s are probably tighter, but population growth pressures are less there than in New Zealand and Australia).

But singling out the New Zealand banking system – as S&P appears to have done – seems unwarranted. There is no obvious material differentiation in the sorts of housing risks being taken on by New Zealand banks. Perhaps S&P are right about New Zealand. But the Reserve Bank’s stress tests results don’t suggest so. And, perhaps as importantly, historically, vanilla housing loans don’t lead to bank collapses, and systemic banks don’t collapse (or even come under severe stress) when credit has been growing no faster than GDP.  Reckless property development lending is a much more plausible culprit –  and we haven’t had it in the years since the recession.

Not entirely unrelatedly, I saw a piece the other day by Auckland City’s chief economist in which he cited some work done for the Council by NZIER suggesting that part of the growth in Auckland house prices can be explained by the proposed district plan changes that will allow for greater intensification in some parts of Auckland. I’ve seen a similar argument made by the Westpac economics team. But I must be missing the point. I can easily see why allowing more intensification on a particular section will increase the relative price of that section, but I cannot see how it can be raising prices of houses and land across Auckland as a whole.   Reducing land use restrictions – whether in respect of intensification, or allowing more dispersed development – increases the effective supply of land. And it seems unlikely that increasing supply will itself materially alter demand (eg materially increasing population growth, most of which is now driven by immigration policy). At least when I did introductory economics, increased supply would generally lower the price. It is easy to see why the relative (and perhaps even absolute) prices of some sections might rise if the reforms are for real, but surely any such effect should be more than offset by a fall in urban prices more generally?   If there is serious scope for more intensification, and that potential is expected to be utilised, then rational potential buyers all over Auckland should already expect less intense competition in future for this now less-scarce resource.  If anything, those prospective regulatory changes should be lowering prices now (perhaps only a little, because no one knows yet what real effect they will have), not raising them.

The same Chief Economist also noted that

“we need to economise on the massive amount of urban land we already have, and use it to its best effect. Acukland needs to treat its land like gold dust and a little needs to go a long way”.

I’ve got no problem with removing land use restrictions, whether they are on outward or upward development, but lets recall that the only thing that makes Auckland urban land remotely comparable to gold dust is the regulatory regime which the Auckland Council administers and imposes. Yes, Parnell might always be expensive, but there is simply no reason why  sections in middling suburbs should be. Historically, as cities become richer they have less dense, not more dense.   Planners, councillors, and associated bureaucracts are the people who systematically impede that normal and natural process.

Standard and Poor’s: probably wrong on New Zealand banks

I’ve been puzzling over S&P announcement (and supplementary Q&A material)  the other day, lowering the stand-alone credit ratings of the major banks and the Banking Industry Country Risk Assessment (BICRA) score for New Zealand.  The BICRA was lowered from 3 to 4, on a 10 point scale, where the banking industries of Greece and the Ukraine score 10.

As I noted on Friday, the S&P ratings appeared somewhat inconsistent with the Reserve Bank’s 2014 stress test results, in which even some very severe adverse shocks did not generate loan provisions/losses that were large enough to induce material annual losses in any year of the scenario for any of the major banks.

As a reminder, S&P did not lower the actual issuer credit ratings of any of the major banks. Those issuer ratings incorporate the probability of parental support, and the possibility of government support, in the event that one of the banks got into difficulty. The issuer credit ratings remain at pretty respectable levels, with each of the big four banks at AA-.    This table, taken from sorted.org.nz, draws on Reserve Bank resources to summarise the ratings scale.

Capacity to make timely payment

Description Standard & Poor’s scale Moody’s scale Fitch scale Approx. probability of default over 5 years*
Extremely strong AAA Aaa AAA 1 in 600
Very strong AA Aa AA 1 in 300
Strong A A A 1 in 150
Adequate BBB Baa BBB 1 in 30

* The approximate, median likelihood that an investor will not receive repayment on a five-year  investment in time and in full based upon historical default rates published by each agency.

Source: Reserve Bank

So the chances of getting your money back, from the big New Zealand banks, are still rated extremely highly. That seems about right to me. The chances of the parent banks, and the Australian and New Zealand governments, allowing creditors of these major subsidiaries of big Australian banks to lose money seems very small.   In that sense, creditors of the New Zealand banks may be slightly better-placed than creditors of the Australian banks – there is no large parent, with concerns about contagion risks, standing behind the Australian banking groups themselves.

But the focus of last week’s announcement was not on the issuer ratings, but on the standalone ratings, and the wider environment in which the banking industry is operating. Standalone ratings look at the ability of the bank concerned to meet claims on it without extraordinary parental or government support. In other words, primarily, the quality of the loans on the bank’s books and the level of capital it has to absorb any losses.

And there, having read the S&P documents, and the limited media accounts of their follow-up comments, I am still puzzled.   Three of the big banks now have standalone ratings of BBB+ (while ASB is one notch stronger, and KIwibank and Rabobank are one notch weaker). As the table above suggests, a rating at that level is not much better than adequate. Based on historical experience it is really quite risky. When the Reserve Bank sets minimum capital requirements for banks – and all these banks have capital well in excess of the minimum – they are looking at something much more robust than that.

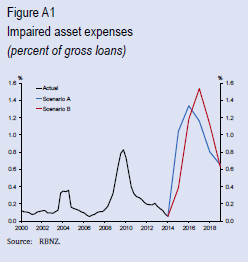
An S&P spokesman is quoted as saying ‘I think we are on the same page, more or less, as the RBNZ”. But I don’t see how they can be.    Here are the loan losses from the Reserve Bank’s stress test scenarios.

stress tests impaired assets

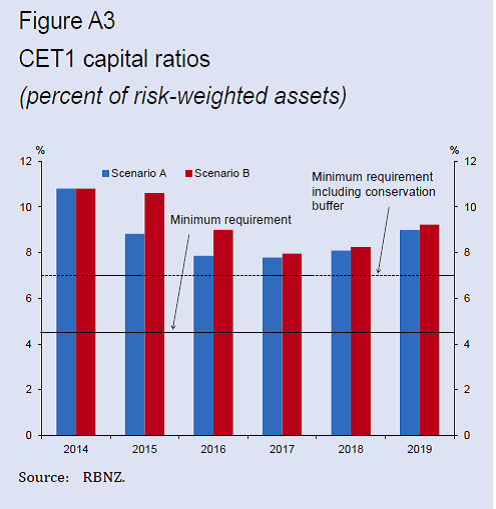
And here are the key capital indicators from the November FSR.

stress tests prudential indicators nov 14 FSR

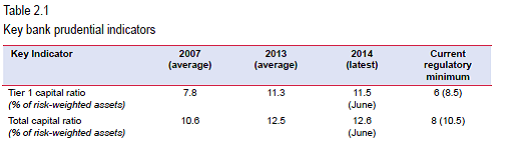
Capital ratios are much higher than they were in 2007 (and the risk weights are now typically more demanding as well), and there is a substantial buffer over the regulatory minima. The Reserve Bank’s stress test loan loss estimates could be understated by half, and the soundness of the banking system as a whole would still not appear likely to be in jeopardy.

But there are other puzzles in the S&P material:

There is no mention at all of the banks’ heavy dairy sector exposures, even though risk on that book is no longer a “low probability event” but something that is crystallising now, as weak world dairy prices and a continued high exchange rate combine to create severe cash-flow difficulties for many farmers, and the likelihood of a significant reduction in the value of the collateral banks have. After all, in a case of somewhat mixed messages, even the government is now belatedly talking of selling dairy farms.

If there is one area where one might be a little critical of the Reserve Bank’s stress tests it is around the dairy scenario, which assumes payouts of just over $5 for several years. Payouts at that level would be not much different, in real terms, from the longer-term historical average levels. There is a real risk already of something more severe than that scenario.   I think the Reserve Bank scenario came out this way because it was built on a severe recession (to trigger the big housing market correction and sharp rise in unemployment). A severe recession would be likely to see a much steeper fall in the exchange rate than we’ve seen so far, which would support the NZD value of returns to dairy farmers. In other words, potential losses on dairy debt aren’t additive to potential losses on housing loans – the scenario in which one might be very bad will typically be offset by less bad losses on the other portfolio. In the current climate, the dairy books look rather sick, while housing losses remain trivially low. If the housing situation worsened markedly (unemployment rose to anything like the 13 per cent in the Reserve Bank’s scenario), the exchange rate would probably be revisiting the lows seem in 2000 (around 50 on the TWI) and net returns to dairy farmers wouldn’t look anywhere near so bad.

But having said all that, it is still surprising that S&P didn’t even mention dairy exposures, by far the largest non-housing economic exposures on New Zealand bank balance sheets.

And S&P still regard any major rapid correction to house prices as “unlikely”.   From his public comments the Governor appears to think the risk is rather greater than that, even while reporting stress test results suggesting that the banks can cope with such a shock. It is all very well for S&P to talk about how a major house price correction would also have wider adverse economic ramifications. Everyone probably agrees with that – at least, unless the house price fall resulted from regulatory liberalisation, which might well be net stimulatory – but New Zealand authorities have far more room to lean against a severe economic slowdown than do authorities almost anywhere else in the advanced world (most of whom have interest rates stuck near zero already). Even relative to Australia (of which more below), the Reserve Bank has an additional 100 basis points available to cut the OCR.

And in either country, interest rates cut to zero would be expected to result in a very large further fall in the exchange rate. Puzzlingly, in their supplementary material, S&P highlight such a depreciation as a risk. They talk of a possible fall in the exchange rate, following a sharp house price fall, as “damaging confidence and potentially limiting monetary policy flexibility”, but they provide no basis for these interpretations. Since both banks and borrowers are pretty well-hedged to exchange rate fluctuations, a sharp fall in the exchange rate would almost certainly be a helpful mitigant. And I’m not aware of any floating exchange rate country in the 2008/09 cycle where the fall in the exchange rate was regarded as problematic or a constraint on monetary policy flexibility. Perhaps Iceland is an exception, but no one thinks of the New Zealand banking system as akin to Iceland’s (even today Iceland gets a BICRA score of 7 from S&P).

Some of the cross-country perspectives don’t make a lot of sense either.   Just a couple of weeks ago, S&P was talking of upgrading the standalone credit ratings of the Australian banks, from A to A+, if those banks raised more capital to meet the higher minimum risk weights APRA is to require. But, as the IMF has recognised and is I think well-understood by the banks themselves, risk weights on housing loans have been materially more demanding in New Zealand than in Australia (or other advanced countries), thanks to the appropriately conservative approach taken by our Reserve Bank. APRA’s latest announcements probably only have the effect of bringing risk weights on Australian mortgage loans up to towards those already in use in New Zealand (the AFR reports average risk weights will have to be increased from a minimum of 16 per cent at present to a minimum of 25 per cent in future). House price inflation has also been strong in Australia – Sydney prices are even more unaffordable than those in Auckland –  and, if anything, credit growth has been running faster in Australia than in New Zealand. It is difficult to see quite how, on the material they have put out, the New Zealand subsidiaries warrant standalone ratings that would be three notches lower than those of the parents.

Finally, S&P defended the BICRA score (the move from 3 to 4) by noting that only 23 other countries had higher scores than New Zealand. That doesn’t sound too bad – although a far cry from “one of the strongest banking systems in the world”) if one thinks of 200 countries in the world, but in fact they only seem to do BICRA scores for about 85 countries. According to this document, from last November, only Switzerland scores a 1. At the time, countries with a 3 were Chile, Denmark, France, Korea, Netherlands, New Zealand, the UK and the US. That was, perhaps, questionable enough company given that Denmark, Netherlands, the UK and the US had all had banking crises in the last few years, and France was saved from one by the Greek bailout in 2010.   In group 4, along with New Zealand now, we find the Czech Republic, Israel, Kuwait, Malaysia, Mexico, Oman, Peru, Qatar, Slovakia and Taiwan. By contrast, Australia (and Canada) still scores a 2. I struggle to see how the risks in New Zealand look more similar to those “4” countries than they do to those in Australia and Canada (or even the UK). In each of those latter countries, house prices – at least in major cities – have got detached from sensible unregulated longer-term fundamentals.   And even S&P reckon that New Zealand house prices are not a “bubble” about to burst. Each has a floating exchange rate – a major element in economic resilience – and New Zealand banks seem particularly strongly and conservatively capitalised (the combination of risk weights, and actual capital ratios). Historically, residential mortgage loan losses not played a key role in systemic bank failures, and yet they are far the biggest exposures on New Zealand bank balance sheets.

The S&P model appears to put quite a lot of weight on New Zealand’s relatively high negative NIIP position. But I think they are largely wrong on that score too. First, the NIIP/GDP ratio has been fluctuating around a stable average for 25 years now. That is very different from the explosive run-up in international debt in countries such as Spain and Greece prior to 2008/09. But also the debt is largely taken on by the government (issuing New Zealand dollar bonds) and the banks. No one seriously questions the strength of the government’s balance sheet, or servicing capacity, even after years of deficits. And the ability of banks to borrow abroad largely depends on the quality of their assets and the size of their capital buffers. If asset quality really is much poorer than most have recognised, rollover risk could become a real problem, but it isn’t really an independent source of vulnerability

I’m not sure where I come out on all this. Even though the Governor is acting as if he doesn’t really believe the stress tests, neither he nor staff have given us any good reason to think their estimates – suggesting a highly resilient banking system at present – are wrong. Then again, people pay substantial amounts of money for S&P’s ratings services. It would be more reassuring if, in the follow-up commentary S&P had directly and specifically explained why they found the stress test results unpersuasive, or even why they think the risks to New Zealand banks are so much greater than those in, say, Australia or Canada.  Banks just don’t fail when they are (a) privately-owned, (b)  operating in a fairly stable environment (ie not newly deregulated), (c) not subject to government pressures to take on inappropriate risks, (d) where total assets have been growing no faster than nominal GDP for years, (e) strongly (and increasingly) capitalised, and (e) where the largest component of assets is residential mortgage loans.

As some commenters have pointed out, having been somewhat burned in 2008, perhaps rating agencies have an incentive to overstate risk at present. But even if that is true – and I’m not sure it is, after all the last few years have been characterised by a renewed and rather desperate global search for yield, any yield – it still can’t explain why S&P seem to see so much risk in New Zealand relative to the situation in other floating exchange rate advanced countries. Of flexible exchange rate OECD countries, only Turkey, Iceland and Hungary now have BICRA scores worse than New Zealand.

I don’t believe it.

Skills-based immigration: who has got Essential Skills work visas?

It is now 18 August, and I’m still waiting for MBIE’s response to my 28 May request for copies of advice on the economic impact of immigration and the permanent residence approval target.   The Act provides a basic response time for agencies of no more than 20 working days.

Last week I ran a series of posts (here) using data from MBIE’s website on the occupational breakdown of work visas granted for New Zealand over the years 2010/11 to 2014/15.   For a skills-focused immigration programme, a remarkably large number of the approvals were in not-obviously highly skilled occupational areas.

But as I noted last week, the 250000 or so approvals on the spreadsheet encompassed a variety of different types of approvals. Around 30000 were for a “specific purpose or event” (perhaps competitors in a professional sports tournament, or performers in a visiting professional orchestra). And more than 20000 were “variation of conditions” approvals, so including them was effectively double-counting people.

But the heart of the list is the category MBIE call “Essential Skills”. Of the 250678 total approvals over those five years, 101296 were applications approved under the Essential Skills category.

Around 2500 of these approvals don’t have an identified occupation, but what of the remaining 99000?

I went through the Essential Skills list and tried to pick out the occupations I’d highlighted last week as not looking overly highly skilled.   The chart shows those with more than 200 approvals – starting from the bottom with “Shelf Fillers”. These 39 occupations accounted for almost 43000 of the total Essential Skills work visa approvals, almost 45 per cent of the total. (As previously, I’ve deliberately left out construction-related positions because there is a different set of arguments around the role of temporary migration is dealing with a temporary one-off source of labour demand).

work visas essential skills

There is quite a range of occupations even on this list. Each person will probably look at the list and think of one or another occupation “oh, but that really is quite skilled”. And I’ve no doubt that most of them do involve some skill or other, but equally I’m pretty sure that looking across the list as a whole it is probably not what most New Zealanders have in mind when they hear that New Zealand has a skill-focused immigration programme, which is supposed to boost our national productivity through the spillovers from this skilled migration to the wider economy.  I certainly wasn’t what I had in mind. I’ve been critical of our migration policy on macroeconomic grounds – the sustained pressure on real interest and exchange rates – but have repeatedly accompanied that analysis with lines about “but we seem to focus pretty successfully on bringing in skilled people”.

And, as I’ve noted before, to get a visa under this Essential Skills category one needs to have a firm job offer from a New Zealand employer, which requires meeting this standard:

Evidence there are no New Zealand workers available

To get an approval in principle before you apply, or to show us that there are no suitable New Zealand workers available when you are applying, the employer has to show that they have genuinely searched for suitably qualified and trained New Zealand workers.

The employer also has to explain why:

  1. their particular job specifications are necessary for the work
  2. New Zealand applicants are not suitable, and
  3. New Zealand applicants cannot be readily trained.

There must be a huge amount of search activity going for those elusive chefs/cooks…..

Many other work visas (25000 or so over the five years of this data) are granted to people who are simply partners/spouses of students or someone who has got an Essential Skills visa approval. There appears to be no skill or occupational requirement for these people.

Unfortunately, the MBIE data do not indicate how long each work visa approval was for.   For lower-skilled occupations, visas are apparently typically for shorter-periods than those for higher-skilled occupations. That will mean that simply counting total approvals by occupation will overstate the effective share of lowly-skilled labour in the total inflows under the Essential Skills category.   But it is not obvious why we are granting Essential Skills work visas to shelf fillers, fast food cooks, cleaners, kitchen hands, waiters , or aged care workers at all.  It has the feel of something equivalent to “corporate welfare” –  employers smart or lucky enough to get on the list access labour that is cheaper than otherwise.   And this is all before we take into account people here on the numerous working holiday schemes.

Work visas are for a limited term, and are distinctly different from permanent residence approvals. Some of the latter are for genuinely quite highly-skilled people (on a skills criterion shelf fillers would not gain permanent residence approval). But as the Treasury material I commented on last week illustrated, in recent years only around half of even permanent residence approvals came under the “Skilled/Business” headings, and that heading included not just the skilled worker themselves (chefs and so on) but their immediate families.

There are all sorts of arguments for immigration. Some make cases on humanitarian grounds (genuine refugees), others on simply targeting a bigger population, some aiming for diversity or “superdiversity”. Some libertarians will even mount an “open borders” argument – that the world would be better off if everyone could simply move to where the opportunities were best for them. But New Zealand governments, over 25 years or so, have focused on skills-based arguments – that a large-scale immigration programme offers a way of supplementing local skills in ways that don’t just boost total numbers but which add to the productivity and living standards not just of the migrants themselves but of the local population.

I’m sceptical that we have had any such gains.. On the one hand, New Zealand – while attractive as a place to live – just isn’t that appealing (small, distant, underperforming) as a place to work and grow a business for the hardest-driving and most energetic of people. And the fact that the additional pressures on demand from immigration dominate any supply benefits in the short-term has meant that in a modest-savings economy, high inward immigration has put sustained pressure on real interest rates (highest in the advanced world for the last 25 years) and the real exchange rate.  Business investment, especially in the outward-oriented tradables sectors, has suffered, and continues to do so.

But these data tend to illustrate that our immigration programme isn’t really that skills-focused at all.  If so, it is hardly surprising that there are few/no signs of beneficial spillovers to the rest of us.   And the programme has just been further debauched: as I noted a couple of weeks ago, the government’s recent announcement of additional points for people going to the regions will simply lower the average quality of the migrants we let in. There is a lot of idle talk about attracting really top people, and “the next Bill Gates” is a common shorthand. But our politicians, and their advisers, need to face the fact that New Zealand just isn’t that attractive to such people, even if we could identify them. Our universities are not top-tier. Our market is small. And our country is remote.   As even the advocates acknowledge, even among the Anglo countries, why would you choose New Zealand if you could get into the US, the UK, Canada, Australia, or even Ireland (which may be no bigger, and have no better universities, but is within the EU and close to continental Europe).

It is time some pretty hard questions were asked about our immigration programme and strategy. The Australian government has had their Productivity Commission do two reviews in the last decade. It looks like an issue tailor-made for our own Productivity Commission to have a look at.  Perhaps the Secretary to the Treasury could then produce the evidence or arguments behind his rather glib assertions about the benefits to New Zealand of our very large immigration programme?

Can Steven Joyce’s confidence be taken entirely seriously?

I watched Q&A’s interview yesterday with Minister of Economic Development, Steven Joyce. He was resolutely upbeat, rather beyond the point where his case could be taken entirely seriously.

The Minister tried to reassure us by observing  that he’d taken a look at New Zealand’s previous four recessions and we weren’t facing anything like that. In particular, he assured us, the world economy was different.

I’m not sure which recessions the Minister had in mind. But here is the chart of six-monthly growth in real GDP back to the start of the official series. Six-monthly because of the popular lay definition of a recession as two consecutive negative quarters of GDP growth. It has never been entirely clear why that measure enjoys such popularity. Apart from anything else, it means something quite different in all those European countries or Japan with flat or falling populations than it does in, say, New Zealand, with 1.9 per cent estimated population growth in the last year. Two quarters of zero or negative GDP growth in New Zealand is a quite material hit to per capita GDP.

gdp 6 mth changes

My first observation about past recessions, or marked growth slowdowns, is that they almost always take officials (and probably ministers) by surprise. I reflect sadly on having been in policy/analysis roles in the Reserve Bank in each of the episodes in this chart where growth got to zero or negative. I’m pretty sure we didn’t expect or anticipate a single one of them. To take just the most recent examples:

  • The 2010 double-dip recession was such a surprise that the Reserve Bank had raised the OCR twice just as it was happening.
  • It wasn’t until several months into 2008 that the Reserve Bank recognised even the initial domestic recession

But you could go through published material from the Bank around each of these episodes and the story will be much the same. And I’m not trying to pick on the Bank. I’m pretty sure Treasury’s record would have been no better, and nor (consistently) would that of any of the market forecasters/economists. There would be nothing very unusual if, by the time the September or December national accounts numbers came out, it turned out that real GDP had been going backwards for some time, even as ministers and senior officials had been running the usual upbeat story.

My second observation is that while severe world downturns are bad for New Zealand, we haven’t needed global recessions to have a downturn in New Zealand. Our 1991 recession and our 2008/09 recession were part of common global (or advanced country) events, but our 2010 double-dip recession, our 1997/98 recession, and our 1988 recession were largely home-grown. The Minister wanted to take comfort from the state of the world economy, but I’m not sure why.   World growth rate estimates are no better than mediocre, and they rest on estimates of China’s growth which few people now take seriously. Growth in many other emerging market countries has been slowing, as their credit-booms exhausted themselves, and there is no sign of acceleration in the anaemic growth in most of advanced world. Commodity prices have been falling very sharply, and monetary authorities in many countries have been easing policy in the last 18 months. Perhaps the US Federal Reserve will raise interest rates next month, but if so it seems to be as much as response to the siren call of getting back to (questionable estimates of) a neutral interest rate, rather than because demand growth is putting much upward pressure on inflation.

There has been plenty of talk of New Zealand maintaining growth at around 2 or 2.5 per cent. But remember that in the last six months for which we have official data, real GDP rose by only 0.8 per cent. And that was the six months to March, when sentiment was still pretty upbeat, employment was growing strongly, and so on.   It is hard to believe that “true” growth in the rest of this year – and we are now half way from March to the end of the year – will have been stronger than it was in the six months to March. If it is only as strong, that produces an annual growth rate of not much more than 1.5 per cent. With building activity starting to go sideways, unemployment rising, and consumer and business sentiment down – and as the sharp fall in the terms of trade has grabbed the consciousness of many people – a much safer bet would seem to be lower growth. It isn’t clear to me why, say, one would bet on an average of anything more than zero growth for the next few quarters.

There has been talk of the “automatic stabilisers” working. Perhaps, but lets look at them. Fiscal automatic stabilisers are not particularly strong in New Zealand – which just reflects the fact that our maximum marginal tax rates are low, and our unemployment benefits are modest and at a fixed rate. Interest rates are falling, but they probably shouldn’t have been raised last year, and so far only half the increase in the OCR has been unwound. As I’ve noted previously, by the standards of past cycles in short-term interest rates, even a cut in the OCR to, say, 2 per cent by early next year would not be remotely aggressive.   And it is quite possible that medium-term inflation expectations are still falling – there have been suggestions of that from the bond market, for example. If so, real interest rates aren’t falling much at all.

iib infl expecs

And, of course, the exchange rate has fallen. As I noted last week, the fall over the three months to July was one of the largest short-term falls we’ve seen in the floating exchange rate period. But we’ve had one of the largest falls in commodity prices (and probably the terms of trade) on record, and I don’t think anyone would regard the TWI at just over 70 – where it has been for the last month or so – as particularly stimulatory. It is back at around the levels prevailing in 2010.

So combine subdued world demand growth, very deep falls in commodity prices, a levelling off in one of the biggest construction booms in modern times, continuing modest fiscal consolidation, subdued credit growth (except among distressed dairy farmers), real interest rates that remain very high by world standards, and a real exchange rate that has only dropped back to around the average level of the last 15 years, and it isn’t clear what is likely to hold up growth in New Zealand this year.

Of course, that migration-driven 1.9 per cent population growth helps boost demand. But since even at the peak of the migration inflows there was barely any real per capita GDP growth (and the level of the real per capita measure of income (ie allowing for the terms of trade) peaked in the March last year), that might be cold comfort. And the influx of people (especially the non-citizens) may well start to wane if the labour market conditions facing prospective employees keep on deteriorating.

Here’s one final chart. It shows annual growth in nominal GDP: already down to 2 per cent in the year to March, before this year’s fall in the terms of trade has been reflected in the national accounts. Only in previous recessions has annual growth in nominal GDP got any lower than it is at present.

ngdp apc

With the combination of mismanaged monetary policy, ebbing activity in one of the world’s largest economies (and major source of demand growth in recent years) and the very deep fall in commodity prices, it might be better to ask not “can we avoid a couple of negative quarters” – the technical recession question – but to ask instead what makes us confident we are not already in a renewed recession (real, as well as nominal), perhaps already deepening? I don’t purport to do quarterly GDP forecasts, and would be happy to be wrong on this one, but presented with the raw New Zealand data it looks like the sort of conclusion a visiting analyst from Mars might easily reach.

Downturns, recessions, corrections don’t last for ever.  And they don’t, in the end, make that much difference, to the longer-term (rather disappointing) performance of the New Zealand economy.  But for individuals –  particularly the 148000 unemployed, and the others likely to be joining them –  and business owners they can matter a great deal.  Some variability is natural and unavoidable (the two aren’t the same thing) but macroeconomic management should have been able to have prevented unemployment rising again before it ever quite recovered from the last two recessions, and to have avoided any new recession.  It looks to have failed already on the first count, and the outlook doesn’t seem promising on the second.

Skills-based migration: completing the alphabet

The two charts below capture the numbers of work visas given for each of the occupations shown (only those with 200 or more approvals are shown).

First, the letters e to l  (there were 51 economist approvals by the way).  There aren’t the big and egregious examples we’ve seen in some of the other charts, but one has to wonder about the number of fast food cooks, the kitchen-hands, motel receptionists, hairdressers, and hospitality workers.

work visas e to l

And then, finally, the letters m to p.  Nannies, personal assistants, massage therapists, personal care assistants, and even office managers raised a few questions.  And I shouldn’t pass over ministers of religion.  I’ve been in a parish that imported a British vicar, and I’m always surprised at the number of New Zealand parishes that advertise vacancies in the British Anglican weekly I subscribe to

work visas m to p

That completes the trip through the alphabet.  I think my point –  that there are very large number of not very highly-skilled positions for which work visas are being granted, often as “Essential Skills –  has been made, but I might try to bring some of the numbers together in a slightly more aggregated way next week.

I guess they got South Canterbury Finance very wrong, but…..

At the end of 2008 South Canterbury Finance was rated BBB- by Standard and Poors.  Earlier that year, it has issued three year bonds (themselves rated BBB-) in the US private placement market.   BBB- wasn’t such a bad credit rating for a small, not overly diversified unregulated domestic lender.  But a year or two later, SCF failed spectacularly, at considerable cost to the taxpayer.

Today, S&P has come out downgrading the standalone ratings of three of the four big banks to BBB+.  Of course, that is still two notches above SCF’s rating, but if it is really justified  the news would have to be quite concerning.  Note that the overall issuer credit ratings remain at AA-, reflecting the combination of probable parental support and the possibility of government support (for these systemically significant banks) in the event that they get into trouble.  Their assessment of the risk of investors losing money hasn’t changed.

But it is the standalone rating that is meant to reflect the quality of each bank’s loan book.

Recall that the RBNZ and APRA stress-tested the large banks only last year.  The stress scenarios were very demanding –  a 50 per cent fall in house prices and an increase in the unemployment rate larger than any seen in floating exchange rate countries in the post-war decades.  And the banks’ loan books came through with flying colours, and the actual capital of each of the banks was not impaired at all (capital ratios fell because risk weights on the remaining loans rose).

Here is a chart of capital ratios from the stress test scenarios from the November FSR

CET

If Standard and Poor’s are right there must be something very wrong with the Reserve Bank stress test results.  Not that much has changed in the make-up of banks’ portfolios in the last 12-18 months for the difference to be about new, much riskier, loans being made.  My bias is to run with the stress test results –  perhaps they are a little optimistic, but probably not too much.  But the Governor doesn’t seem to believe them, and neither apparently does one of the leading rating agencies.  If the Bank is really sceptical then it is really past time for it to lay out any reasoning, and evidence, it has as to why the stress test results are not now a good guide to the standalone health of the major banks.

Skills-based migration: q to v

I’ve had quite a few comments and questions on these data.  I want to be clear what they are.   They are drawn from an MBIE spreadsheet, usefully posted on their immigration statistics page, which contains all work visa applications over the years 2010/11 to 2014/15, over 300000 of them.  Around 60000 were declined, and I’ve just deleted those.  Another 60000 or so don’t specify an occupation.  That includes working holiday visas and a variety of others.  I’ve also not looked any further at those.  The charts in this series have been taken from the remaining 190000 or so successful applications.

And 190000 is, of course, not some net inflow of people over that period.  Some of the applications might have been people here for only a few weeks or months (eg specific event visas).  There are plenty of “variation of conditions” approvals, which are presumably multiple approvals for the same person.  And the same position might have been filled over five years by, say, five different foreign job-holders.    All I have sought to show that, of the large number of work visa approvals over the last five years a surprisingly large proportion have been for positions that don’t appear particularly highly-skilled, and which aren’t what most people (well, me anyway) had in mind when they hear of a skills-based immigration programme  (and this should, presumably be the most skills-oriented component of the overall programme –  refugees and family reunification visas have a different focus).

With that prelude, here is the chart for the letters q to v

work visas q to v

And what caught my eye this time?  A surprising number of truck drivers (if all ours really went to the West Australian mines, higher wages here would have been the market response I’d have thought), and huge number of aged-care nurses (to complement the even greater number of aged-care workers we saw the other day).

And then there was the retail sector –  more than 7000 retail supervisors and retail managers, mostly applying under an “Essential Skills” category.  Every single one of those shelf-fillers also applied under the Essential Skills category.

Somehow it doesn’t have the feel of a productivity-enhancing skills-focused programme.      Too often these have the feel of something where employers in particular sectors are rewarded for their lobbying skills in getting the particular occupational “skills” they want to employ on the approved list.  By contrast, the usual market response to shortages in particular occupations is for the relative wage for that occupation to rise.  And if the shortages are pervasive enough  –  unlikely over recent years when the unemployment has lingered around 6 per cent –  monetary policy tightens to keep overall demand in check.  Running approved lists of “essential skills” or areas of skill shortages is, in any case, a flawed strategy. It eases pressures on employers of that particular occupation, but since in the short-term demand effects of immigration outweigh supply effects (the standard result in New Zealand macro studies), any gain for employers in a single sector is outweighed by the additional demand pressures elsewhere in the economy.

Statistics New Zealand and the “population ponzi”

In the last few years, Statistics New Zealand has taken to “spinning” its statistical releases.  I use the term advisedly.  I’m sure all the numbers are reported entirely accurately, but my issue is more with which numbers, and which comparisons, they choose to highlight.  Almost always, they seem to emphasise what staff (and management?) presumably regard as good news.  Is that quite the job of a national statistics agency?  Personally, I value good quality data, and technical explanations for apparent oddities –  and the assurance that SNZ has no agenda other than good quality data, adequately explained.  There are plenty of others out there (backbenchers in parliamentary questions?) to highlight the good, or not so good.

The latest example came this morning, with the population data release below.

It might be mildly interesting to know that population growth in the last year outstripped that even in  –  much richer and more successful –  Australia.  But SNZ seems to think this is “a good thing” –  if anything reporting it as something of a race.   Fortunately, we aren’t  early 20th century France needing to stress about the growing military threat from a larger neighbouring country’s faster population growth.  And if we want to celebrate success, I’d suggest doing it using measures of per capita living standards (however you want to define them) or even productivity.  But leave it to the commentators and politicians to do the cheerleading.

Just to illustrate the apparent “good news bias”, SNZ put another release this morning.  Real retail sales rose only 0.1 per cent in the June quarter.  But there was no mention of what happened in Australia.  I checked, and in Australia the comparable series rose by 0.8 per cent in June quarter.  In per capita terms, I guess that gap is a little larger still.

SNZ does a pretty good job with the inadequate resources they have, but I’d urge then to leave the editorialising to journalists, commentators, politicians and the like.

Population growth outpaces Australia’s – Media release

14 August 2015

New Zealand’s population is growing at its fastest rate for over a decade, and is exceeding Australia’s growth rate, according to new estimates released by Statistics New Zealand today.

The country’s population grew by 86,900 people, or 1.9 percent, in the year to 30 June 2015. This came from net migration (arrivals minus departures) of 58,300, and natural increase (births minus deaths) of 28,700. New Zealand’s estimated resident population was 4.6 million at 30 June 2015. The latest figures
show Australia’s population growing at 1.4 percent a year.

“The last time New Zealand’s population grew at this rate was in 2003 when the increase was 2 percent,” population statistics manager Vina Cullum said. “The last time New Zealand’s growth rate exceeded Australia’s was 2004.”